The following table gives the number of failures of commercial industries in a country during the year 1975 to 1990
Year 19751976197719781979198019811982Number of failures 2326283220121210Year 19831984198519861987198819891990Number of failures 913111412931
Draw a graph illustrating these figures. Calculate the 4 yearly moving averages and plot then on the same graph
The correct Answer is:(##SCHOPMISCMATXIMT01_E01048_A01##)
Topper's Solved these Questions
Similar Questions
The following table gives the number of failures of commercial industries in a country during the year 1975 to 1990

Draw a graph illustrating these figures. Calculate the 4 yearly moving averages and plot them on the same graph.
View SolutionThe following table gives the numbers of failures of commercial industries in a country during the years 2000 to 2015.

Draw a graph illustrating these figure.
Calculate the 4 yearly moving averages and plot them on the same graph.
View Solution
Knowledge Check
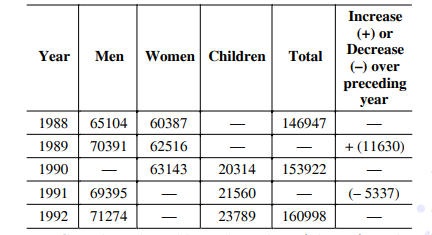
Following table gives the population of a from 1998 to 1992

complete the table and mark a tick against the correct answer in each question
Number of men in 1990 is -----A40645B60454C70465D58835In each of the following questions, find out the wrong number in the series.
1956, 1968, 1976, 1982, 1988, 1992A1956B1976C1982D1992Who was the prime minister of India during ''the Emergency'' between the year 1975 to 1977?
AIndira GandhiBCharan SinghCMoraj DesaiDRajiv Gandhi
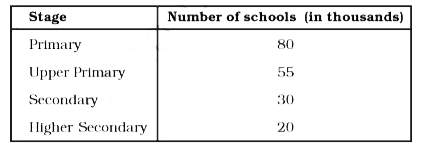
The following table gives the data of number of schools (stage-wise) of a country in the year 2002.

Draw a bar graph to represent the above data:
View SolutionWho was the prime minister of India during “the Emergency” between the years 1975 to 1977?
View SolutionWho was the President of India during the emergency of 1975-1977?
View SolutionThe failure of crops in successive years put the farmer in a tight corner.
View Solution9,12,11,14,13…15
View Solution
