The number of letters in thousands received in Kolkata GPO on each day of fortnight is given below :

Draw the graph of these figures. Calculate a set of moving averages using the most number of observations. Give reason for you choice. Plot these moving averages on the same graph.
The correct Answer is:Trend values are 47,55,52.33,6033,64.33,56.67,60.67,49.67,55.33,52.33,63.33,69.67
Topper's Solved these Questions
Similar Questions
Calculate 4- yearly moving averages of the following time series of steel production :

Plot these and the original figures in the same graph.
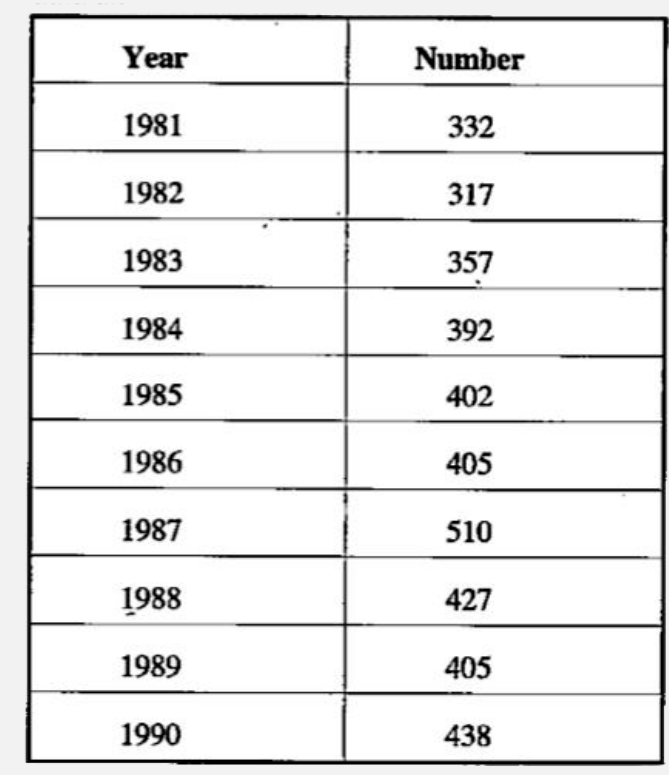
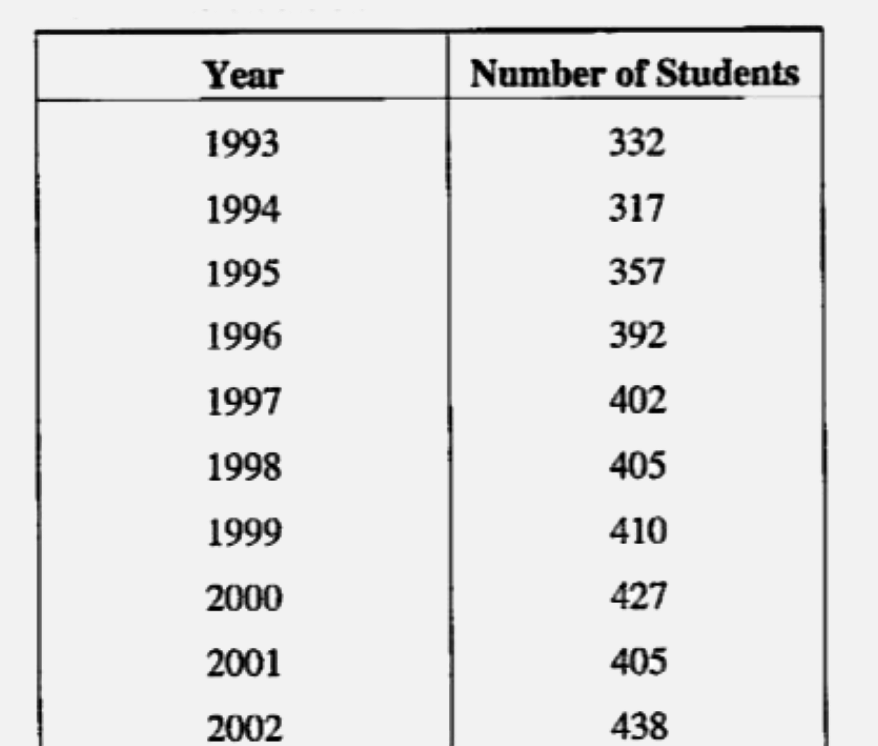
View SolutionCalculate five yearly moving average of the number of students of who have studied in a school given below.

View SolutionCalculate the 5 yearly moving averages of the number of students in a College from the following data and plot them on a graph paper :

View SolutionFrom the details given below, calculate the five yearly moving averages of the number of students who have studied in a school.

View SolutionThe following table gives the number of failures of commercial industries in a country during the year 1975 to 1990

Draw a graph illustrating these figures. Calculate the 4 yearly moving averages and plot them on the same graph.
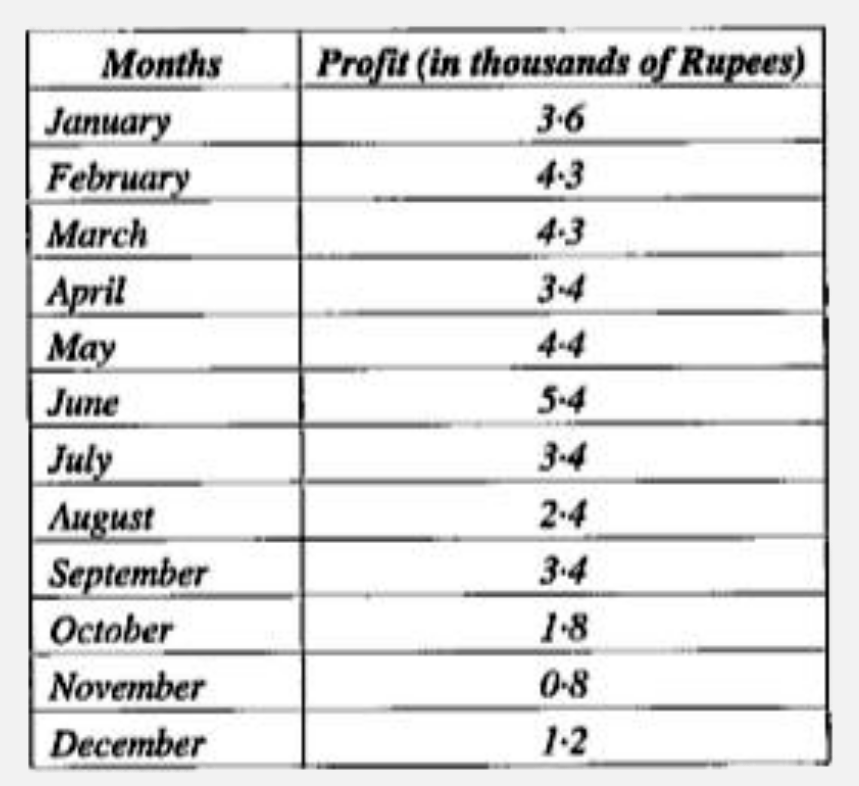
View SolutionThe profit of a soft drink firm (in thousands of rupees) during each month of the year is as given below:

Calculate the four monthly moving averages .
View SolutionThe following table gives the numbers of failures of commercial industries in a country during the years 2000 to 2015.

Draw a graph illustrating these figure.
Calculate the 4 yearly moving averages and plot them on the same graph.
View SolutionThe averge number , in thousands , of working hours lost in strikes each year of the period 2000-2009 was as under

. Calculate the three - yearly moving averages .
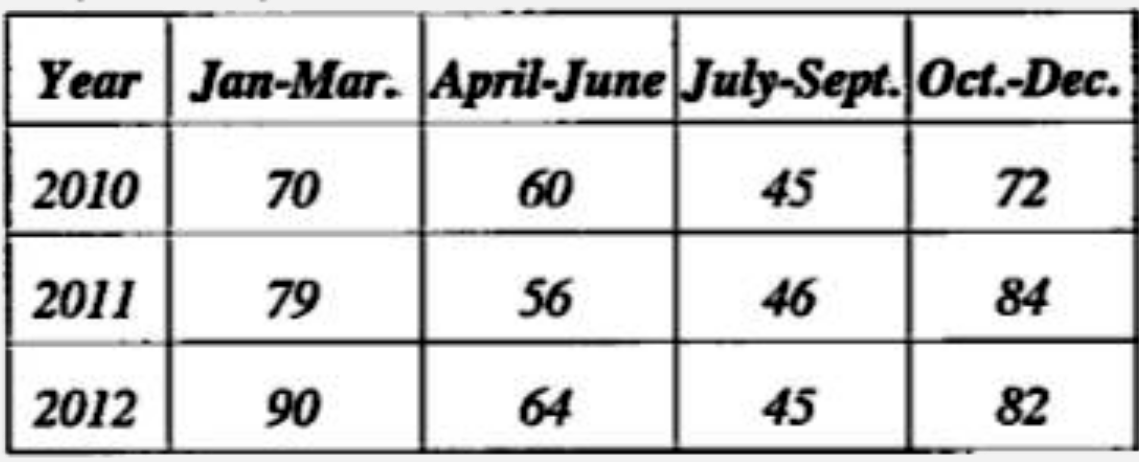
View SolutionThe number of road accidents in the city due to rash driving over a period of 3 years, is given in the following table :

Calculate four quarterly moving averages and illustrate them and original figures on one graph using the same axes for both.
View SolutionIn a typhoid epidemic ,the number of cases diagnosed were as follows. Calculate 6 days moving average and display them and the original figures on the same graph.

View Solution
