A velocity–time graph is given for a particle moving in x direction, as below
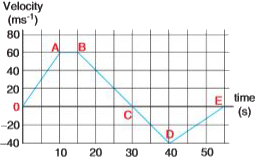
Describe the motion qualitatively in the interval 0 to 55 s .
From O to A: (0 s to 10 s )
At t = 0 s the particle has zero velocity. Att>0, particle has positive velocity and moves in the positive x direction. From 0 s to 10 s the slope (dvdt) is positive, implying the particle is accelerating. Thus the velocity increases during this time interval.
From A to B: (10 s to 15 s )
From 10 s to 15 s the velocity stays constant at 60ms−1. The acceleration is 0 during this period. But the particle continues to travel in the positive x-direction.
From B to C : (15 s to 30 s )
From the 15 s to 30 s the slope is negative, implying the velocity is decreasing. But the particle is moving in the positive x direction. At t = 30 s the velocity becomes zero, and the particle comes to rest momentarily at t = 30 s .
From C to D: (30 s to 40 s )
From 30 s to 40 s the velocity is negative. It implies that the particle starts to move in the negative x direction. The magnitude of velocity increases to a maximum 40ms−1
From D to E: (40 s to 55 s )
From 40 s to 55 s the velocity is still negative, but starts increasing from −40ms−1 At t = 55 s the velocity of the particle is zero and particle comes to rest.
Topper's Solved these Questions
- KINEMATICSBOOK - NCERT TAMILCHAPTER - KINEMATICSEXERCISE - EXERCISE (I. Multi Choice Question)
15 Videos
- KINEMATICSBOOK - NCERT TAMILCHAPTER - KINEMATICSEXERCISE - EXERCISE (IV. Exercises )
20 Videos
- HEAT AND THERMODYNAMICSBOOK - NCERT TAMILCHAPTER - HEAT AND THERMODYNAMICSEXERCISE - EVALUATION (Numerical Problems)
13 Videos
- KINETIC THEORYBOOK - NCERT TAMILCHAPTER - KINETIC THEORYEXERCISE - ADDITIONAL EXERCISE
4 Videos
Similar Questions
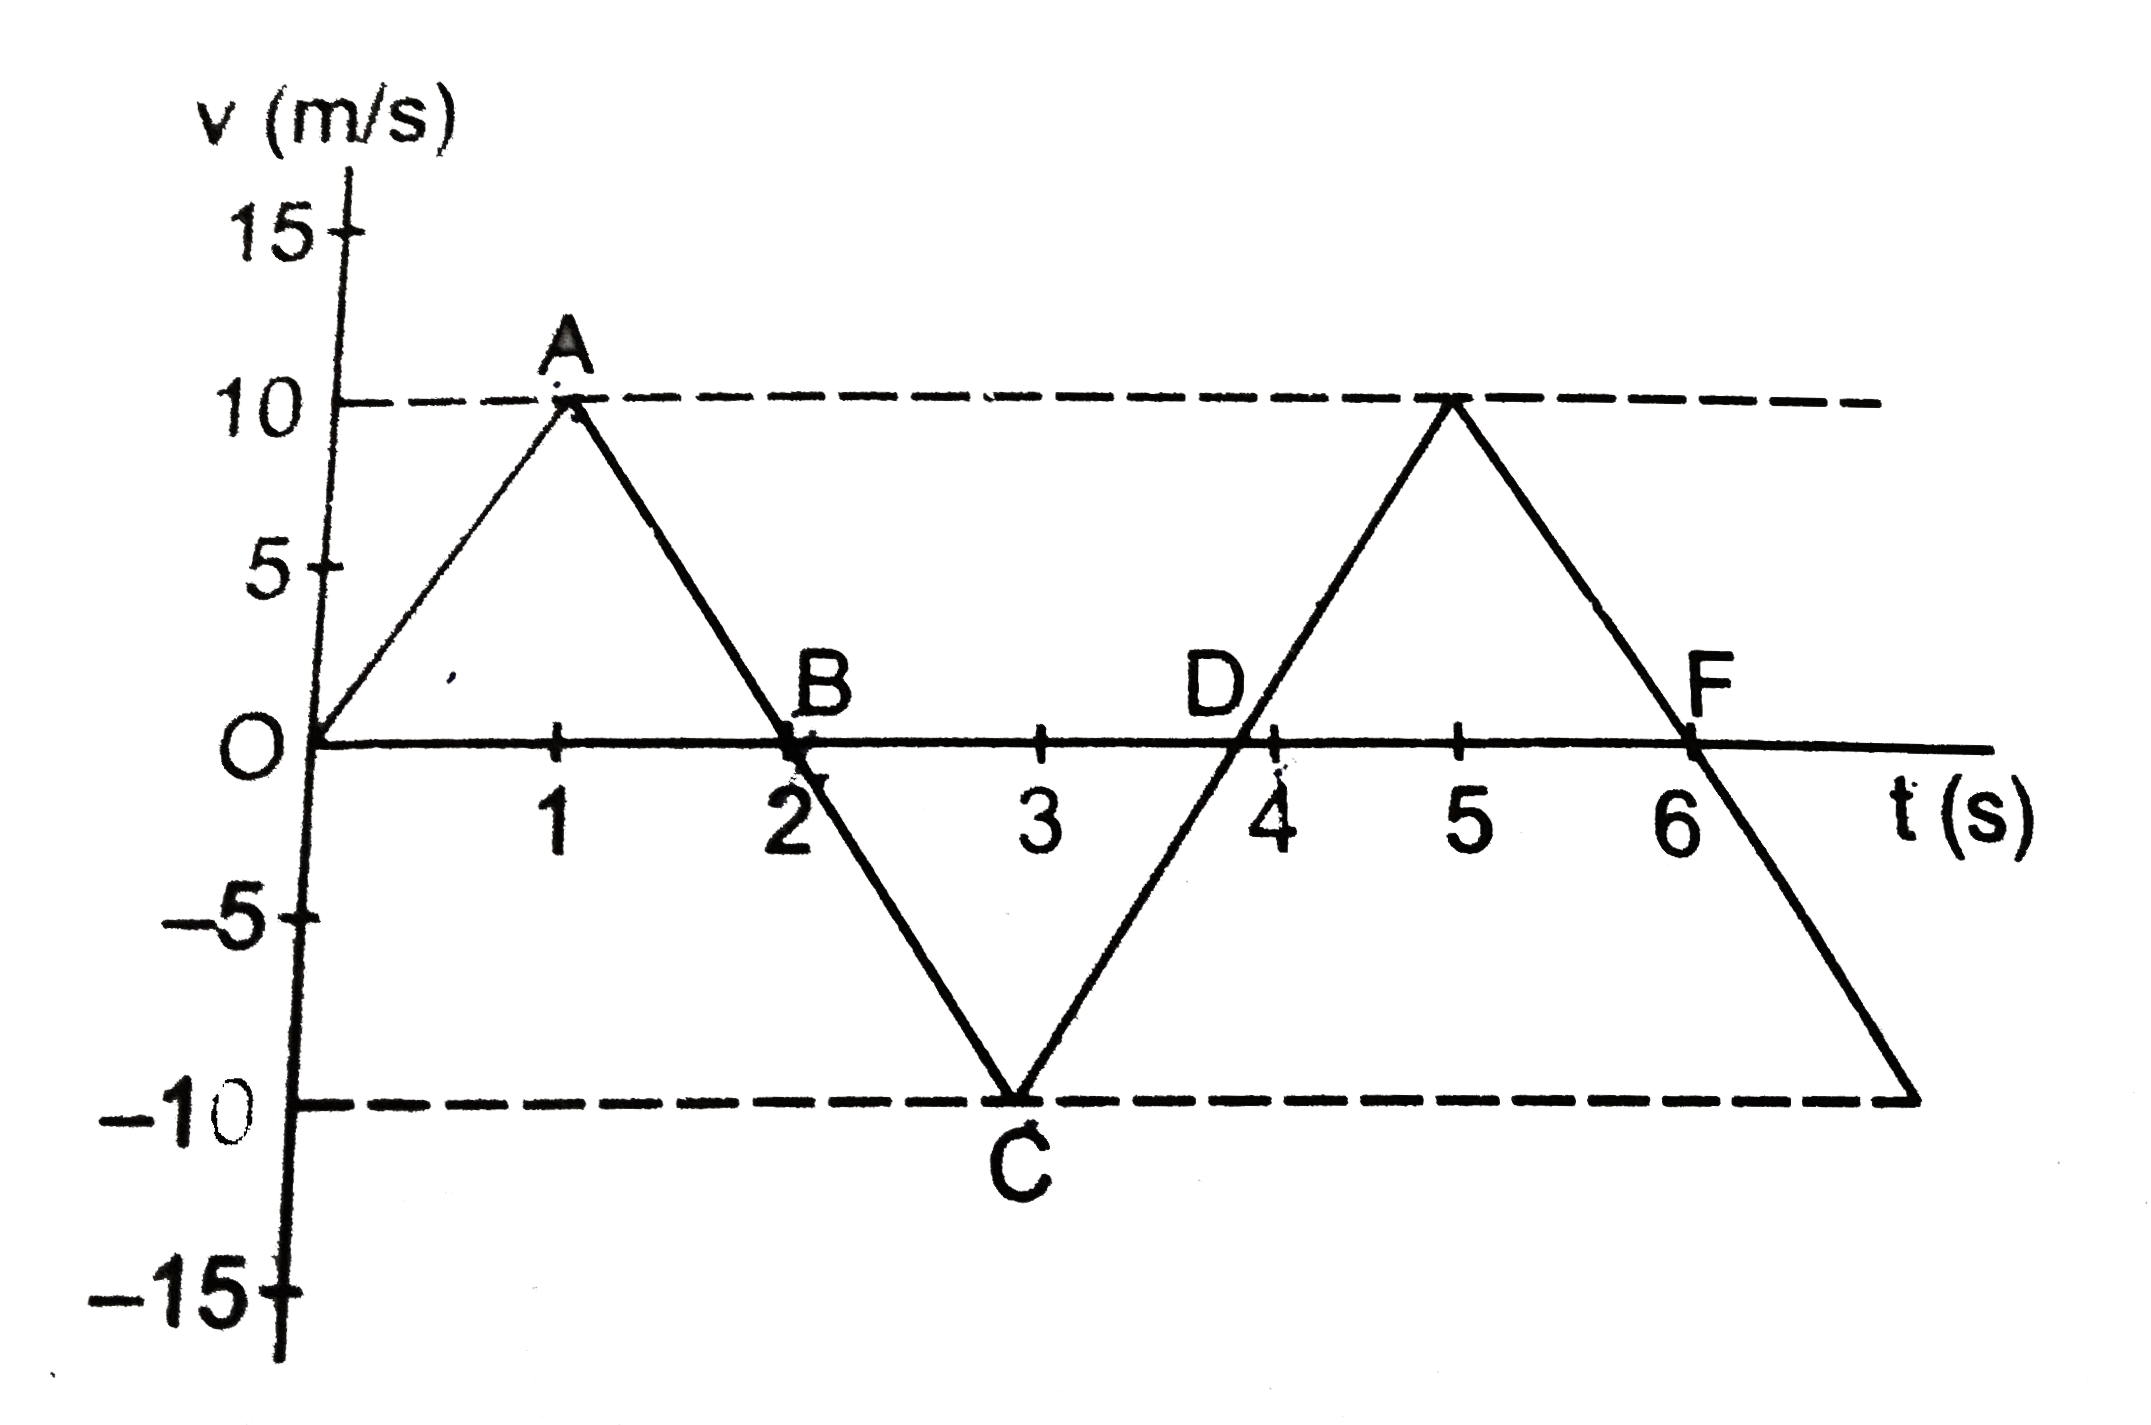
From the veloicty time graph of a particle given in figure describe the motion of the particle qualitively int eh interval 0 to 4s. Find a. the distance travelled during first two seconds, b. during the time 2s to 4s, c. during the time 0 to 4s d. displacement during 0 to 4 s. e. acceleration at t=1/2 and f. acceleration at t=2s
 .
.
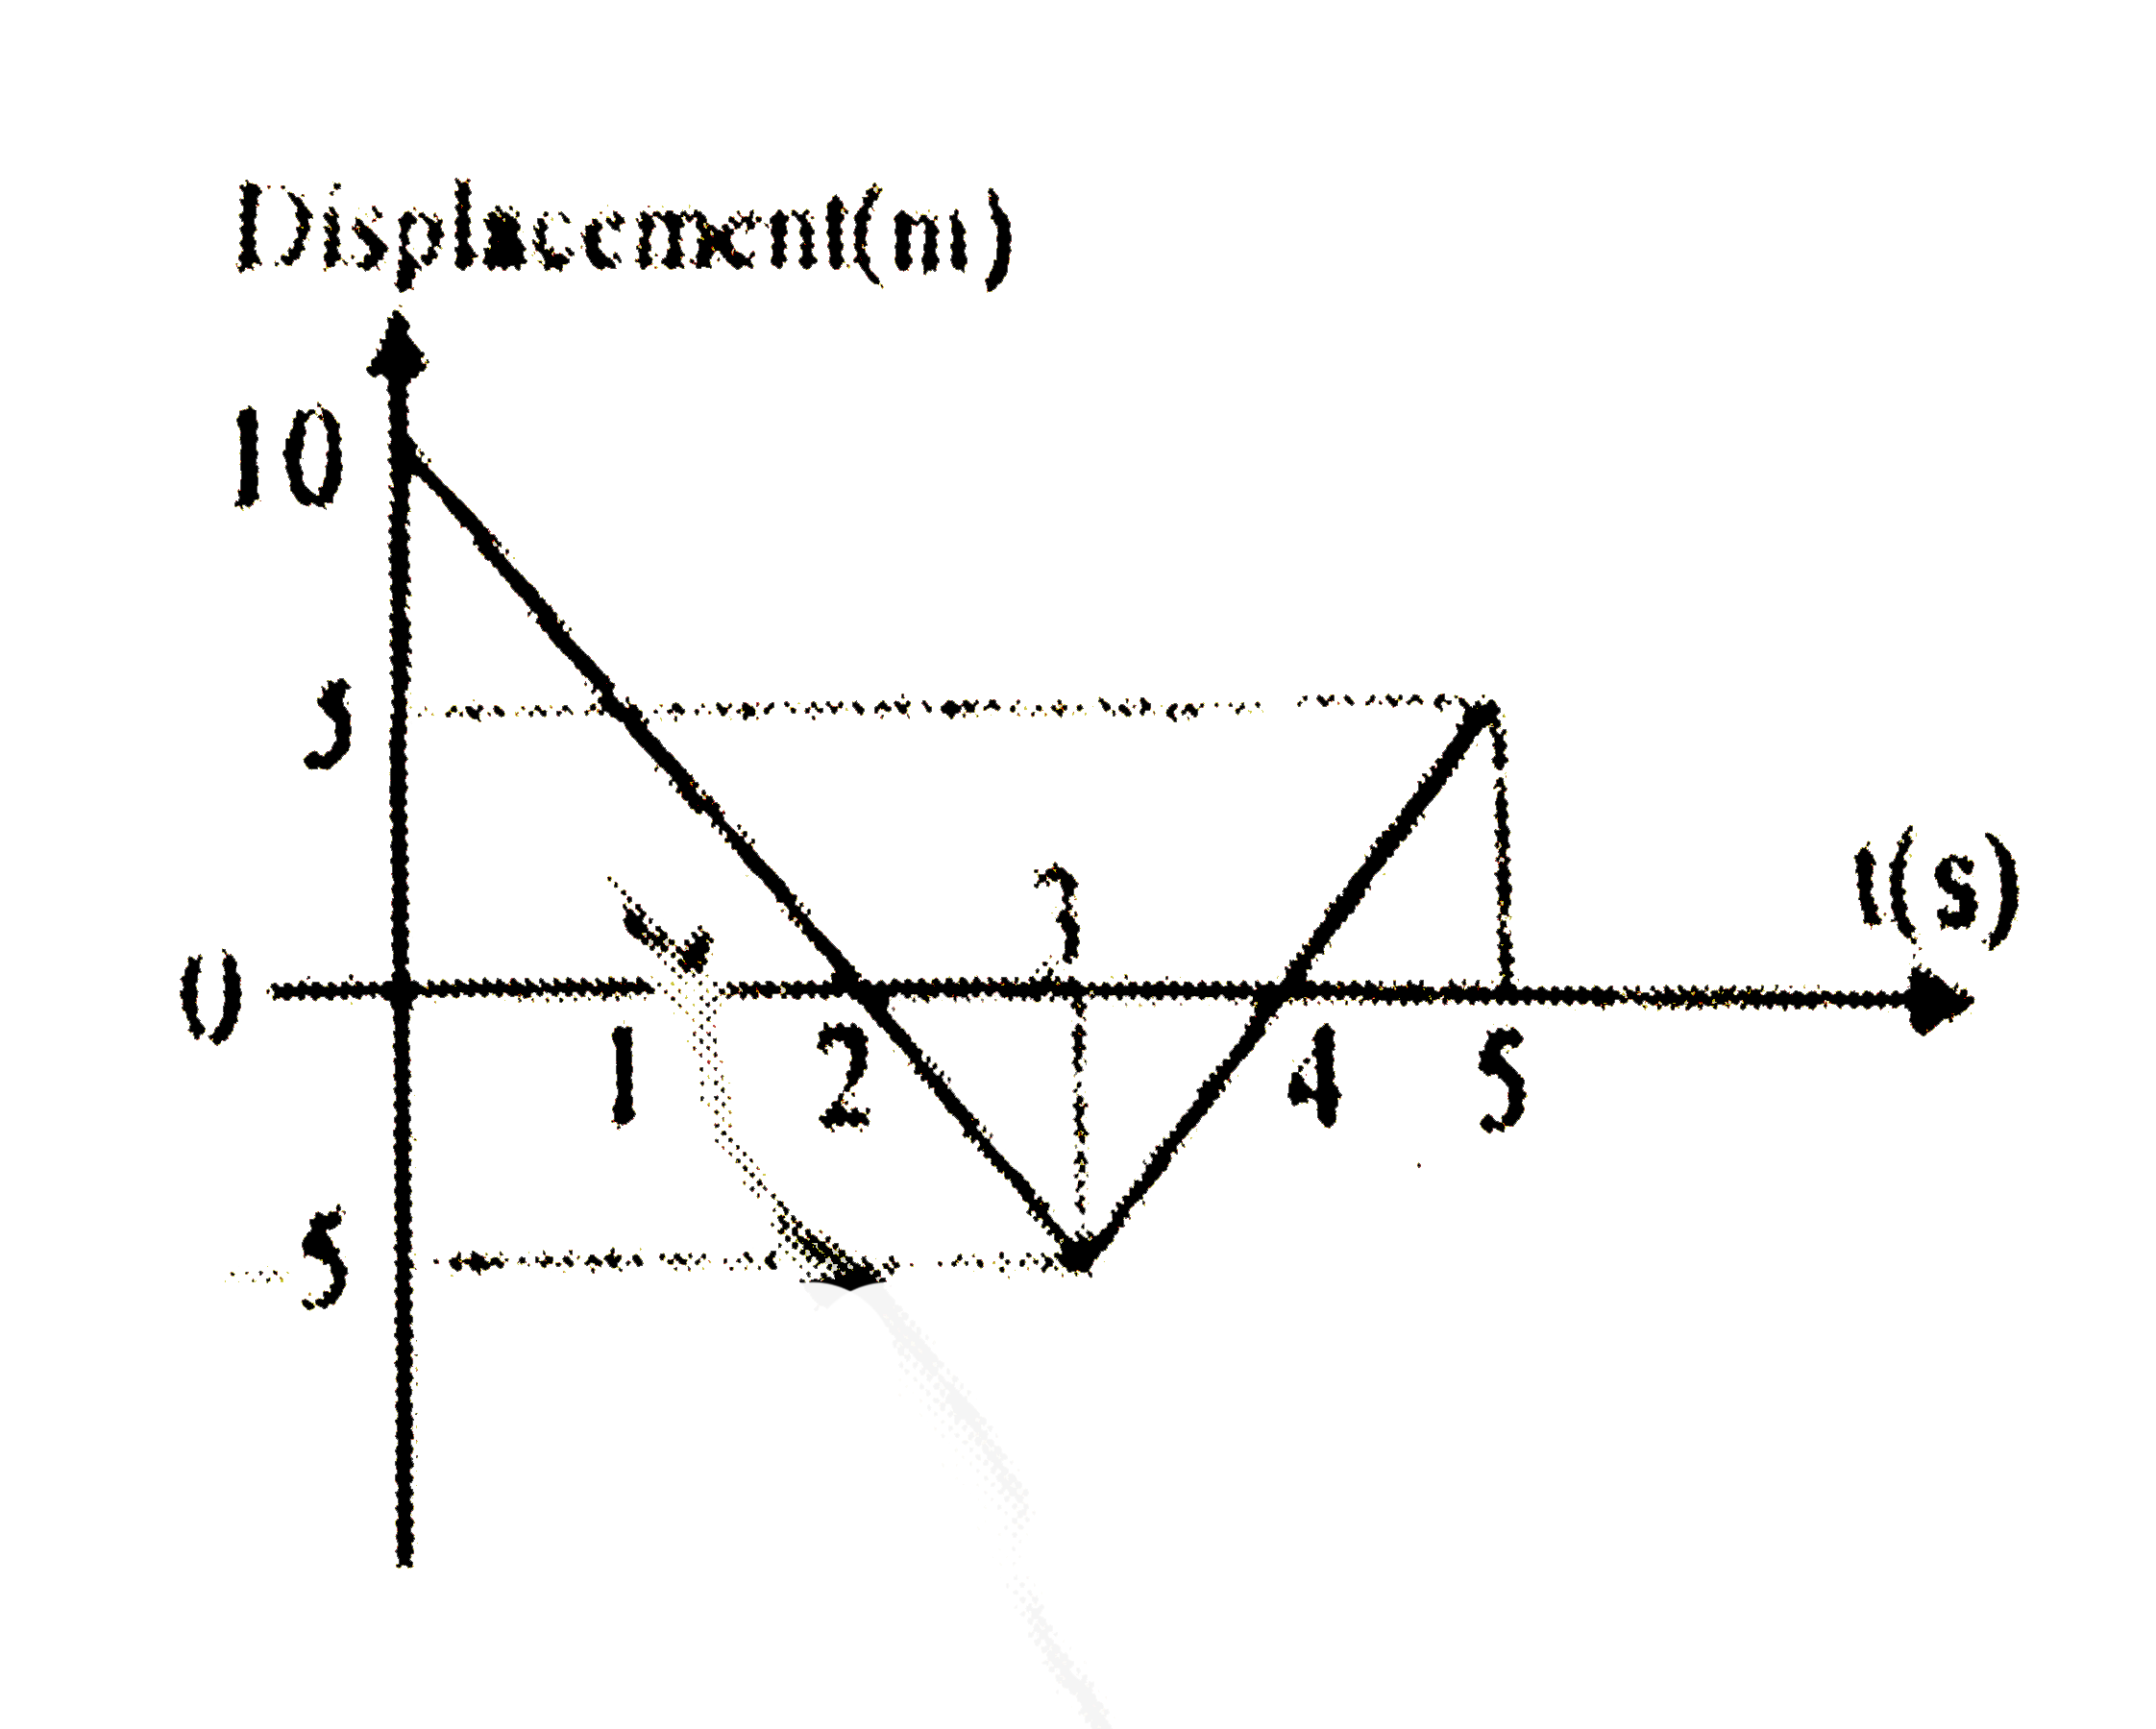
View SolutionThe diagram shows the displacement - time graph for a particle moving in a straight line. The distance (in m) coverted by the particle in the time interval t=0 to t=5s is
View Solution
Knowledge Check
From the veloicty time graph of a particle given in figure describe the motion of the particle qualitively int eh interval 0 to 4s. Find a. the distance travelled during first two seconds, b. during the time 2s to 4s, c. during the time 0 to 4s d. displacement during 0 to 4 s. e. acceleration at t=1/2 and f. acceleration at t=2s
 .A20m 20mB20m 30mC30m 20mD10m 20m
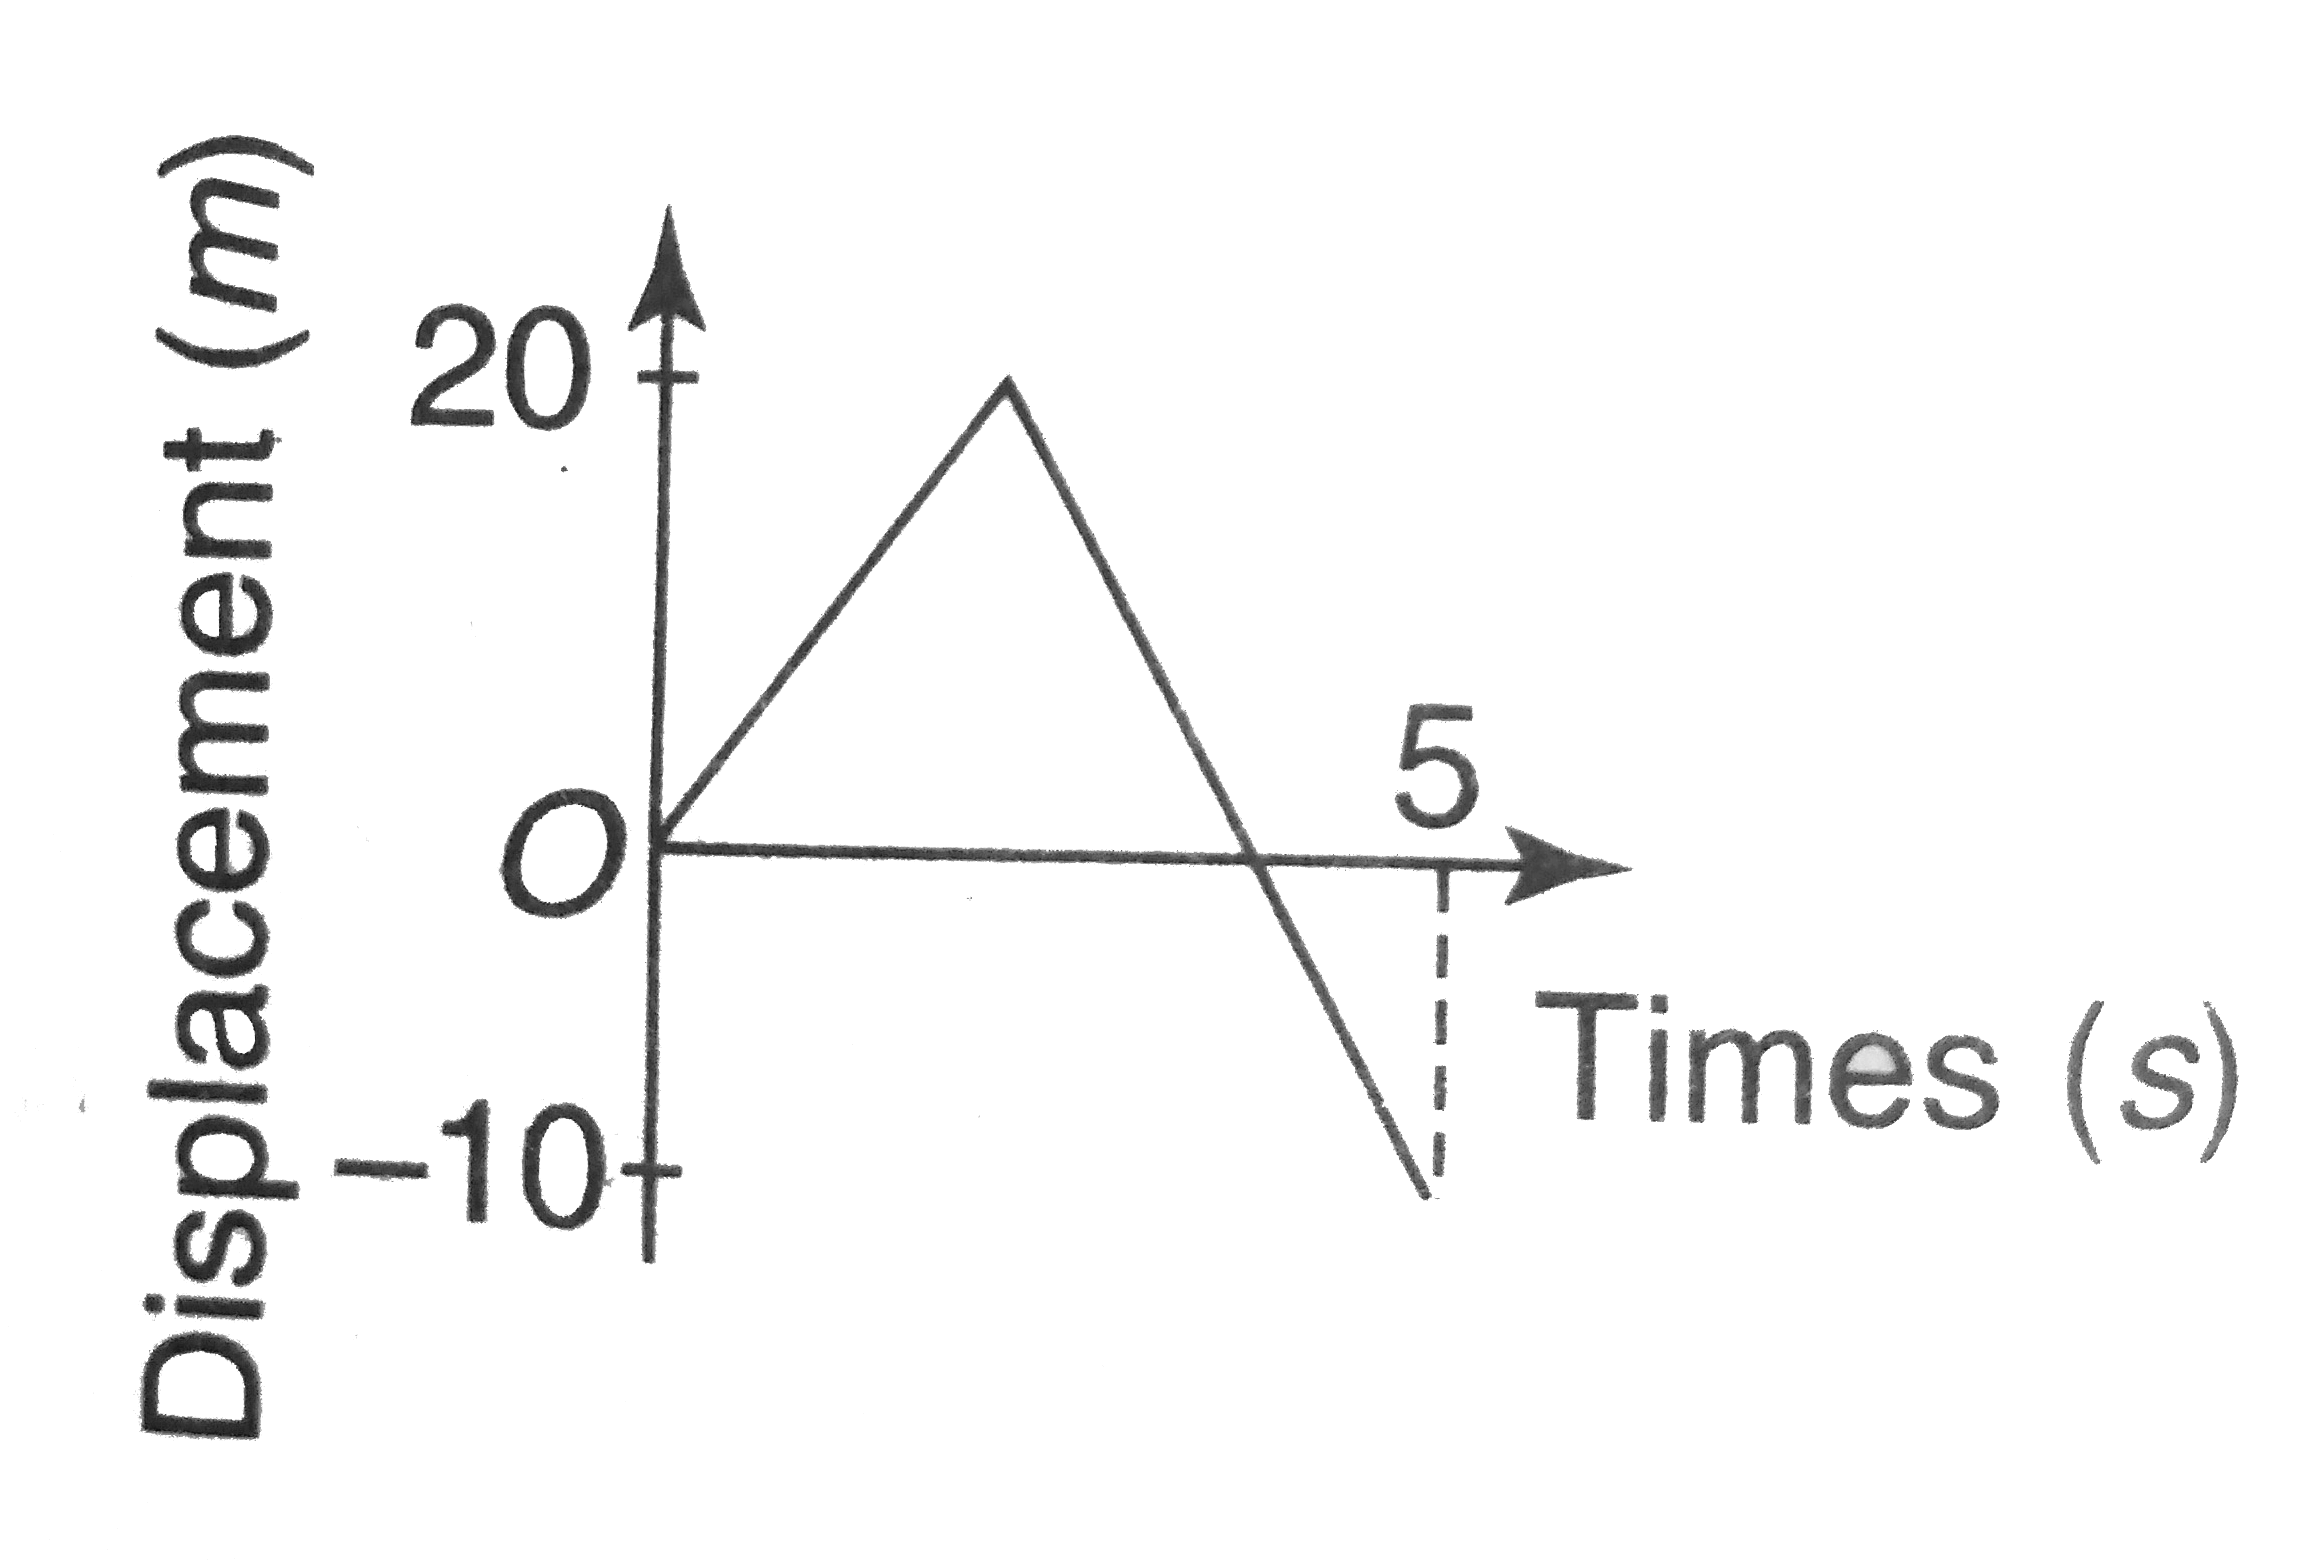
The diagram shows the displacement-time graph for a particle moving in a straight line. Find the average velocity for the interval from t=0 to t=5s.
 A−2ms−1B2ms−1C−4ms−1D4ms−1
The diagram shows the displacement-time graph for a particle moving in a straight line. Find the average velocity for the interval from t=0 to t=5s.
 A−2ms−1B2ms−1C−4ms−1D4ms−1
The diagram shows the displacement - time graph for a particle moving in a straight line. The distance (in m) coverted by the particle in the time interval t=0 to t=5s is

View SolutionThe position verus time graph time graph for a certain particle moving along the x-axis is shown in . Find the average velocity in the time intervals (a) 0 to 2s, (b) 2s to 4s, and (c) 4,s to 7s,
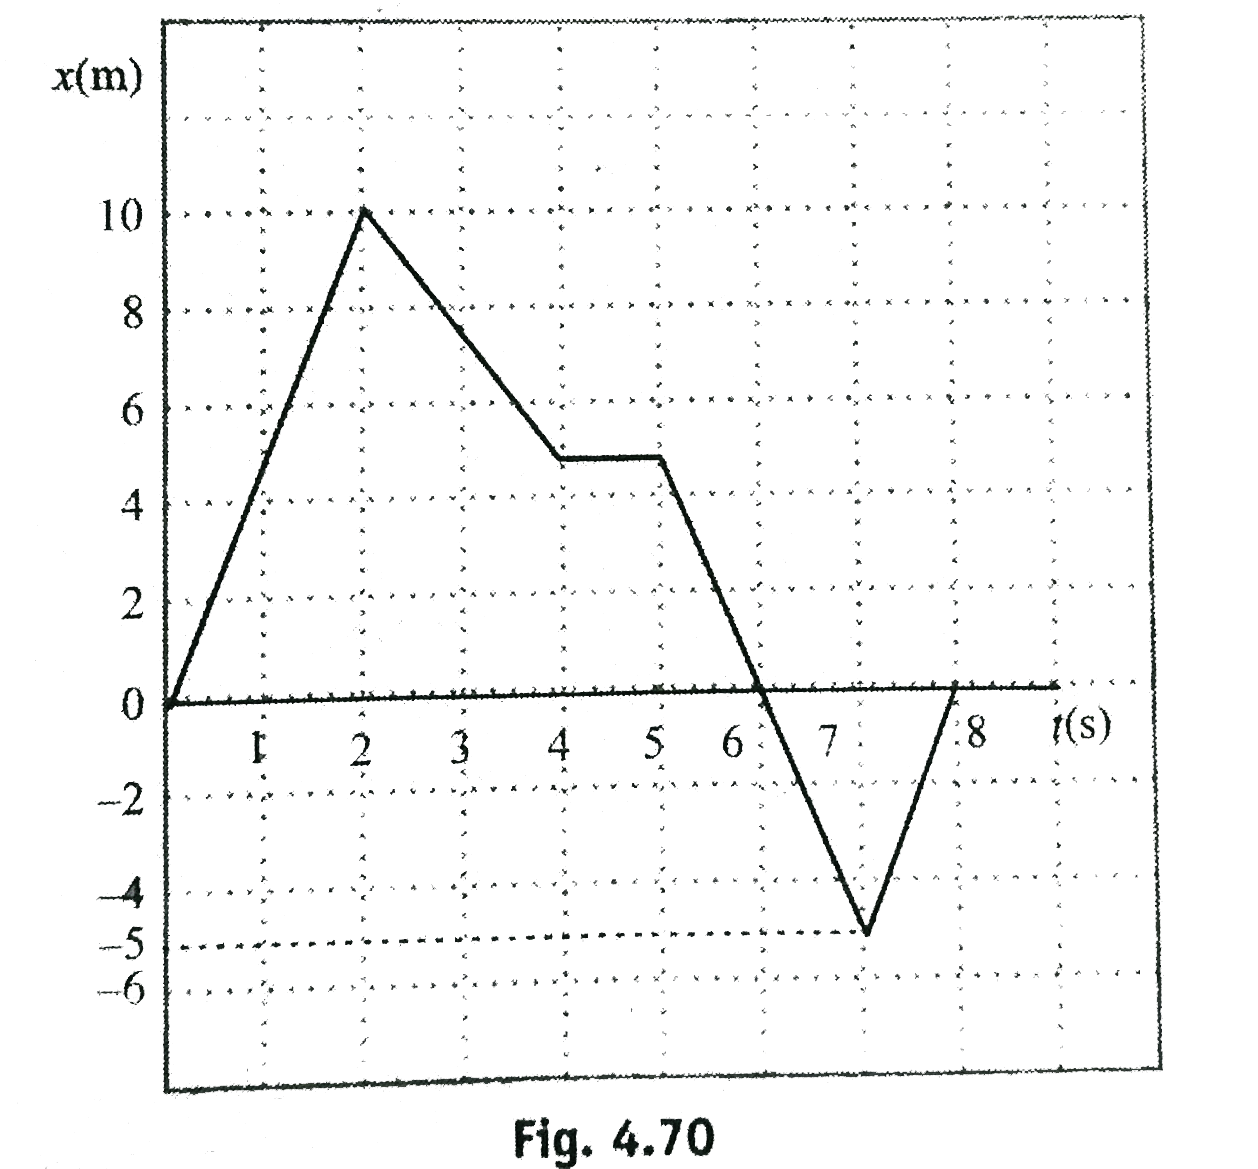 .
.
View SolutionThe position verus time graph time graph for a certain particle moving along the x-axis is shown in . Find the average velocity in the time intervals (a) 0 to 2s, (b) 2s to 4s, and (c) 4,s to 7s,
 .
.
View SolutionThe area under velocity-time graph for a particle in a given interval of time represnets
View SolutionThe area under velocity-time graph for a particle in a given interval of time represents
View Solution
