A velocity–time graph is given for a particle moving in x direction, as below
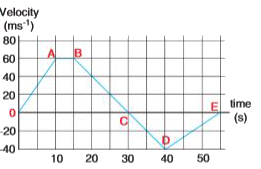
Find the acceleration at t = 5 s and at t = 20 s
The acceleration is given by the slope in the velocity-time graph. In the first 10 seconds the velocity has constant slope (constant acceleration). It implies that the acceleration a is from v1=0 to v2=60ms−1.
Hence a=v2−v1t2−t1 gives
a=60−010−0=6ms−2
Next, the particle has constant negative slope from 15 s to 30 s . In this case v2=0 and v1=60ms−1. Thus the acceleration at t = 20 s is given by a=0−6030−15=−4ms−2. Here the negative sign implies that the particle has negative acceleration.
Topper's Solved these Questions
- KINEMATICSBOOK - NCERT TAMILCHAPTER - KINEMATICSEXERCISE - EXERCISE (I. Multi Choice Question)
15 Videos
- KINEMATICSBOOK - NCERT TAMILCHAPTER - KINEMATICSEXERCISE - EXERCISE (IV. Exercises )
20 Videos
- HEAT AND THERMODYNAMICSBOOK - NCERT TAMILCHAPTER - HEAT AND THERMODYNAMICSEXERCISE - EVALUATION (Numerical Problems)
13 Videos
- KINETIC THEORYBOOK - NCERT TAMILCHAPTER - KINETIC THEORYEXERCISE - ADDITIONAL EXERCISE
4 Videos
Similar Questions
The velocity-time graph of a moving particle is given below. The acceleration of the particle at t = 5 s will be
View SolutionThe velocity-time graph of a particle moving along a straight line is shown is . The rate of acceleration and deceleration is constant and it is equal to 5ms−2. If the a average velocity during the motion is 20ms−1, Then
 .
.
The value of t is.
View Solution
Knowledge Check
The velocity-time graph of a particle moving along a straight line is shown is . The rate of acceleration and deceleration is constant and it is equal to 5ms−2. If the a average velocity during the motion is 20ms−1, Then
 .
.
The value of t is.A5sB10sC20sD5√2sThe diagram shows the displacement-time graph for a particle moving in a straight line. Find the average velocity for the interval from t=0 to t=5s.
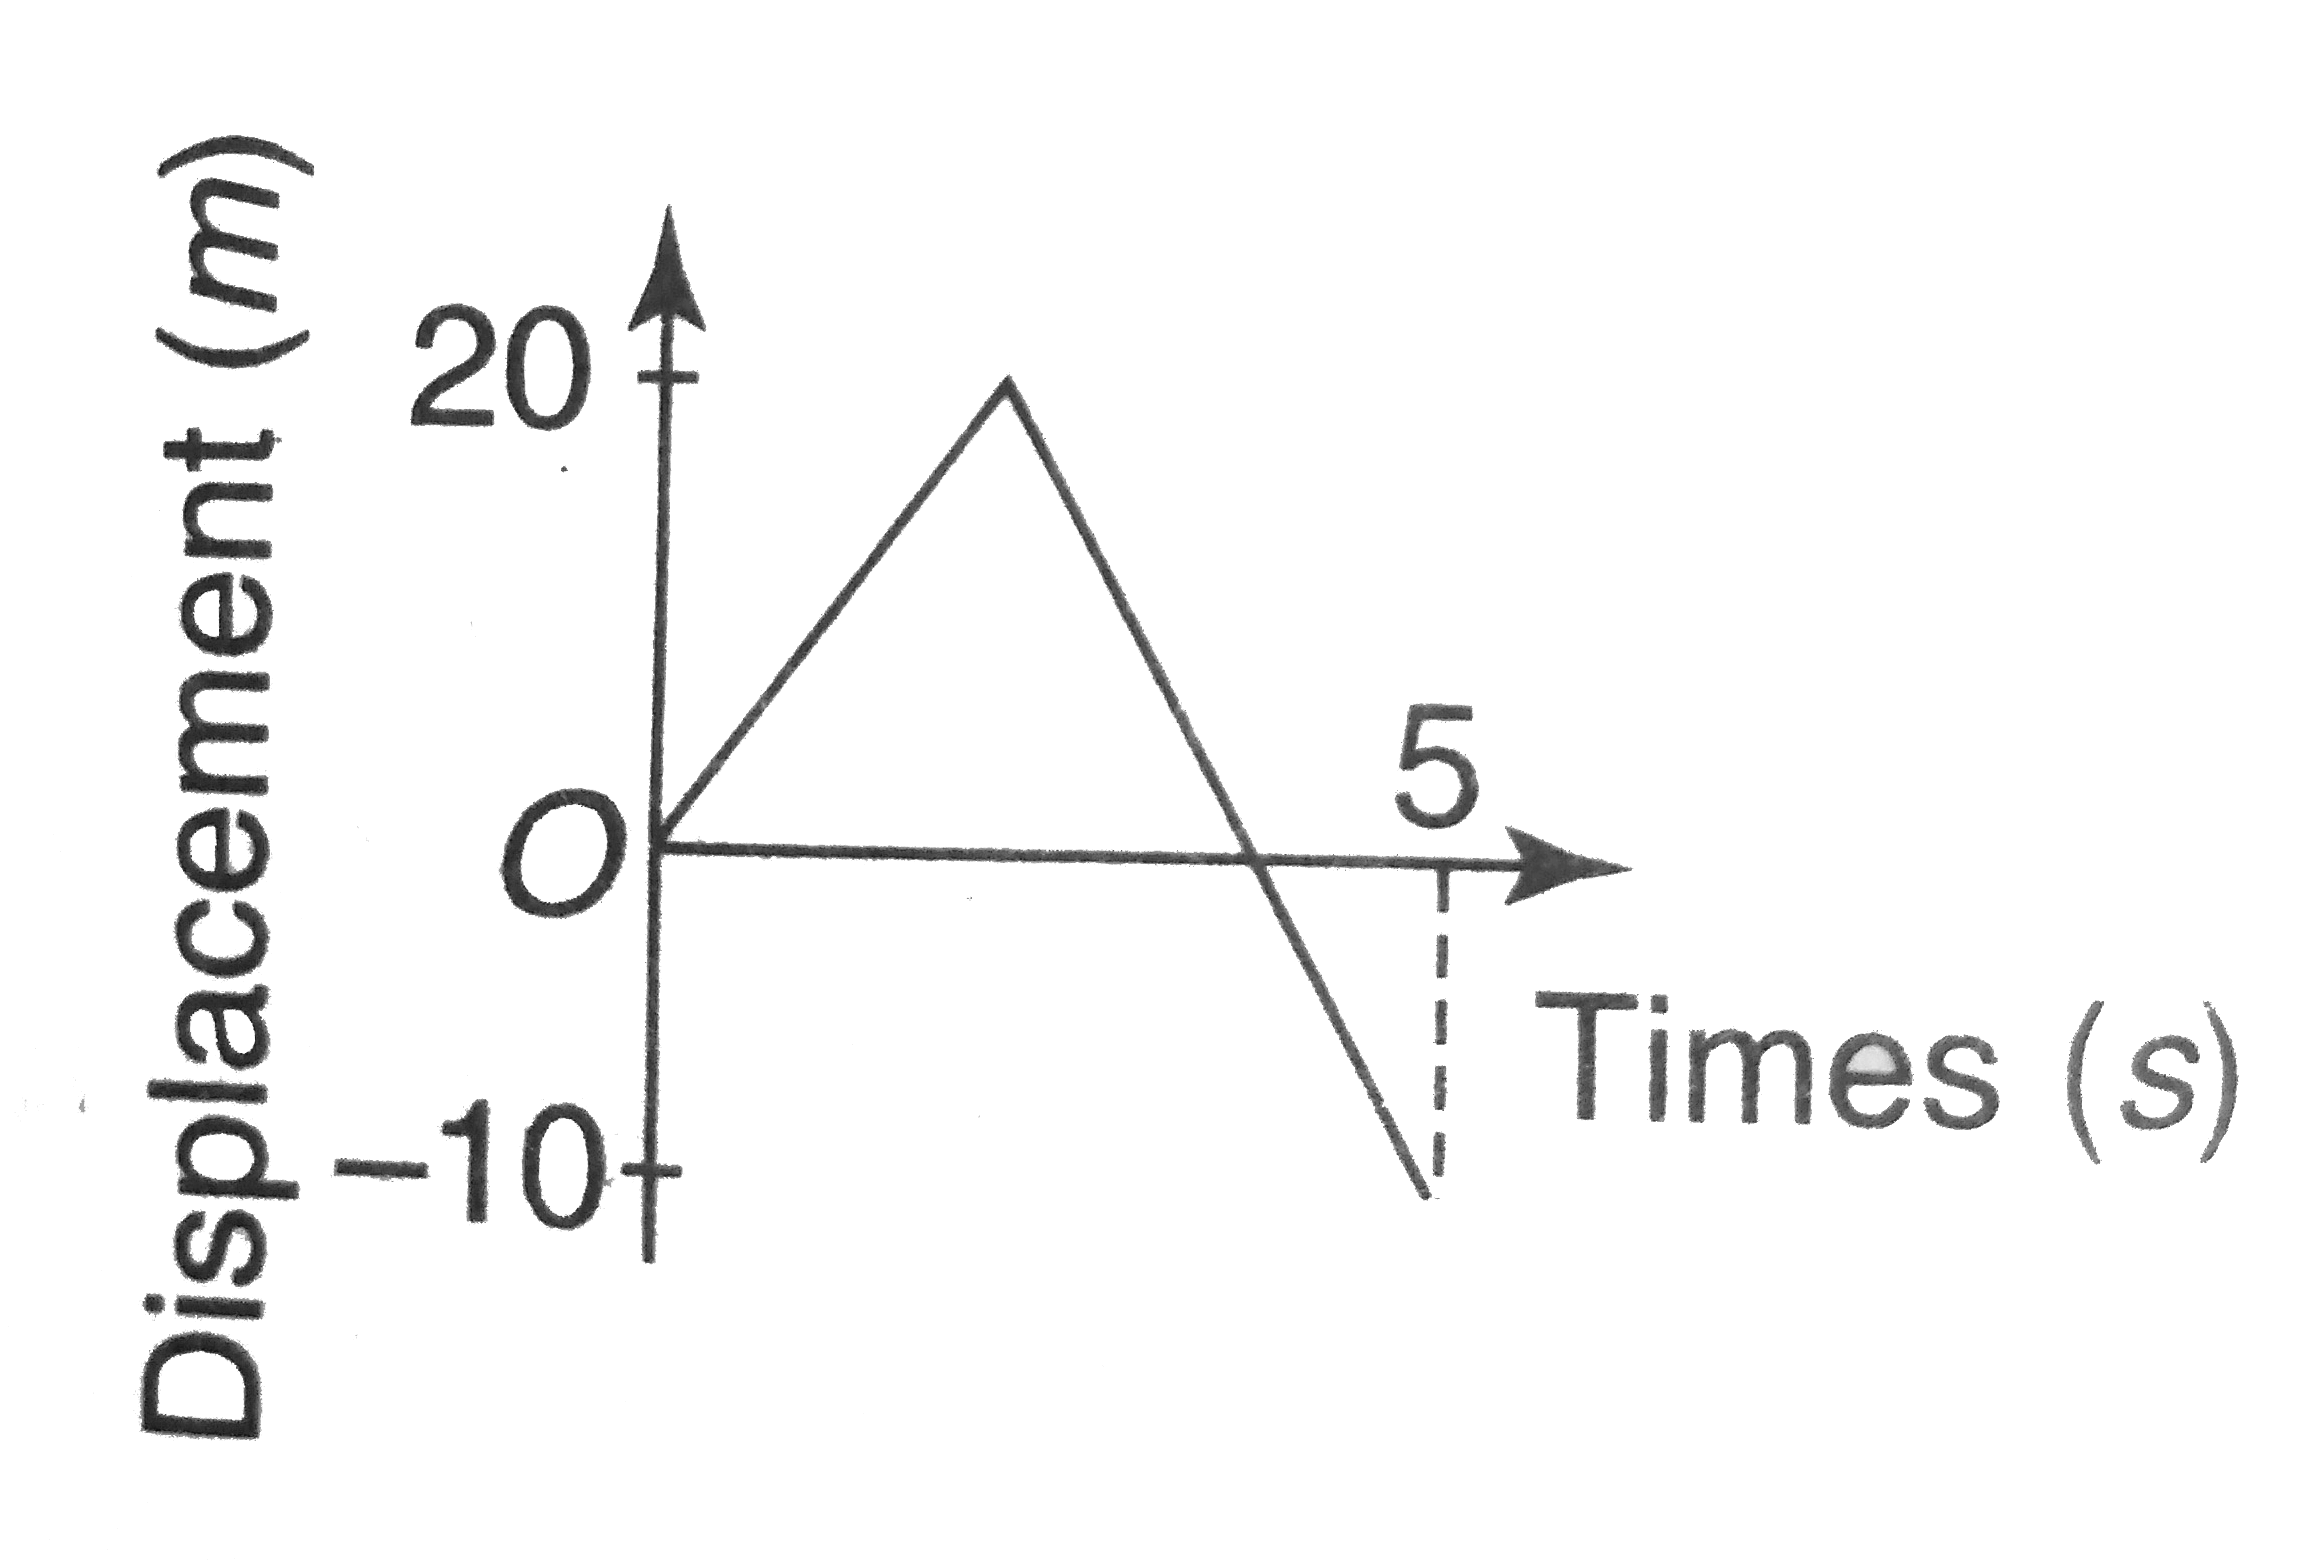 A−2ms−1B2ms−1C−4ms−1D4ms−1
The diagram shows the displacement-time graph for a particle moving in a straight line. Find the average velocity for the interval from t=0 to t=5s.
 A−2ms−1B2ms−1C−4ms−1D4ms−1
The velocity and time graph for a particle moving in a straight line s shown in the figure. Then, the average velocity between t=4 s and t=6 s is _____
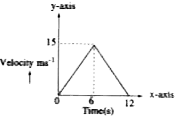
View SolutionThe x-t graph of a particle undergoing simple harmonic motion is shown below. The acceleration of the particle at t=23s is
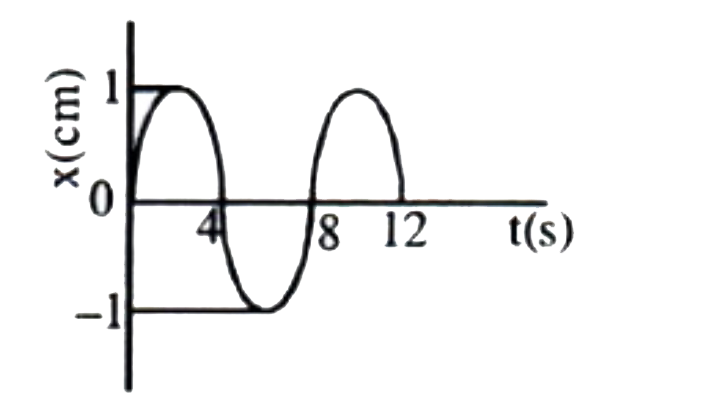
View SolutionThe x-t graph of a particle undergoing simple harmonic motion is shown below. The acceleration of the particle at t=23s is

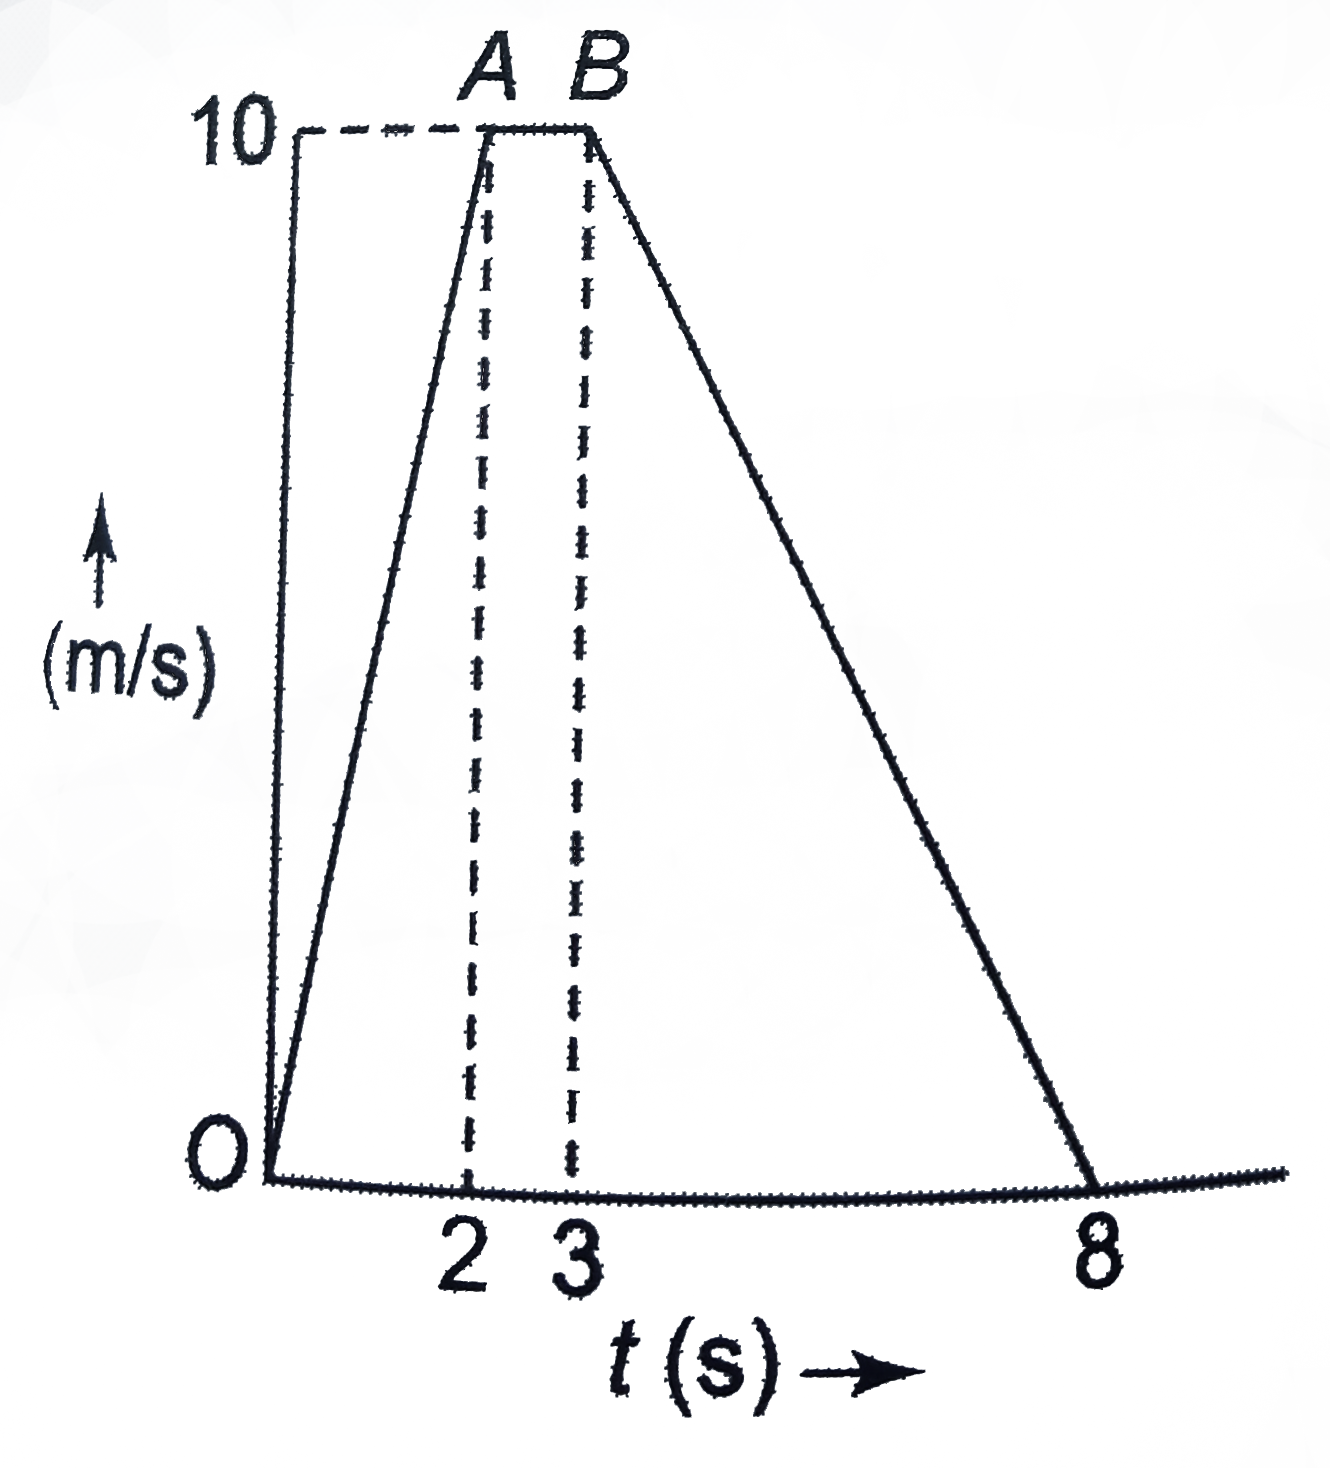
View SolutionFor a particle moving in a straight line, the velocity-time graph is as shown in the figure. Find the acceleration at time t=1s2.5s and 5s. Sketch the acceleration time graph.
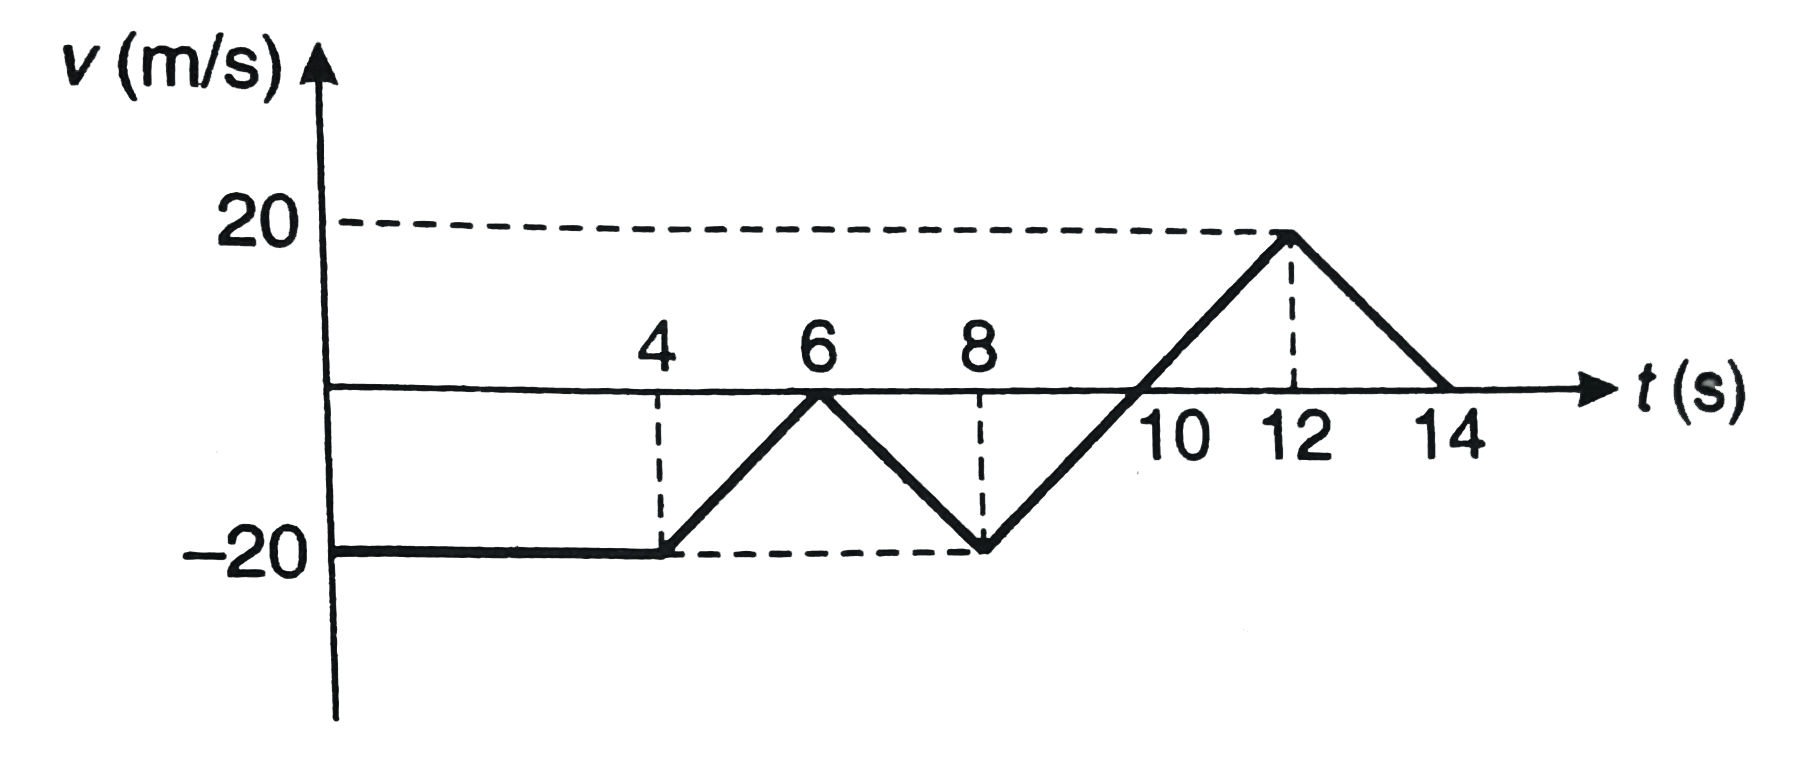
View SolutionVelocity-time graph of a particle moving in a straight line is shown in figure. At time t=0.s=20m. Plot a-t and s-t graphs of the particle.
View Solution
