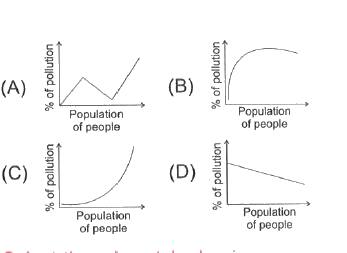
Which of the following graphs shows the likely relationship between the percentage of pollution to the population of people in a particular town?
Video Solution
Text Solution
The correct Answer is:C
As the population of people increases, pollution will also increase.
|
Topper's Solved these Questions
- POLLUTION OF AIR AND WATER BOOK - SCIENCE OLYMPIAD FOUNDATION CHAPTER - POLLUTION OF AIR AND WATER EXERCISE - ACHIEVERS SECTION (HOTS)
5 Videos
- NSO QUESTION PAPER 2020-21 SET ABOOK - SCIENCE OLYMPIAD FOUNDATION CHAPTER - NSO QUESTION PAPER 2020-21 SET AEXERCISE - SCIENCE
14 Videos
- REPRODUCTION AND ENDOCRINE SYSTEMBOOK - SCIENCE OLYMPIAD FOUNDATION CHAPTER - REPRODUCTION AND ENDOCRINE SYSTEMEXERCISE - ACHIEVERS SECTION (HOTS)
4 Videos
Similar Questions
Knowledge Check
Which of the following graphs shows the relationship between the rate of an enzymatic activity and substrate concentration (S) ?
A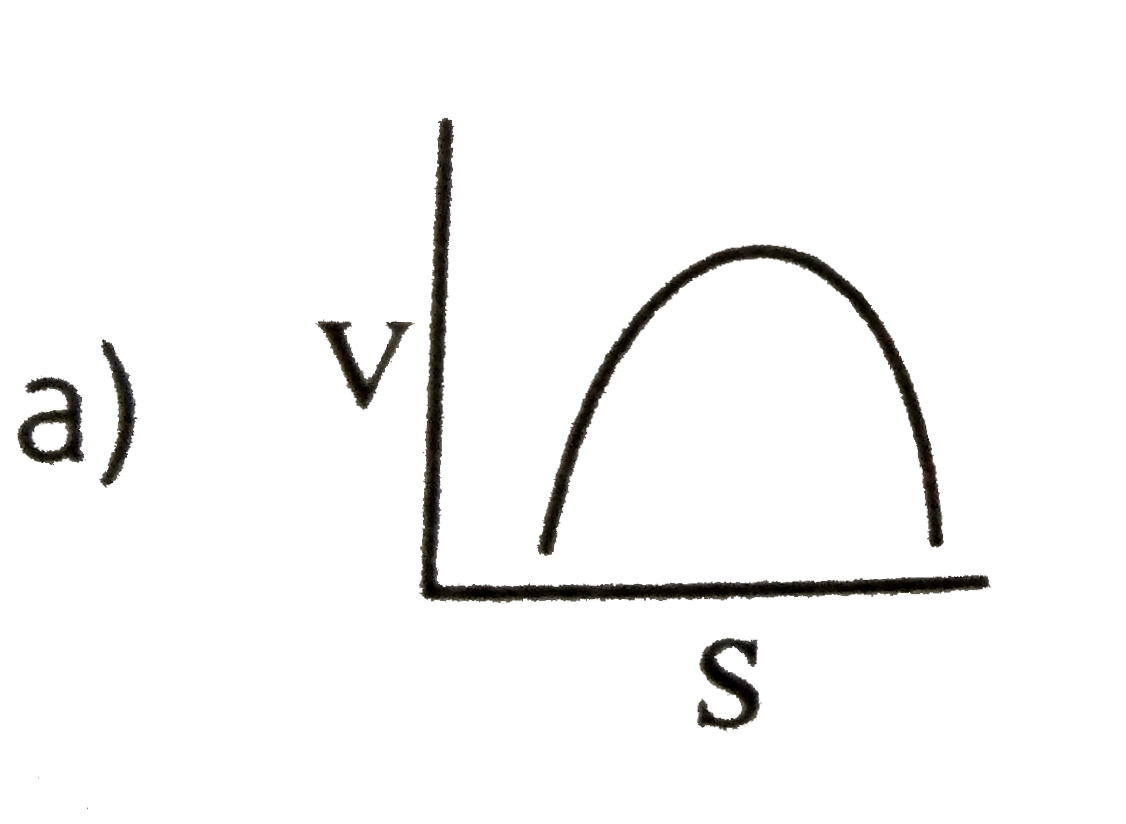 B
B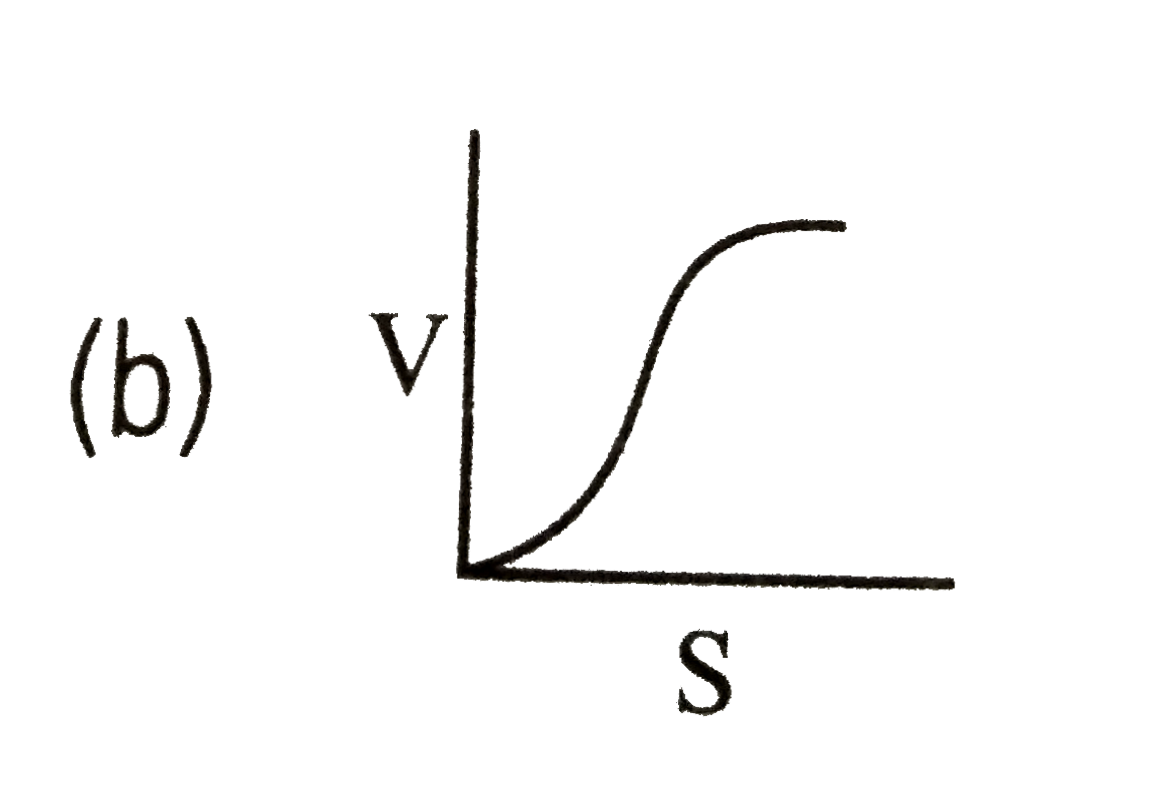 C
C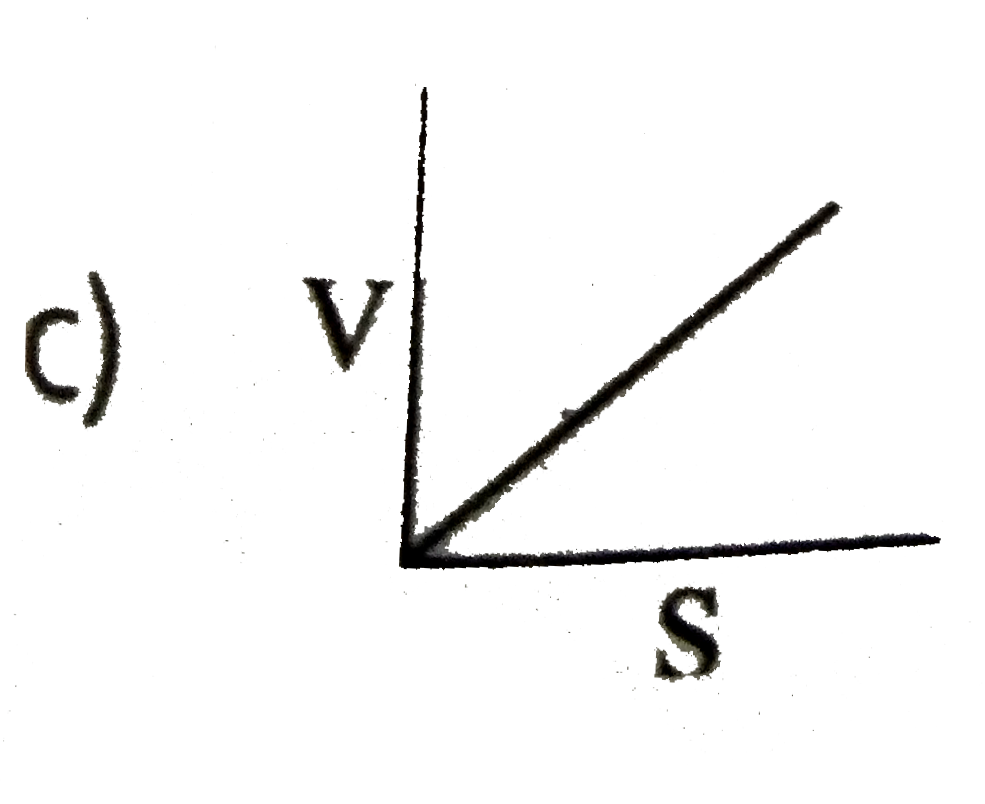 D
D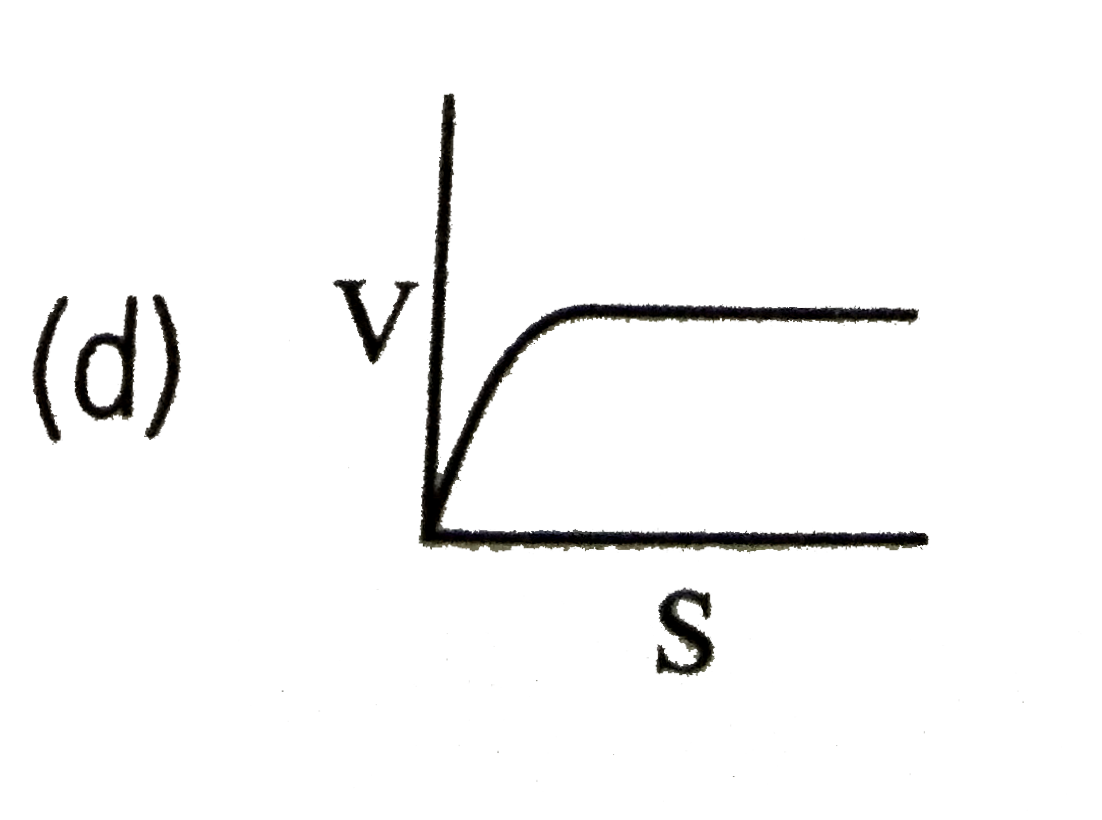
Which one of the following graphs show the relationship between the rate of an enzymatic activity and substrate conc(S) -
A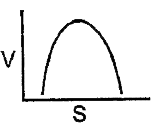 B
B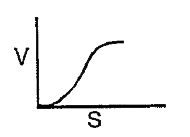 C
C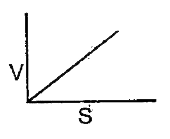 D
D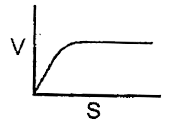
Which of the following graphs shows the relationship between the rate of an enzymatic activity and substrate concentration (S) ?
A B
B C
C D
D
Of the following graphs , the one which shows the relationship between the resistance R of multirange moving coil ammeter and its range I is
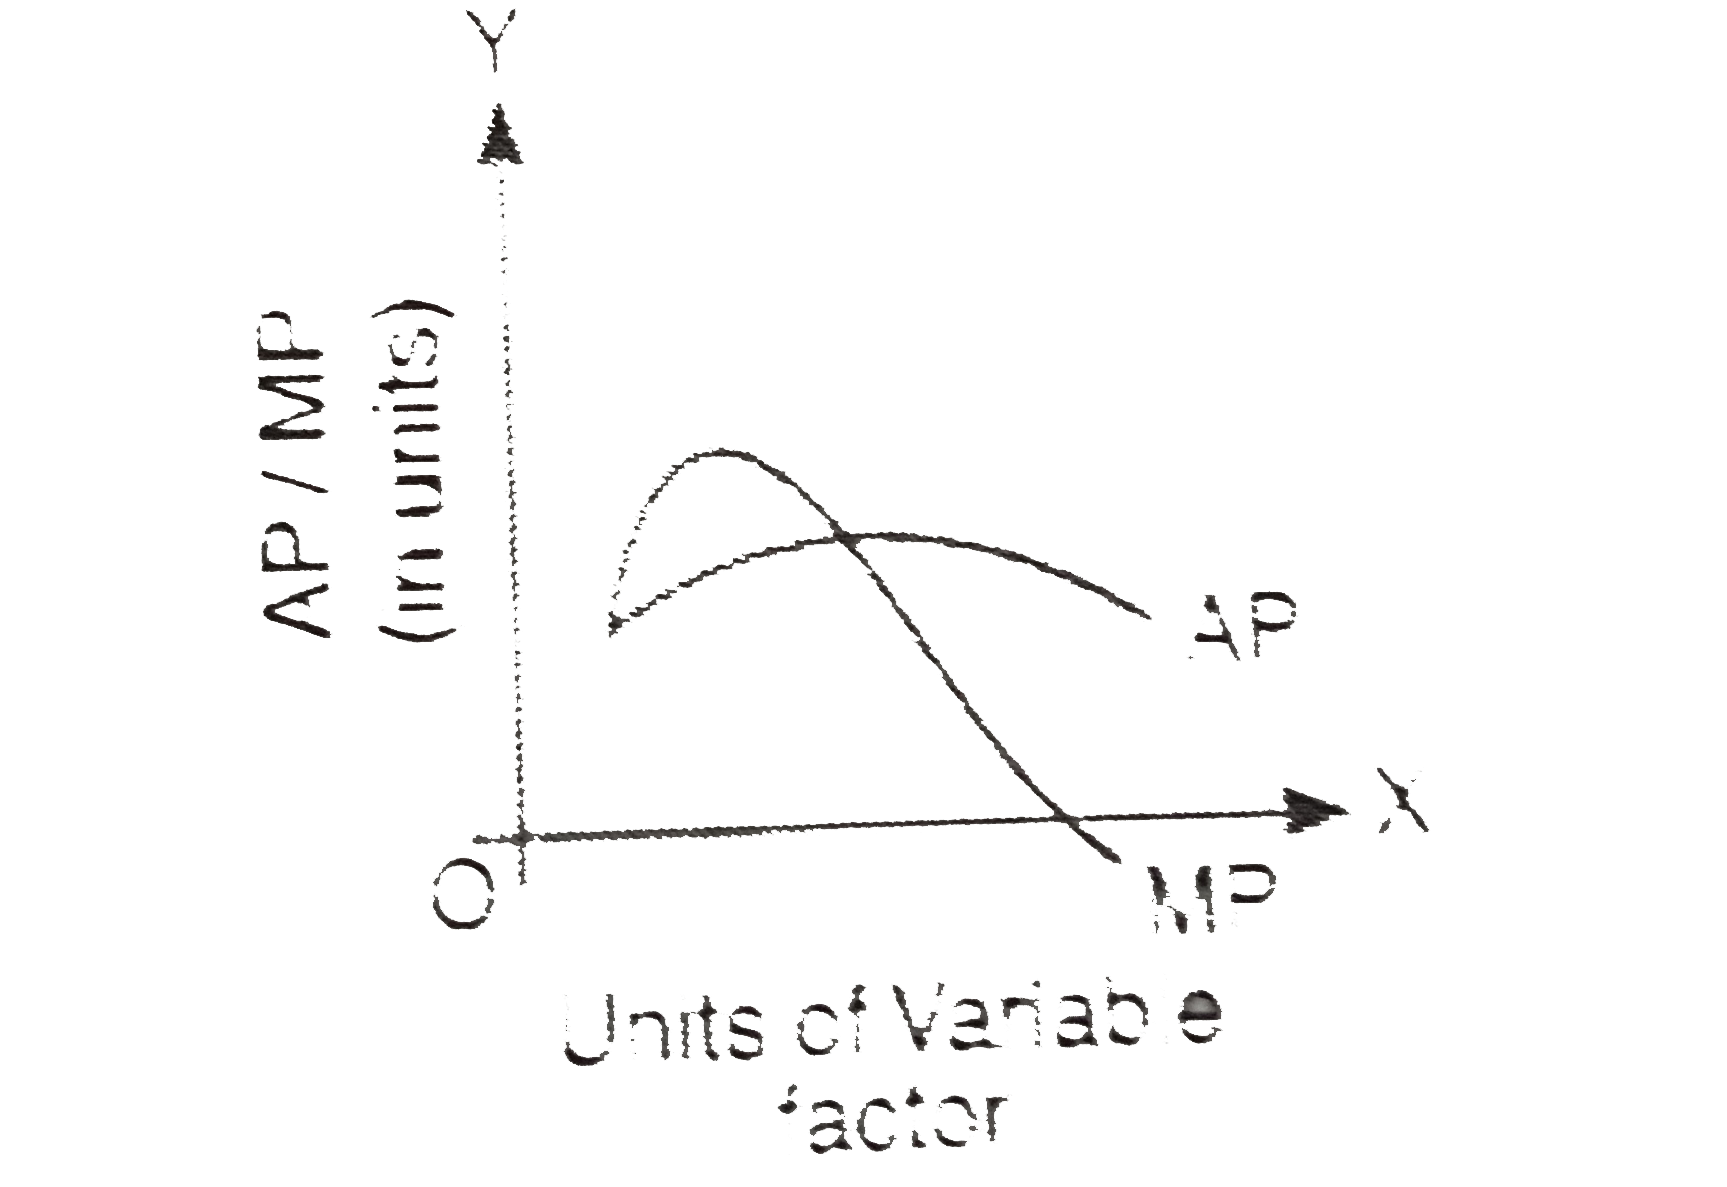
View SolutionWhich of the following is correct statement showing showing the relationship between AP and MP ?
View SolutionWhich of the following will not control particular pollutants
View SolutionThe bar graph shows the number of males and females (in crores) in india during 1951-1991. Read the graph and answer the following questions
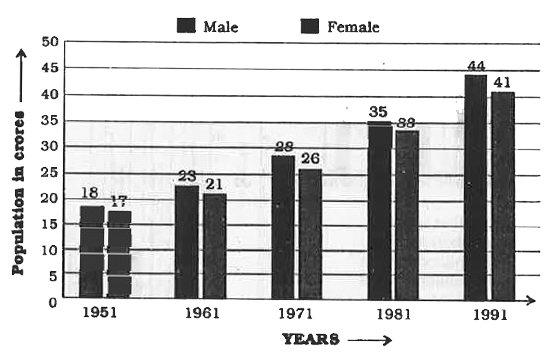
What was the approximate percentage of female population of female population in India during 1991 ?
View SolutionWhich of the graphs shown in the figure below best represents the relationship between the radioactive decay rare [−(dN/dt)] and population N?
View Solution

