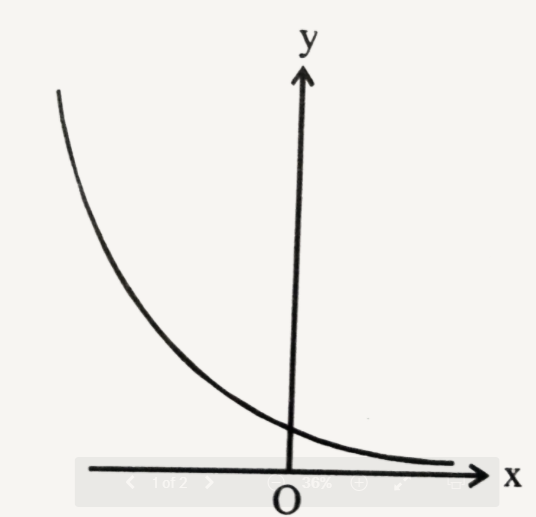
Use the following population graph to show which numbers indicate the following conditions.
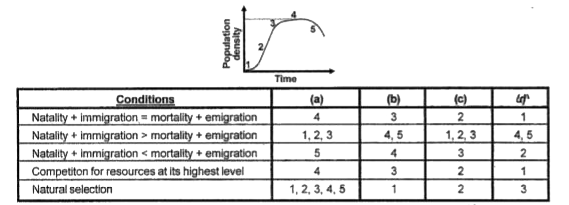
The correct Answer is:A
Similar Questions
Knowledge Check
The following graph shows the speed ofabody which is :
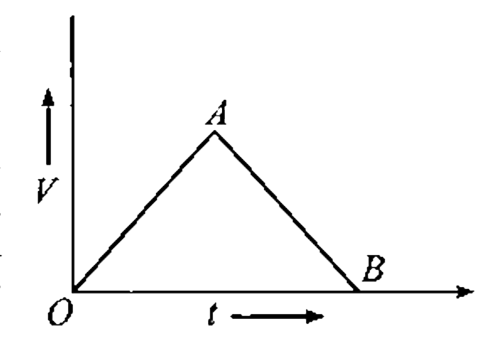 AProjected upwards with some velocity in vertical planeBHaving only constant accelerated motionCHaving only the constant retardationDA perfectly elastic ball falling from a height on a fnction less and hard floor
The bar graph shows the population of different countries. Study the diagram and answer the following questions.
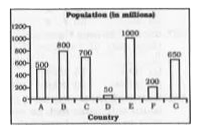
Which country has the second highest population?ABBDCEDA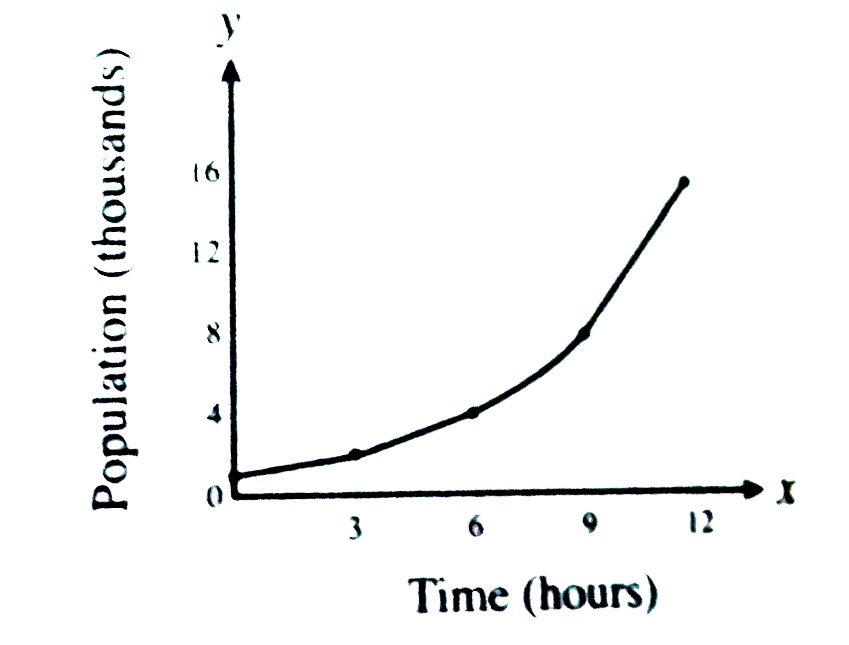
The graph above shows the size of a certain population after time t. Which of the following equations correctly shows y as a function of t ?Ay=t3By=1.000−2t3Cy=3t2Dy=1,000t-2,000
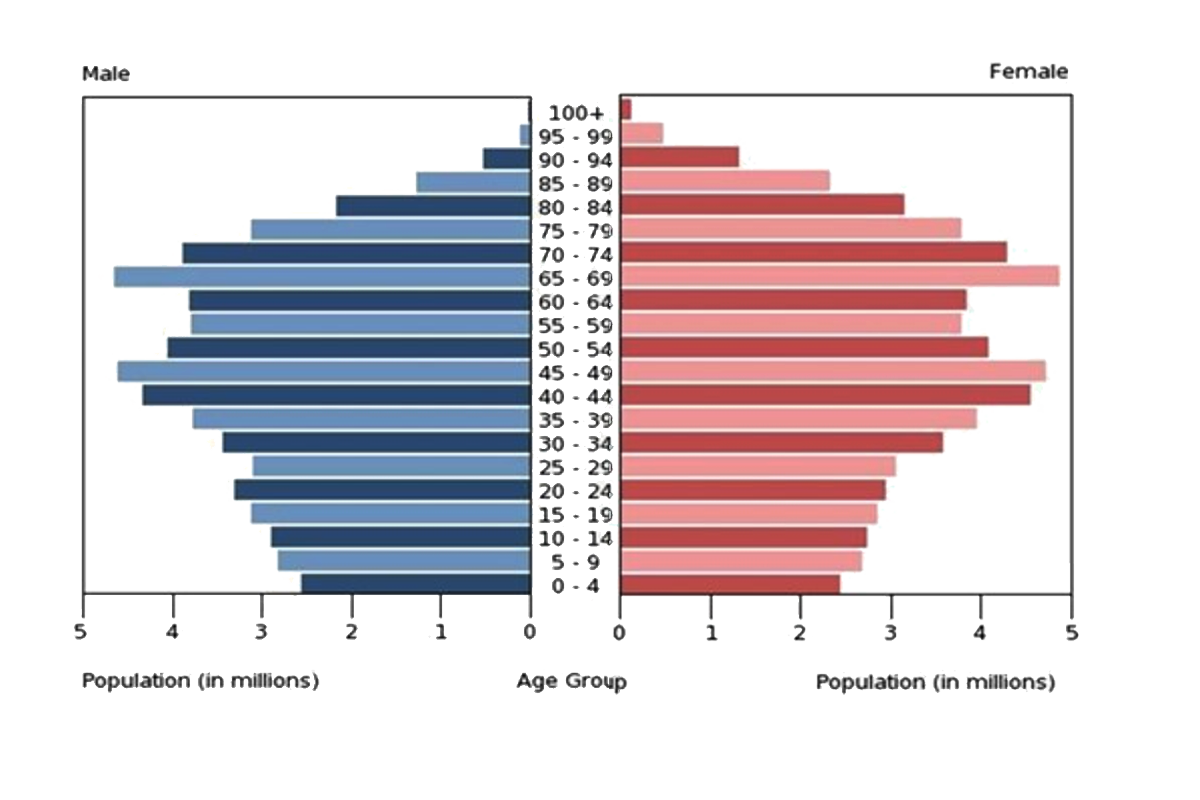
Observe the following agewise population graph of a country in 2018 . The population in this country is
View SolutionConsider the following population and year graph, find the slope of the line AB and using it, find what will be the population in the year 2010?
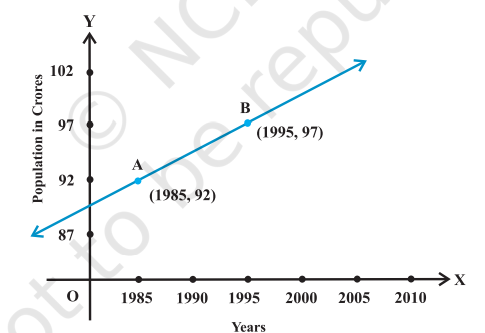
View SolutionConsider the following population and year graph: find the slope of the line AB and using it find what will be the population in the year 2010.
View SolutionConsider the following population and year graph: find the slope of the line AB and using it find what will be the population in the year 2010.
View SolutionDirection: Read the following Bar graph carefully and answer the following questions: The following bar graph shows the number of visitors to the Taj Mahal in the first week of January.
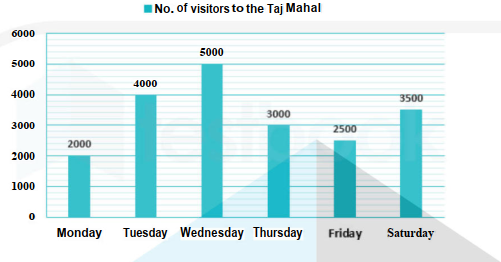
Find on which day the number of vistiros to the Taj Mahal is the highest?
View Solution

