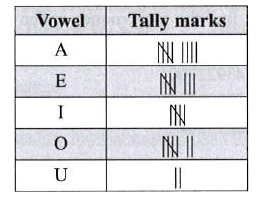
Jenny made the following frequency table to show the number of times each vowel was used in the titles of several books she had read. Which of the following lists shows the vowels in order of the most used to the least used ?

U,I,E,O,A
E,I,A,O,U
A,E,O,I,U
A,E,I,O,U
The correct Answer is:C
Step by step video, text & image solution for Jenny made the following frequency table to show the number of times each vowel was used in the titles of several books she had read. Which of the following lists shows the vowels in order of the most used to the least used ? by Maths experts to help you in doubts & scoring excellent marks in Class 6 exams.
Topper's Solved these Questions
- BOOK - SCIENCE OLYMPIAD FOUNDATION CHAPTER - IMO MODEL TEST PAPER 2EXERCISE - EVERYDAY MATHEMATICS10videos
IMO MODEL TEST PAPER 2
- BOOK - SCIENCE OLYMPIAD FOUNDATION CHAPTER - IMO MODEL TEST PAPER 1 EXERCISE - ACHIEVERS SECTION5videos
IMO MODEL TEST PAPER 1
- BOOK - SCIENCE OLYMPIAD FOUNDATION CHAPTER - IMO MODEL TEST PAPER 3EXERCISE - ACHIEVERS SECTION5videos
IMO MODEL TEST PAPER 3
Similar Questions
Knowledge Check
- Question 1 - Select One
Which one among the following is used to make periscope?
A B
B C
C D
D
- Question 2 - Select One
For which of the following would you use a histogram to show the data?
AThe number of letters for different areas in a postman's bagBThe height of competitors in an athletics meetCThe number of cassettes produced by 5 companiesDThe number of passengers boarding trains from 7:00 am to 7:00 pm at a station - Question 3 - Select One
To show land use in different countries of the world, which of the following would be a suitable teaching aid?
AFlowchartBComparative chartCTimeline chartDVenn diagram
Let us now consider the following frequency distribution table which gives the weights of 38 students of a class:
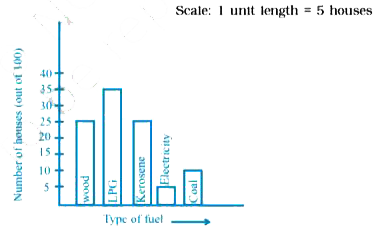
View SolutionThe following bar graph shows the number of houses (out of 100) in a town using different types of fuels for cooking.
Read the bar graph and answer the following questions:

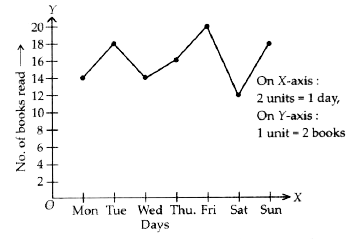
Suppose that the total number of houses in the town is 1 lakh. From the above graph estimate the number of houses using electricity.View SolutionThe following graph shows the number of books read by Ashok in a week.
On which day Ashok read the maximum number of books?
 View Solution
To show land use in different countries of the world, which of the following would be a suitable teaching aid?
View SolutionWhich of the following is useful to find from the cumulative frequencies in a grouped frequency table?
View Solution


