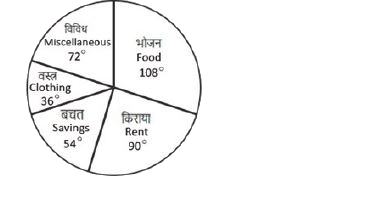
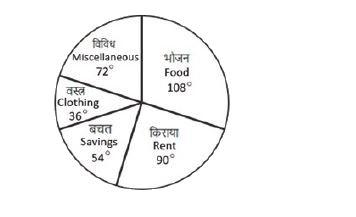
The given pie chart shows the monthly expenditure of a family on rent, clothing, food, savings and miscellaneous items. The family spends Rs 520 on miscellaneous items. Miscellaneous items
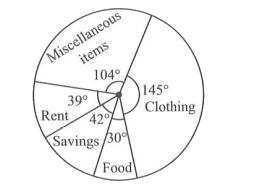
How much more does the family spend on clothing than on savings?
Rs 752
Rs 515
Rs 650
Rs 725
The correct Answer is:B
Step by step video, text & image solution for The given pie chart shows the monthly expenditure of a family on rent, clothing, food, savings and miscellaneous items. The family spends Rs 520 on miscellaneous items. Miscellaneous items How much more does the family spend on clothing than on savings? by Maths experts to help you in doubts & scoring excellent marks in Class 8 exams.
Topper's Solved these Questions
- BOOK - SCIENCE OLYMPIAD FOUNDATION CHAPTER - IMO QUESTION PAPER 2018-19 SET- AEXERCISE - Everyday Mathematics10videos
IMO QUESTION PAPER 2018-19 SET- A
- BOOK - SCIENCE OLYMPIAD FOUNDATION CHAPTER - IMO QUESTION PAPER 2018-19 SET- AEXERCISE - Achievers Section5videos
IMO QUESTION PAPER 2018-19 SET- A
- BOOK - SCIENCE OLYMPIAD FOUNDATION CHAPTER - IMO QUESTION PAPER 2018-19 SET -B EXERCISE - ACHIEVERS SECTION5videos
IMO QUESTION PAPER 2018-19 SET -B
- BOOK - SCIENCE OLYMPIAD FOUNDATION CHAPTER - IMO QUESTION PAPER 2019-20 SET AEXERCISE - Achievers Section5videos
IMO QUESTION PAPER 2019-20 SET A
Similar Questions
Knowledge Check
- Question 1 - Select One
The following pie - chart shows the monthly expenditure of a family on food, clothing, rent, miscellaneous expenses and savings. What is the central angle for savings ?
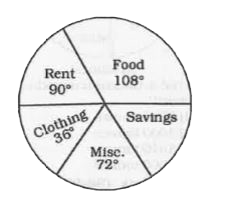 A54∘B56∘C50∘D52∘
 - Question 2 - Select One
The following pie-chart shows the monthly expenditure of a family on various items. If the family spends Rs. 825 on clothing, answer the question
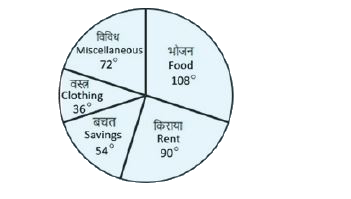
What is the total monthly income of the family?ARs. 8025BRs. 8250CRs. 8520DRs. 8052 - Question 3 - Select One
The following pie-chart shows the monthly expenditure of a family on various items. If the family spends Rs. 825 on clothing, answer the question
What percent of the total income does the family save ?A0.15B0.5C0.2D0.25
The following pie-chart shows the monthly expenditure of a family on food, house rent clothing, education, fuel and miscellaneous Study the pie-chart
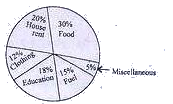
If the percentage of expenditure on food is x % of the total percentage of expenditure on clothing, education and fuel, then x equalsView SolutionThe following pie-chart shows the monthly expenditure of a family on food, house rent clothing, education, fuel and miscellaneous Study the pie-chart
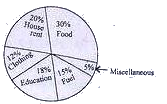
If the expenditure for food is 9000, then the expenditure for education isView SolutionThe following pie-chart shows the monthly expenditure of a family on food, house rent clothing, education, fuel and miscellaneous Study the pie-chart
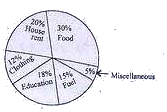
The central angle of the sector for the expenditure on fuel (in degrees) isView SolutionThe following pie-chart shows the monthly expenditure of a man on various items. If he spends Rs. 16,000 per month, answer the following questions.
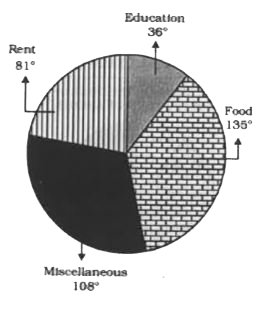
If miscellaneous expenses be x% of the total expense, then value of x is:View SolutionThe following pie-chart shows the monthly expenditure of a family on various items. If the family spends Rs. 825 on clothing, answer the question
What is the average of expenses on clothing and rent?View Solution


