Study the given histogram representing the weights of students of class VIII and answer the following questions.
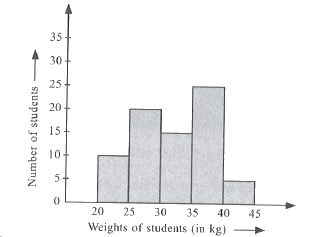
(i) How many students weights at least 30 kg but less than 45 kg?
(ii) Which class interval has the highest frequency?
i ii35 20−25
i ii35 35−40
i ii40 25−30
i ii45 35−40
The correct Answer is:D
Step by step video, text & image solution for Study the given histogram representing the weights of students of class VIII and answer the following questions. (i) How many students weights at least 30 kg but less than 45 kg? (ii) Which class interval has the highest frequency? by Maths experts to help you in doubts & scoring excellent marks in Class 8 exams.
Topper's Solved these Questions
- BOOK - SCIENCE OLYMPIAD FOUNDATION CHAPTER - IMO QUESTION PAPER 2018-19 SET -B EXERCISE - EVERYDAY MATHEMATICS10videos
IMO QUESTION PAPER 2018-19 SET -B
- BOOK - SCIENCE OLYMPIAD FOUNDATION CHAPTER - IMO QUESTION PAPER 2017-18 SET-BEXERCISE - ACHIEVERS SECTION5videos
IMO QUESTION PAPER 2017-18 SET-B
- BOOK - SCIENCE OLYMPIAD FOUNDATION CHAPTER - IMO QUESTION PAPER 2018-19 SET- AEXERCISE - Achievers Section5videos
IMO QUESTION PAPER 2018-19 SET- A
Similar Questions
The given pictograph represents the number of students in 5 sections of class VI.
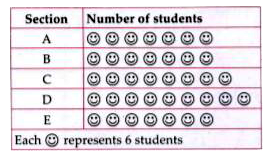
Study the given pictograph and answer the following questions.
How may students are there in section E ?View SolutionThe given pictograph represents the number of students in 5 sections of class VI.
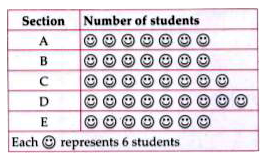
Study the given pictograph and answer the following questions.
How many less students are there in section E than section D ?View Solution
Knowledge Check
- Question 1 - Select One
Study the histogram of marks (in Mathematics) distribution of 50 students of class IX and answer the following questions.
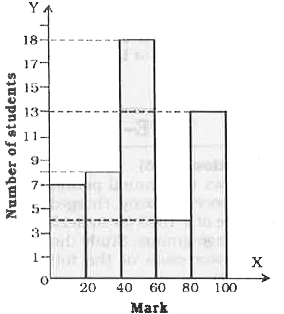
The number of students who have secured marks less than 60 is :A12B15C33D7 - Question 2 - Select One
Study the histogram of marks (in Mathematics) distribution of 50 students of class IX and answer the following questions.
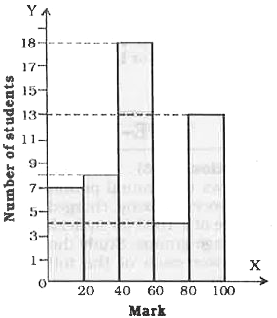
The average marks of the students areA53.2B45.5C60.2D55.5 - Question 3 - Select One
Study the following histogram of marks in mathematics (out of 50) of students in a class and answer the following questions.
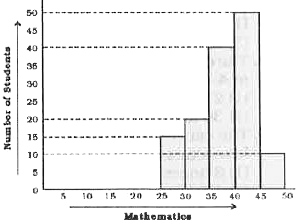
The total number of students in the class is :A120B125C130D1.35
The given pictograph represents the number of students in 5 sections of class VI.
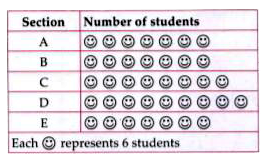
Study the given pictograph and answer the following questions.
Which section has 48 students ?View SolutionStudy the histogram of marks (in Mathematics) distribution of 50 students of class IX and answer the following questions.
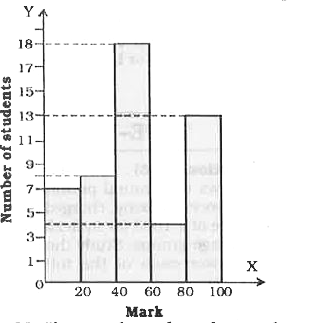
The number of students who have scored between 39 and 80 is :View SolutionStudy the histogram of marks (in Mathematics) distribution of 50 students of class IX and answer the following questions.
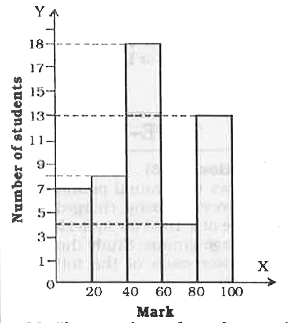
The percentage of students who have secured marks more than 59 is :View SolutionThe histogram shows the marks obtained by 45 students of a class. Look at the histogram and answer the questions.
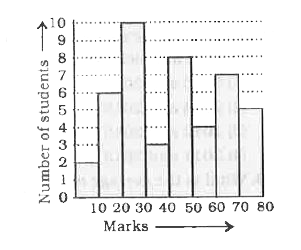
How many students have obtained marks less than 10 ?View SolutionThe histogram shows the marks obtained by 45 students of a class. Look at the histogram and answer the questions.
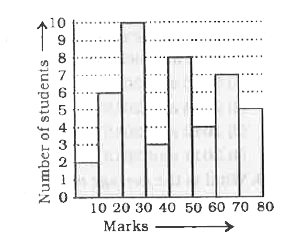
How many students have obtained 30 or more marks but less than 40 ?View Solution

