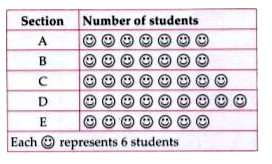
The given pictograph represents the number of students in 5 sections of class VI.
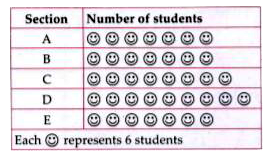
Study the given pictograph and answer the following questions.
How may students are there in section E ?
The correct Answer is:42
Step by step video & image solution for The given pictograph represents the number of students in 5 sections of class VI. Study the given pictograph and answer the following questions. How may students are there in section E ? by Maths experts to help you in doubts & scoring excellent marks in Class 6 exams.
Updated on:21/07/2023Topper's Solved these Questions
- DATA HANDLING BOOK - MTG IIT JEE FOUNDATIONCHAPTER - DATA HANDLING EXERCISE - NCERT Section (Exercise 9.1)
22 Videos
- DATA HANDLING BOOK - MTG IIT JEE FOUNDATIONCHAPTER - DATA HANDLING EXERCISE - NCERT Section (Exercise 9.2)
5 Videos
- DATA HANDLING BOOK - MTG IIT JEE FOUNDATIONCHAPTER - DATA HANDLING EXERCISE - Olympiad/HOTS Corner
10 Videos
- BASIC GEOMETRICAL IDEASBOOK - MTG IIT JEE FOUNDATIONCHAPTER - BASIC GEOMETRICAL IDEASEXERCISE - OLYMPIAD/HOTS CORNER
10 Videos
- DECIMALSBOOK - MTG IIT JEE FOUNDATIONCHAPTER - DECIMALSEXERCISE - OLYMPIAD/HOTS CORNER
20 Videos
Similar Questions
The given pictograph represents the number of students in 5 sections of class VI.
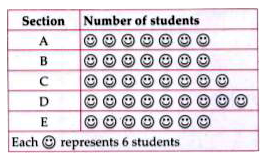
Study the given pictograph and answer the following questions.
How many less students are there in section E than section D ?
View SolutionThe given pictograph represents the number of students in 5 sections of class VI.
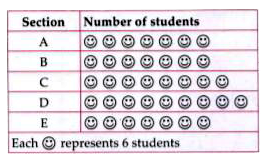
Study the given pictograph and answer the following questions.
Which section has 48 students ?
View SolutionThe given pictograph represents the number of students in 5 sections of class VI.
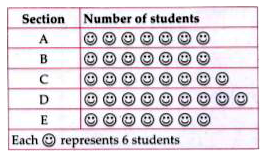
Study the given pictograph and answer the following questions.
Find the total number of students in 5 sections of Class VI.
View SolutionThe given pictograph represents the number of students in 5 sections of class VI.
Study the given pictograph and answer the following questions.
Find the difference between the number of students in section E and the total number of students in section C and D together.
View SolutionDraw a pictograph for representing the number of students in each class based on the given data.

View SolutionThe number of scouts in a school is depicted by the following pictograph:
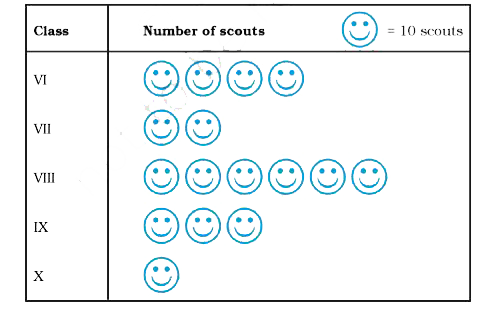
Observe the pictograph and answer the following questions:
How many scouts are there in Class VI?
View SolutionThe number of benches in each class of a school is depicted by the pictograph.
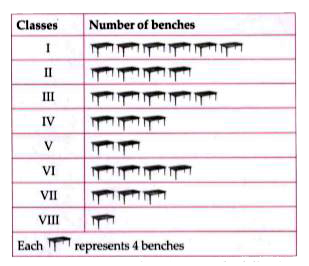
Observe the pictograph and answer the following questions.
How many benches are there in class VI ?
View SolutionA survey was carried out in a certain school to find about different modes of transport used by students to travel to school each day. 30 students of class VI were interviewed and the data obtained was displayed in the form of a pictographs given below: Mode of Transport, Number of Students Scooter, Figure Public Bus, Figure School Bus, Figure Cycle, Figure Walking, Figure Look at the above pictograph and answer the following questions: Look at the above pictograph and answer the following questions: How many students are using cycle or walking as a mode of travel? Which is most popular mode of travel?
View SolutionFollowing pictograph represents some surnames of people listed in the telephone directory of a city
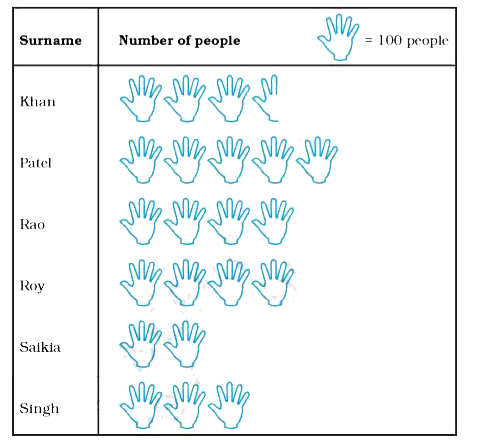
Observe the pictograph and answer the following questions:
How many people have surname ‘Roy’?
View SolutionFollowing pictograph shows the number of tractors in five villages.


Observe the pictograph and answer the following questions.
How many more tractors village C has a compared to village B ?
View Solution
