A force is applied to a cart moving along a horizontal track in the positive x direction. If the cart speeds up and then slows down, then which one of the following graphs best shows the variation of the force with time for the cart? Assume that friction is negligible.
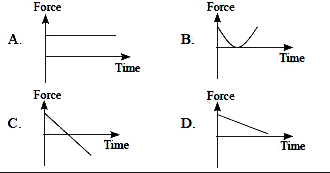
The correct Answer is:C
Step by step video, text & image solution for A force is applied to a cart moving along a horizontal track in the positive x direction. If the cart speeds up and then slows down, then which one of the following graphs best shows the variation of the force with time for the cart? Assume that friction is negligible. by Physics experts to help you in doubts & scoring excellent marks in Class 9 exams.
Topper's Solved these Questions
- BOOK - SCIENCE OLYMPIAD FOUNDATION CHAPTER - NSO QUESTION PAPER 2018 SET B EXERCISE - ACHIEVERS SECTION4videos
NSO QUESTION PAPER 2018 SET B
- BOOK - SCIENCE OLYMPIAD FOUNDATION CHAPTER - NSO QUESTION PAPER 2018 SET AEXERCISE - ACHIEVERS SECTION4videos
NSO QUESTION PAPER 2018 SET A
- BOOK - SCIENCE OLYMPIAD FOUNDATION CHAPTER - NSO QUESTION PAPER 2019 SET AEXERCISE - ACHIEVERS SECTION2videos
NSO QUESTION PAPER 2019 SET A
Similar Questions
A body is acted upon by a constant force fromtime t=0 to a time t=T after which it does not experience any force. Which of the following graphs best represents the variation of the velocity of the body with time ?
View SolutionA body starting from the the rest moves along a straight line with constant acceleration. Which one of the following graphs represents the variation of speed(v) and distance(s)?
View Solution
Knowledge Check
- Question 1 - Select One
A body starting from the rest moves along a straight line with constant acceleration .Which one of the following graphs represent the variation of speed (v) and distance (s) ?
A B
B C
C D
D
- Question 2 - Select One
The net force acting on a particle moving along a straight line varies with time as shown in the diagram. Force is parallel to velocity. Which of the following graph is best representative of its speed with time? (Initial velocity of the particle is zero)
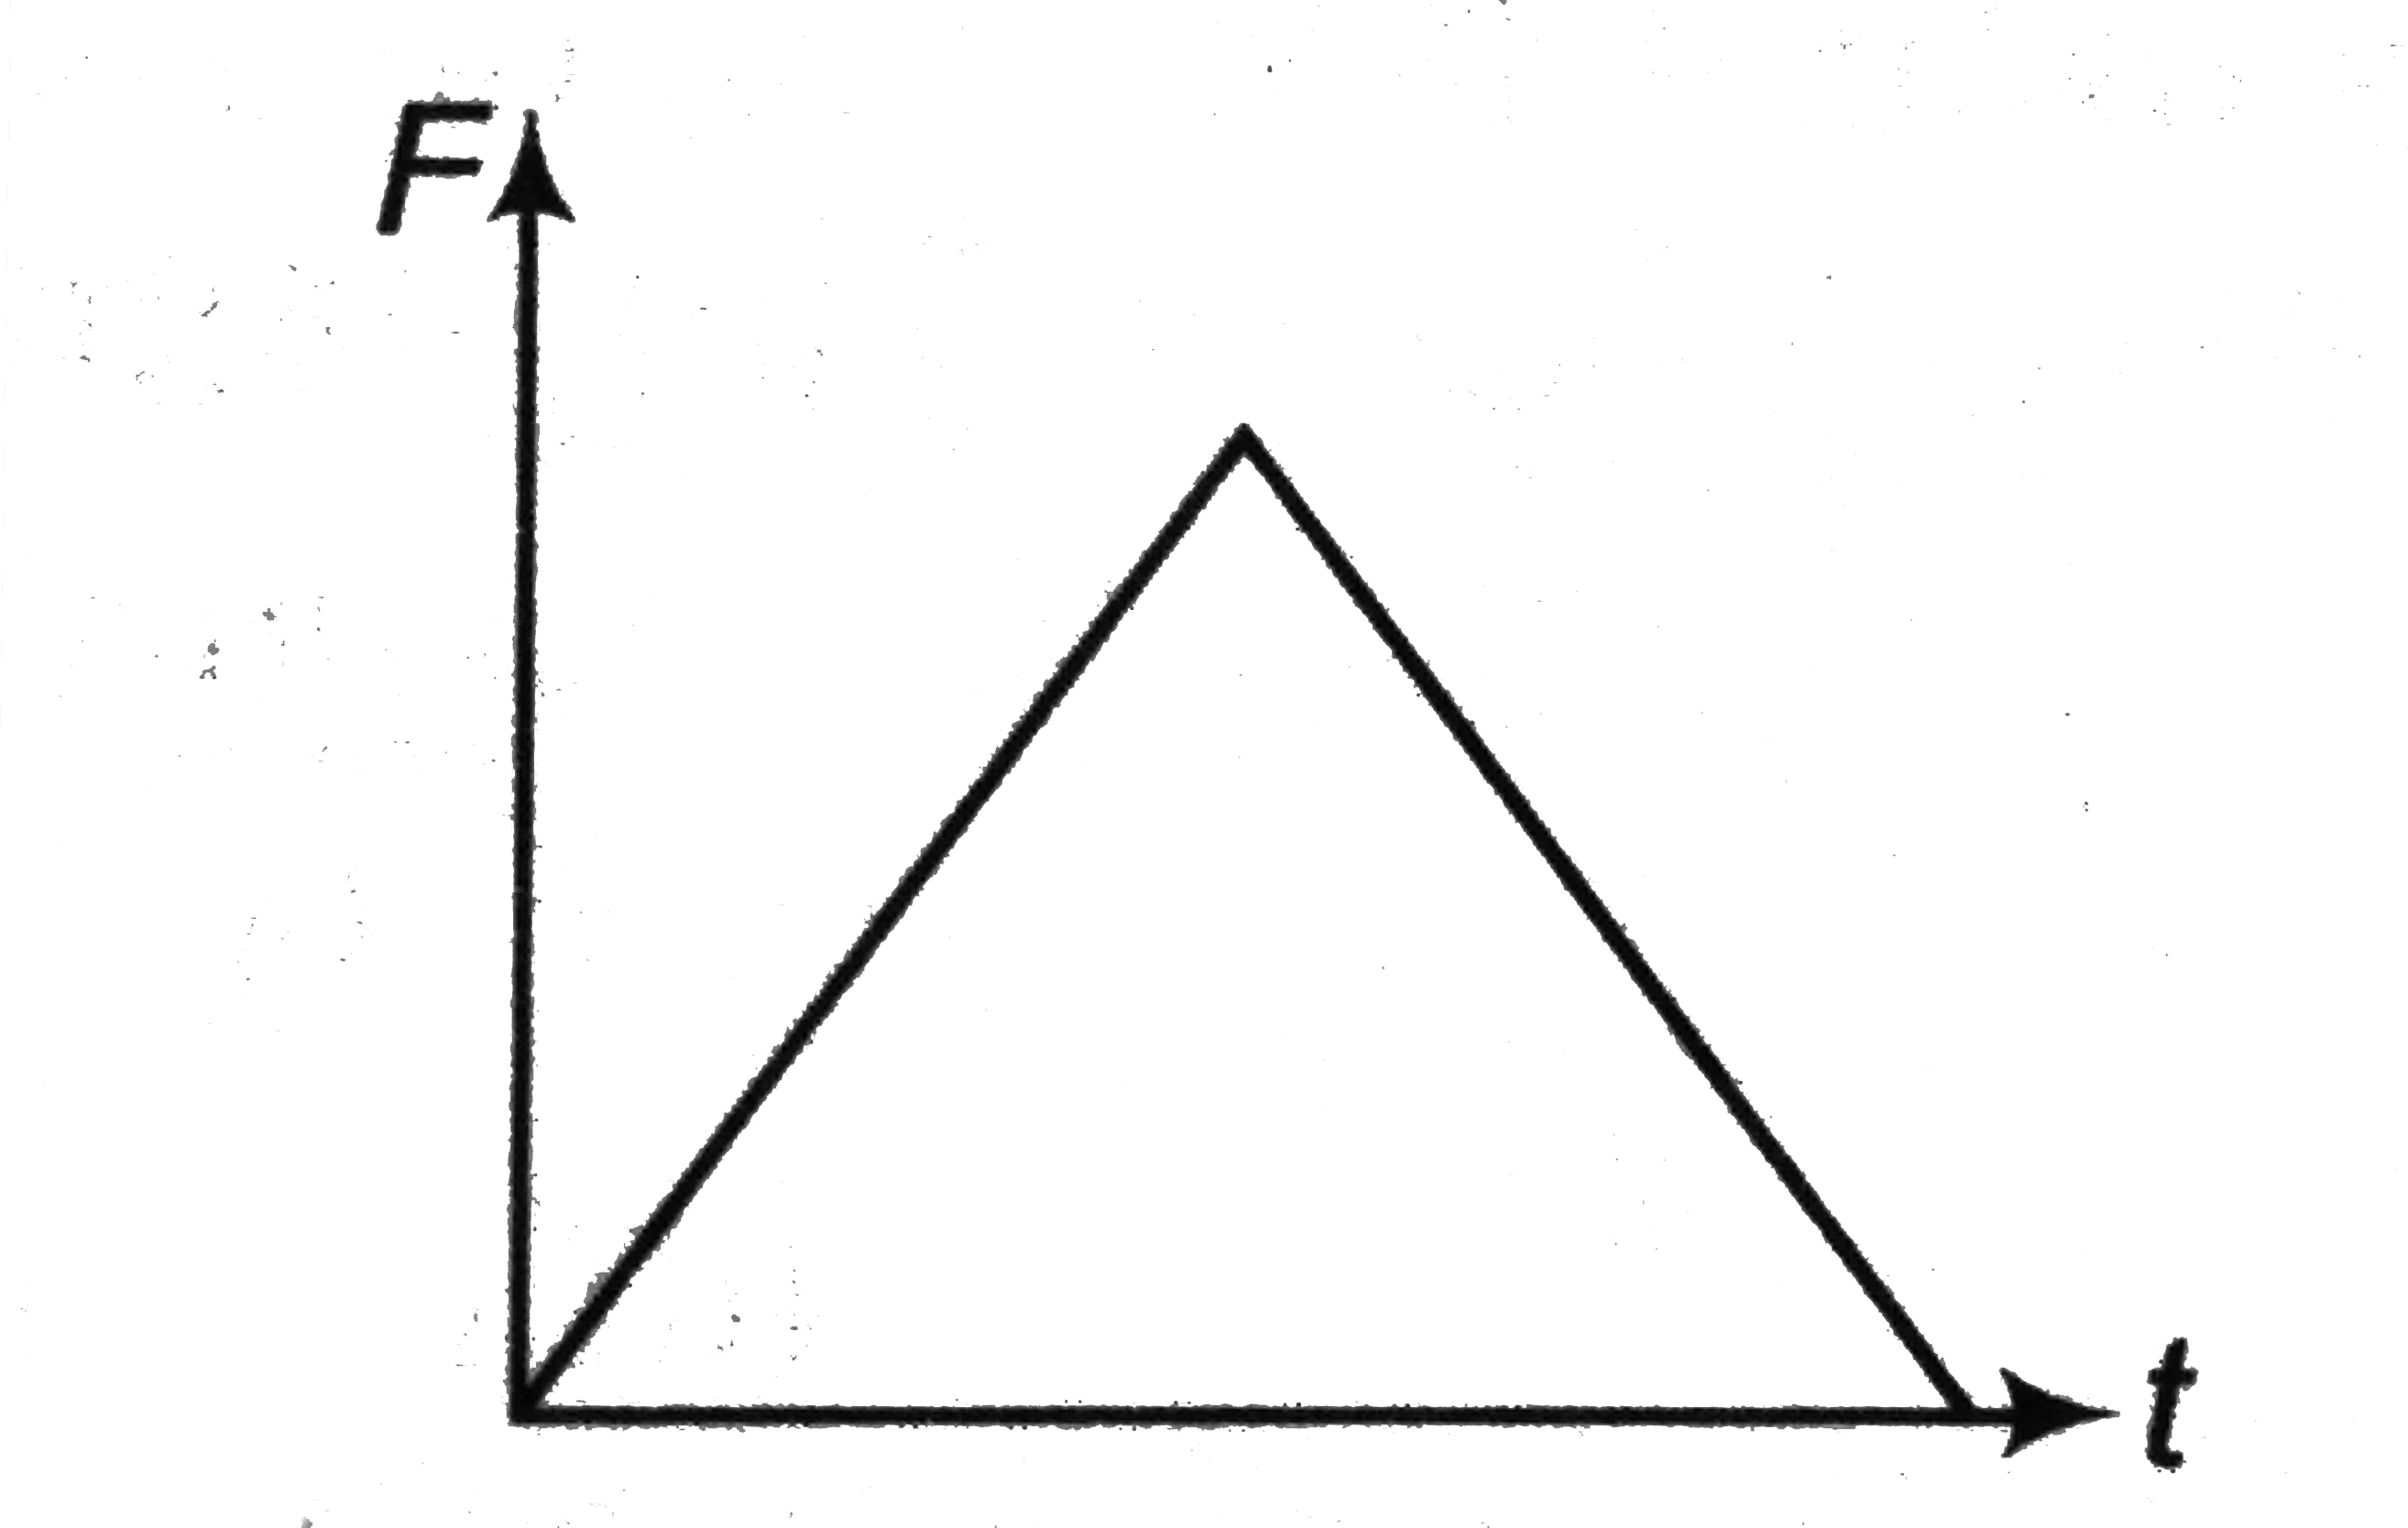 A(a)
A(a) B(b)
B(b) C(c)
C(c) D(d)
D(d)
- Question 3 - Select One
In the Q. No. 26, if M=2m and friction exists between the circular track and the horizontal surface then, which of the following lot best represents the variation of frictional force versus the angle θ:
A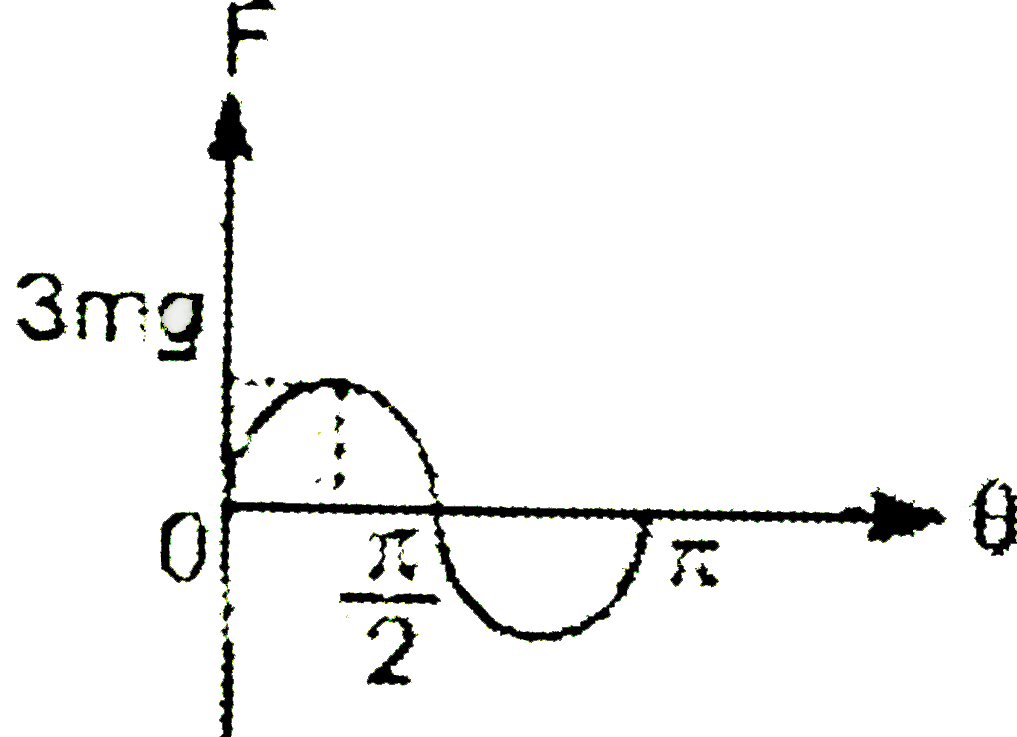 B
B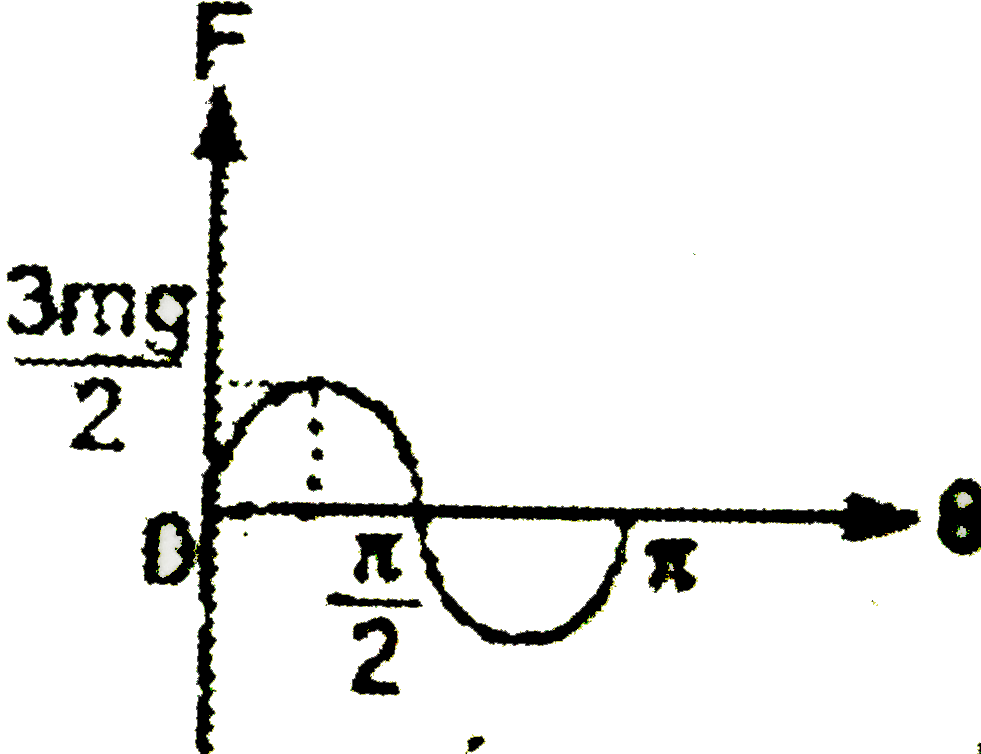 C
C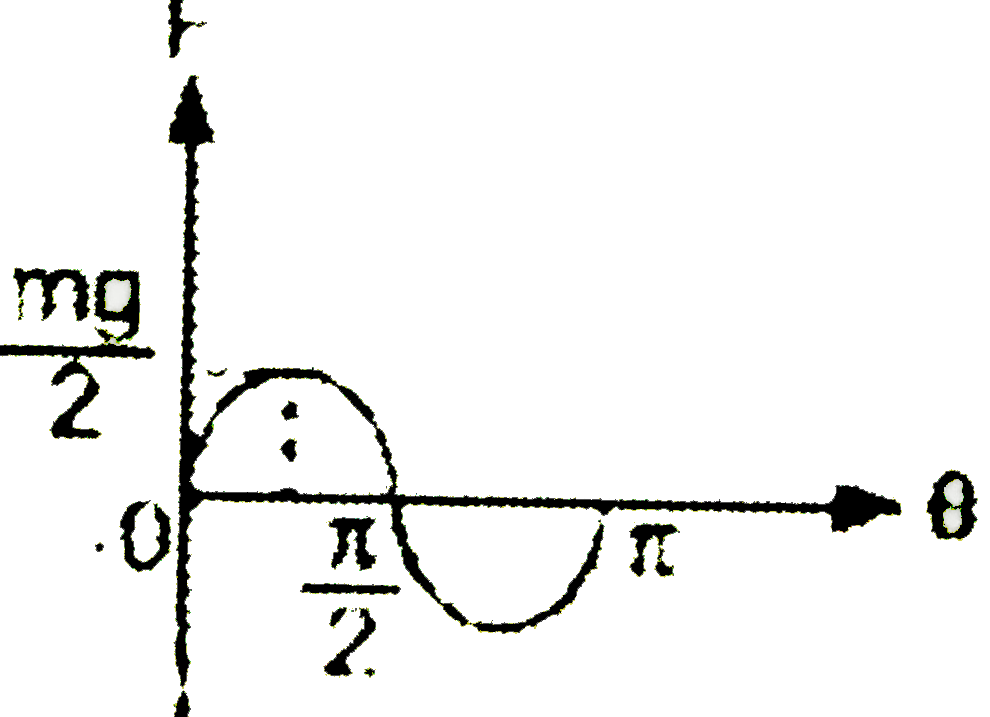 D
D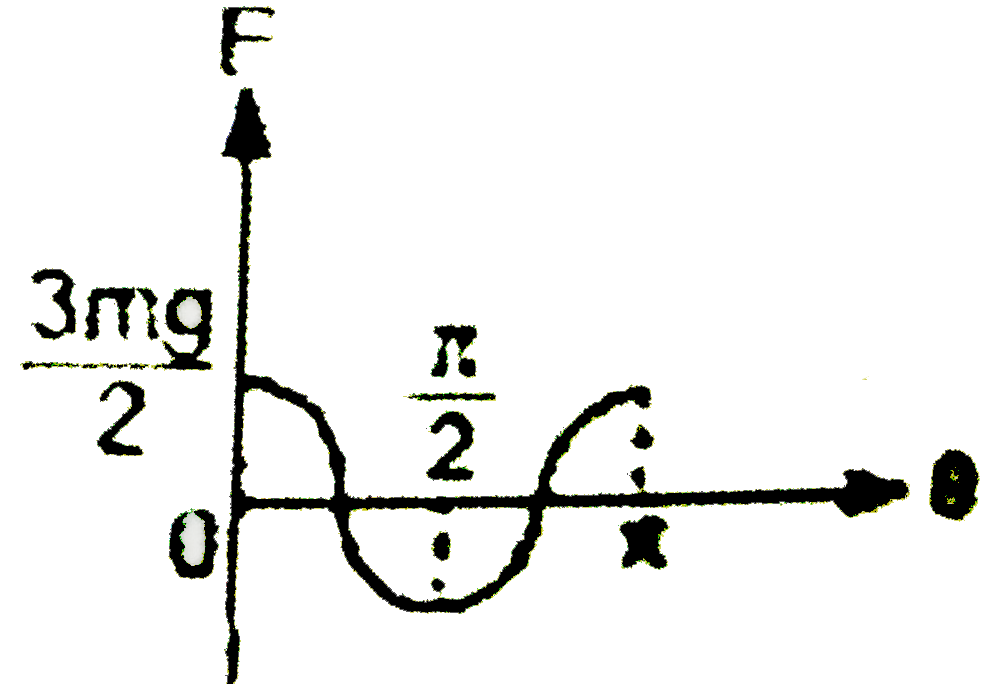
A heavy cart is pulled by a constant force F along a horizontal track with the help of a rope that passes over a fixed pulley, as shown in the figure. Assume the tension in the rope and the frictional forces on the cart remain constant and consider motion of the cart until it reaches vertically below the pulley. As the cart moves to the right, its acceleration
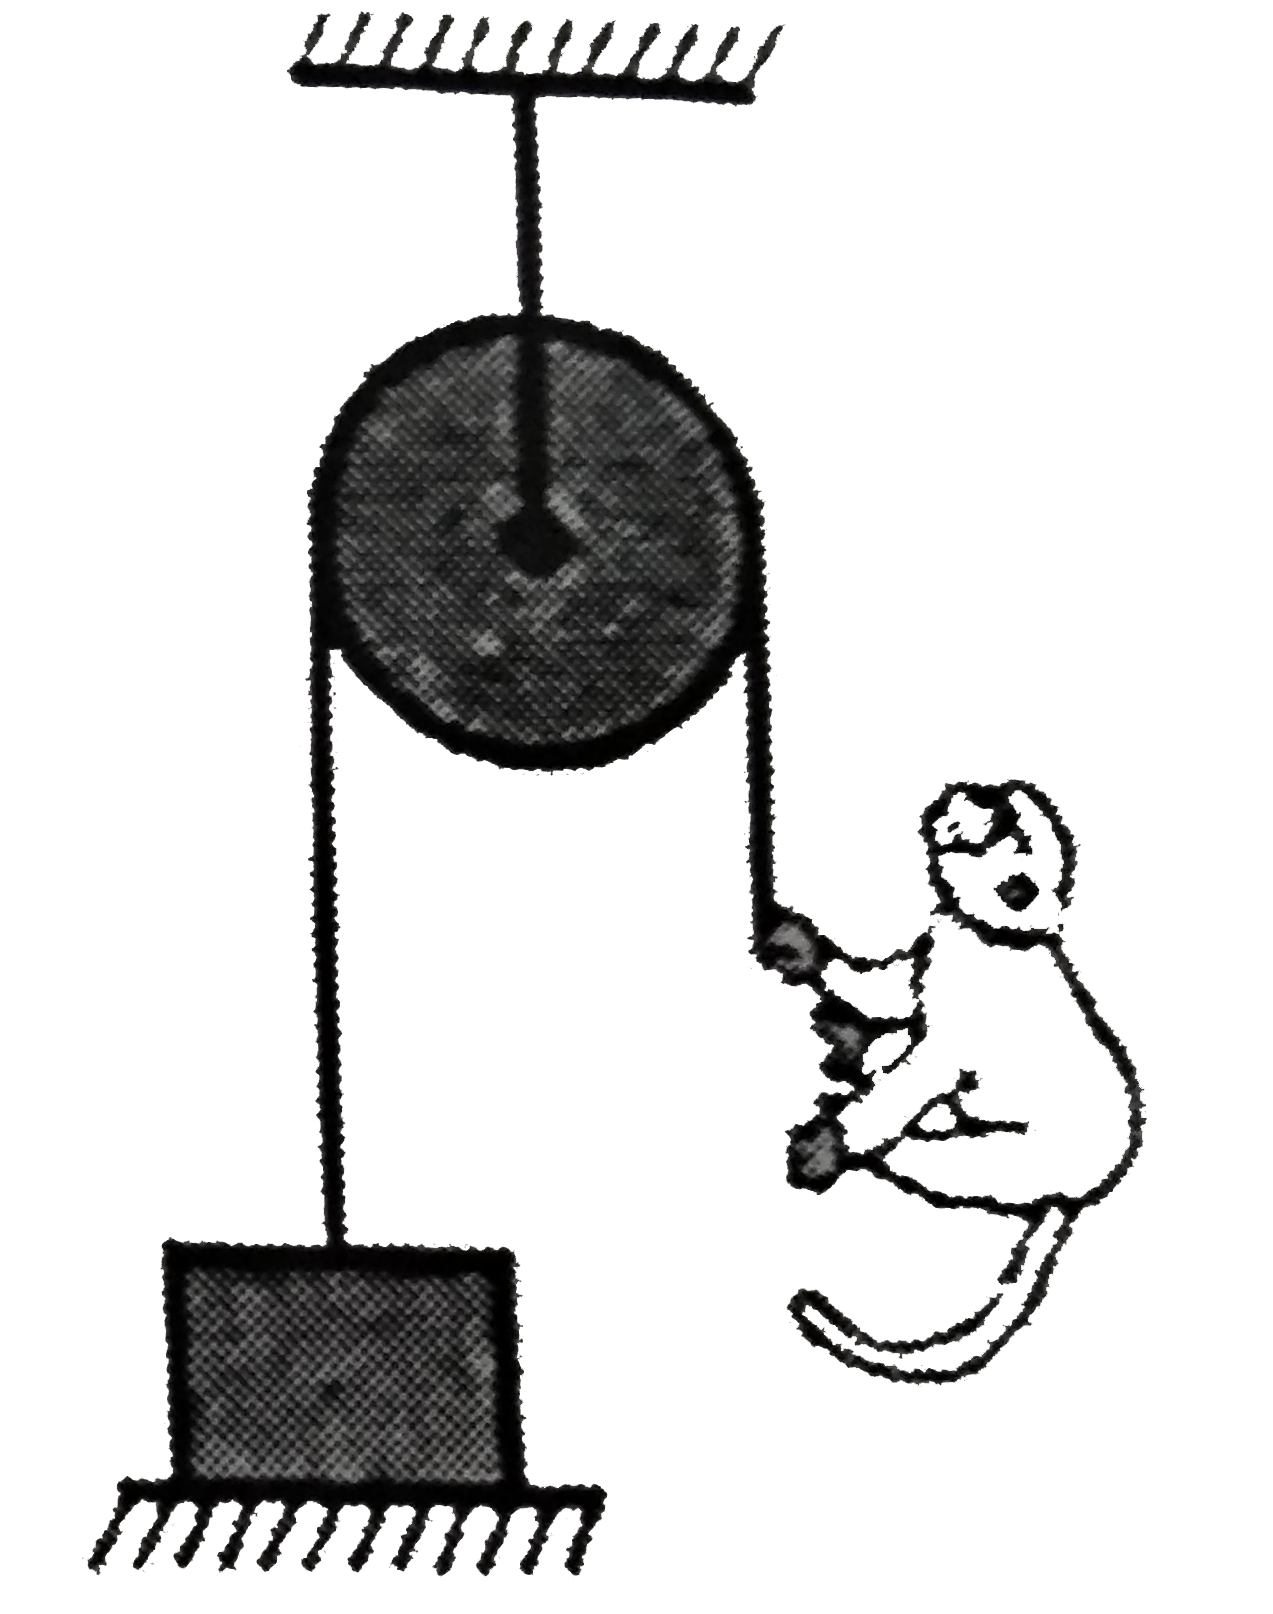 View Solution
The force acting on a particle moving along a straight line varies with time as shown in diagram.
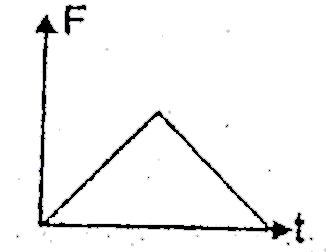
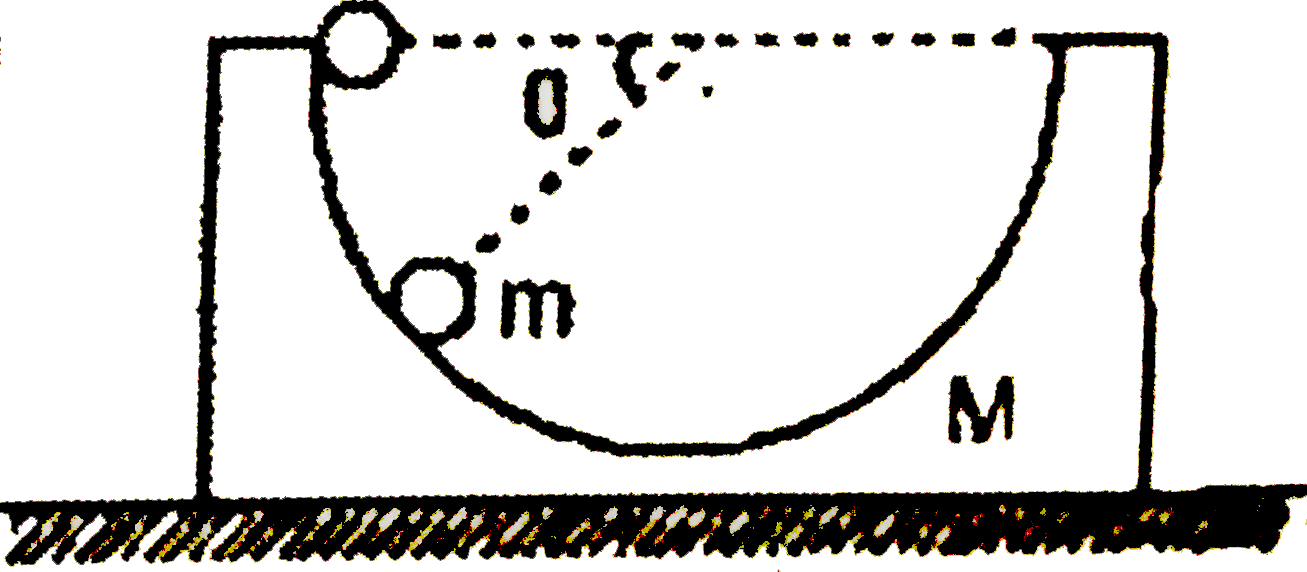
Which of the following graphs is best representative of its speed and time graphs. Initial velocity the particle is zero.View SolutionIn the shown figure, a small mass m starts sliding down a smooth and stationary circular track. Which of the following graph best represents the variation of magnitude of the force applied by the track on the mass and the angle θ?
 View Solution
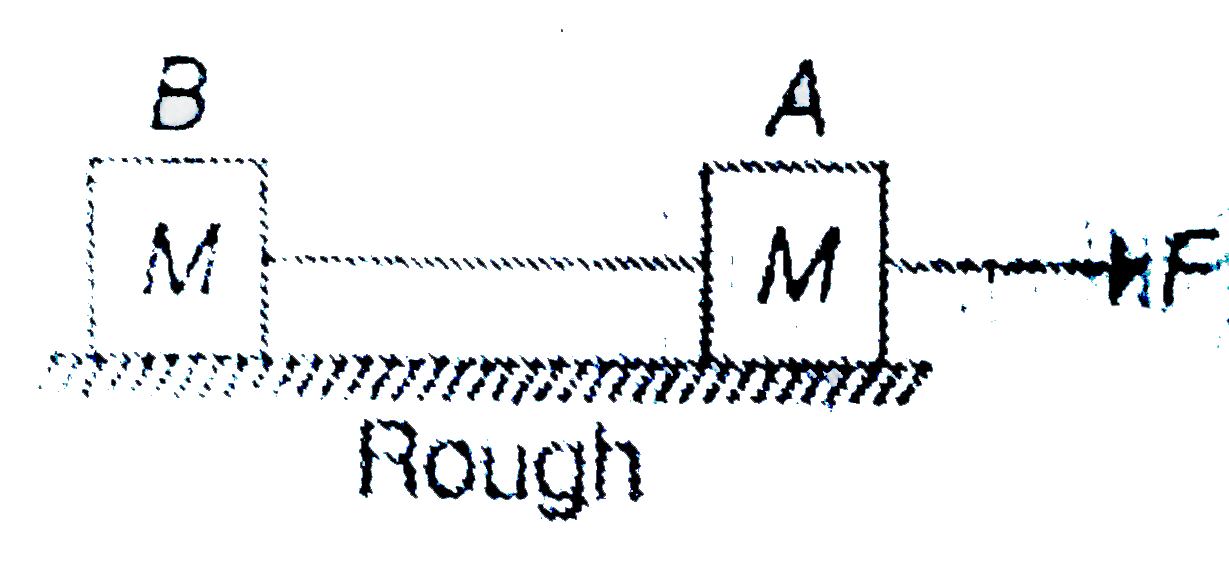
A force F=t is applied to block A as shown in figure. The force is applied at t=0 seconds when the system was at rest and string is just straight without tension. Which of the following graphs gives the friction force between B and horizontal surface as a function of time 't'.
 View Solution
A block of mass m sits at rest on a frictionless table in a rail car that is moving with speed vc along a straight horizontal track (fig.) A person riding in the car pushes on the block with a net horizontal force F for a time t in the direction of the car's motion.
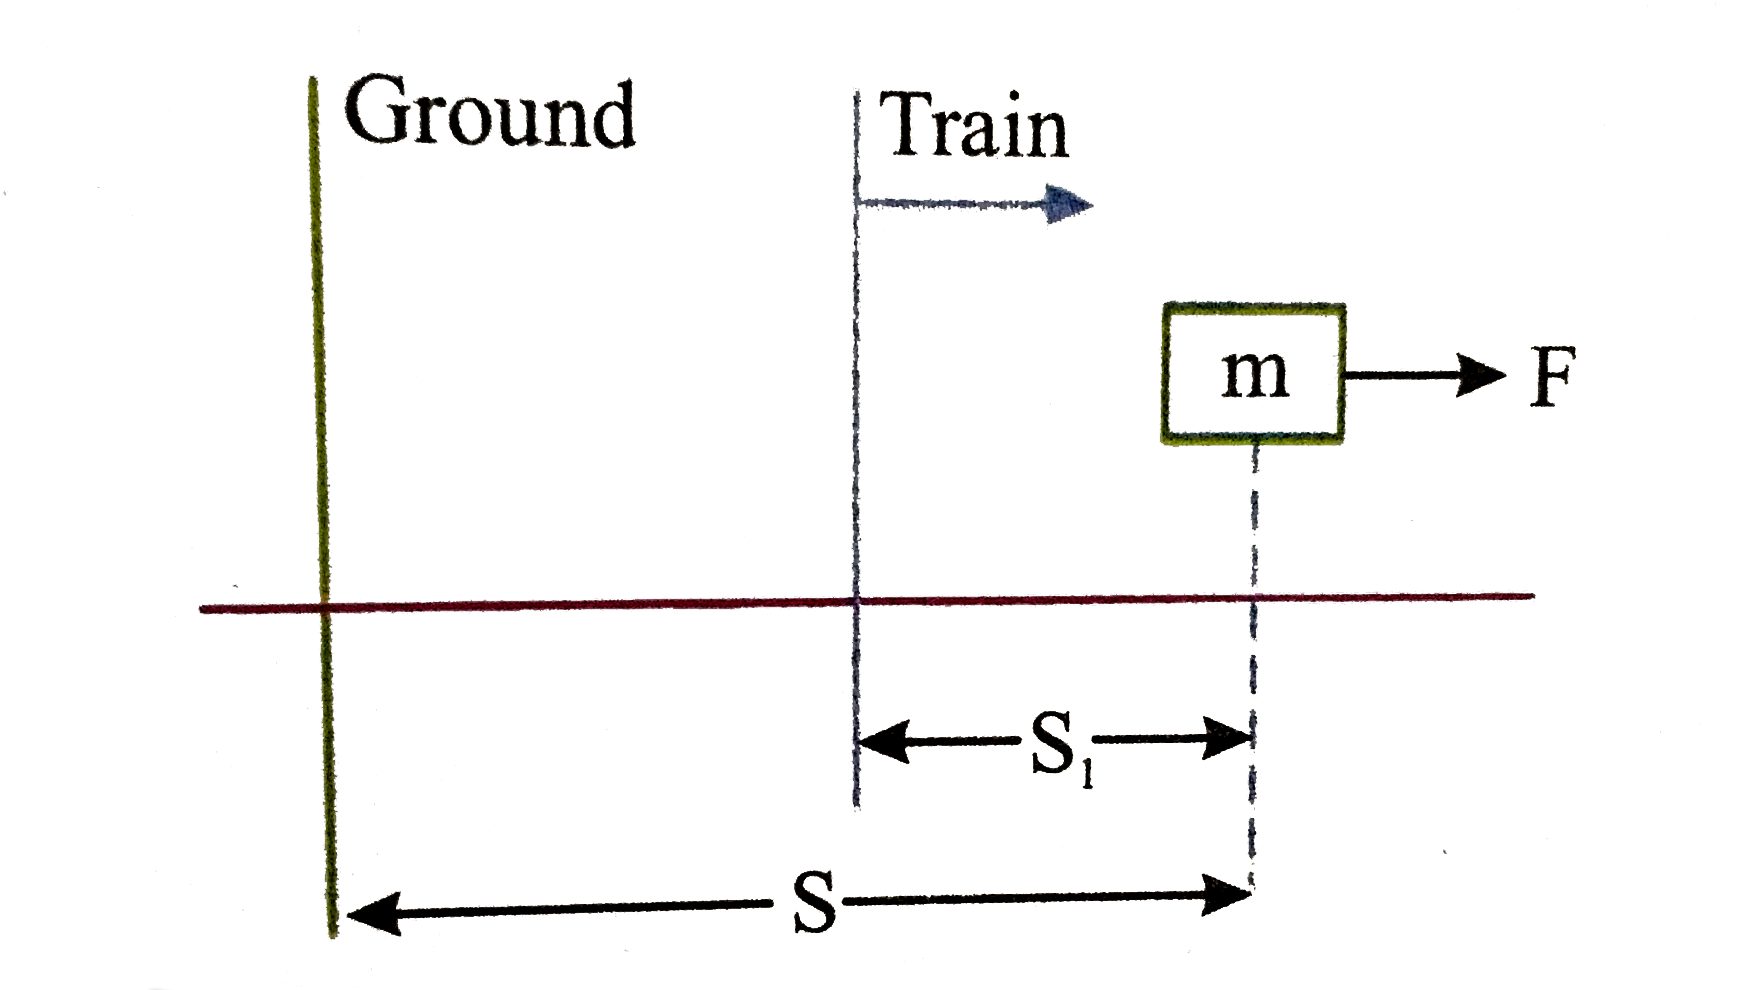
What is the final speed of the block according to a person in the car ?View Solution

