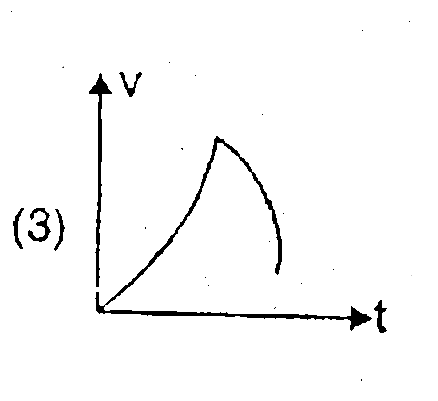
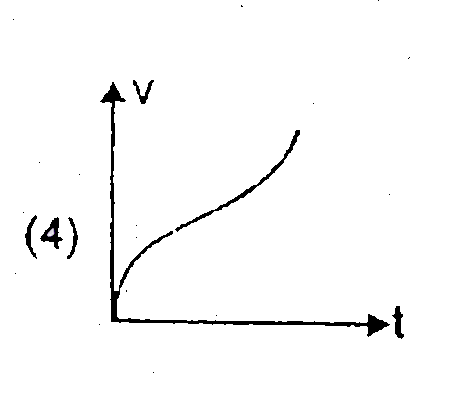
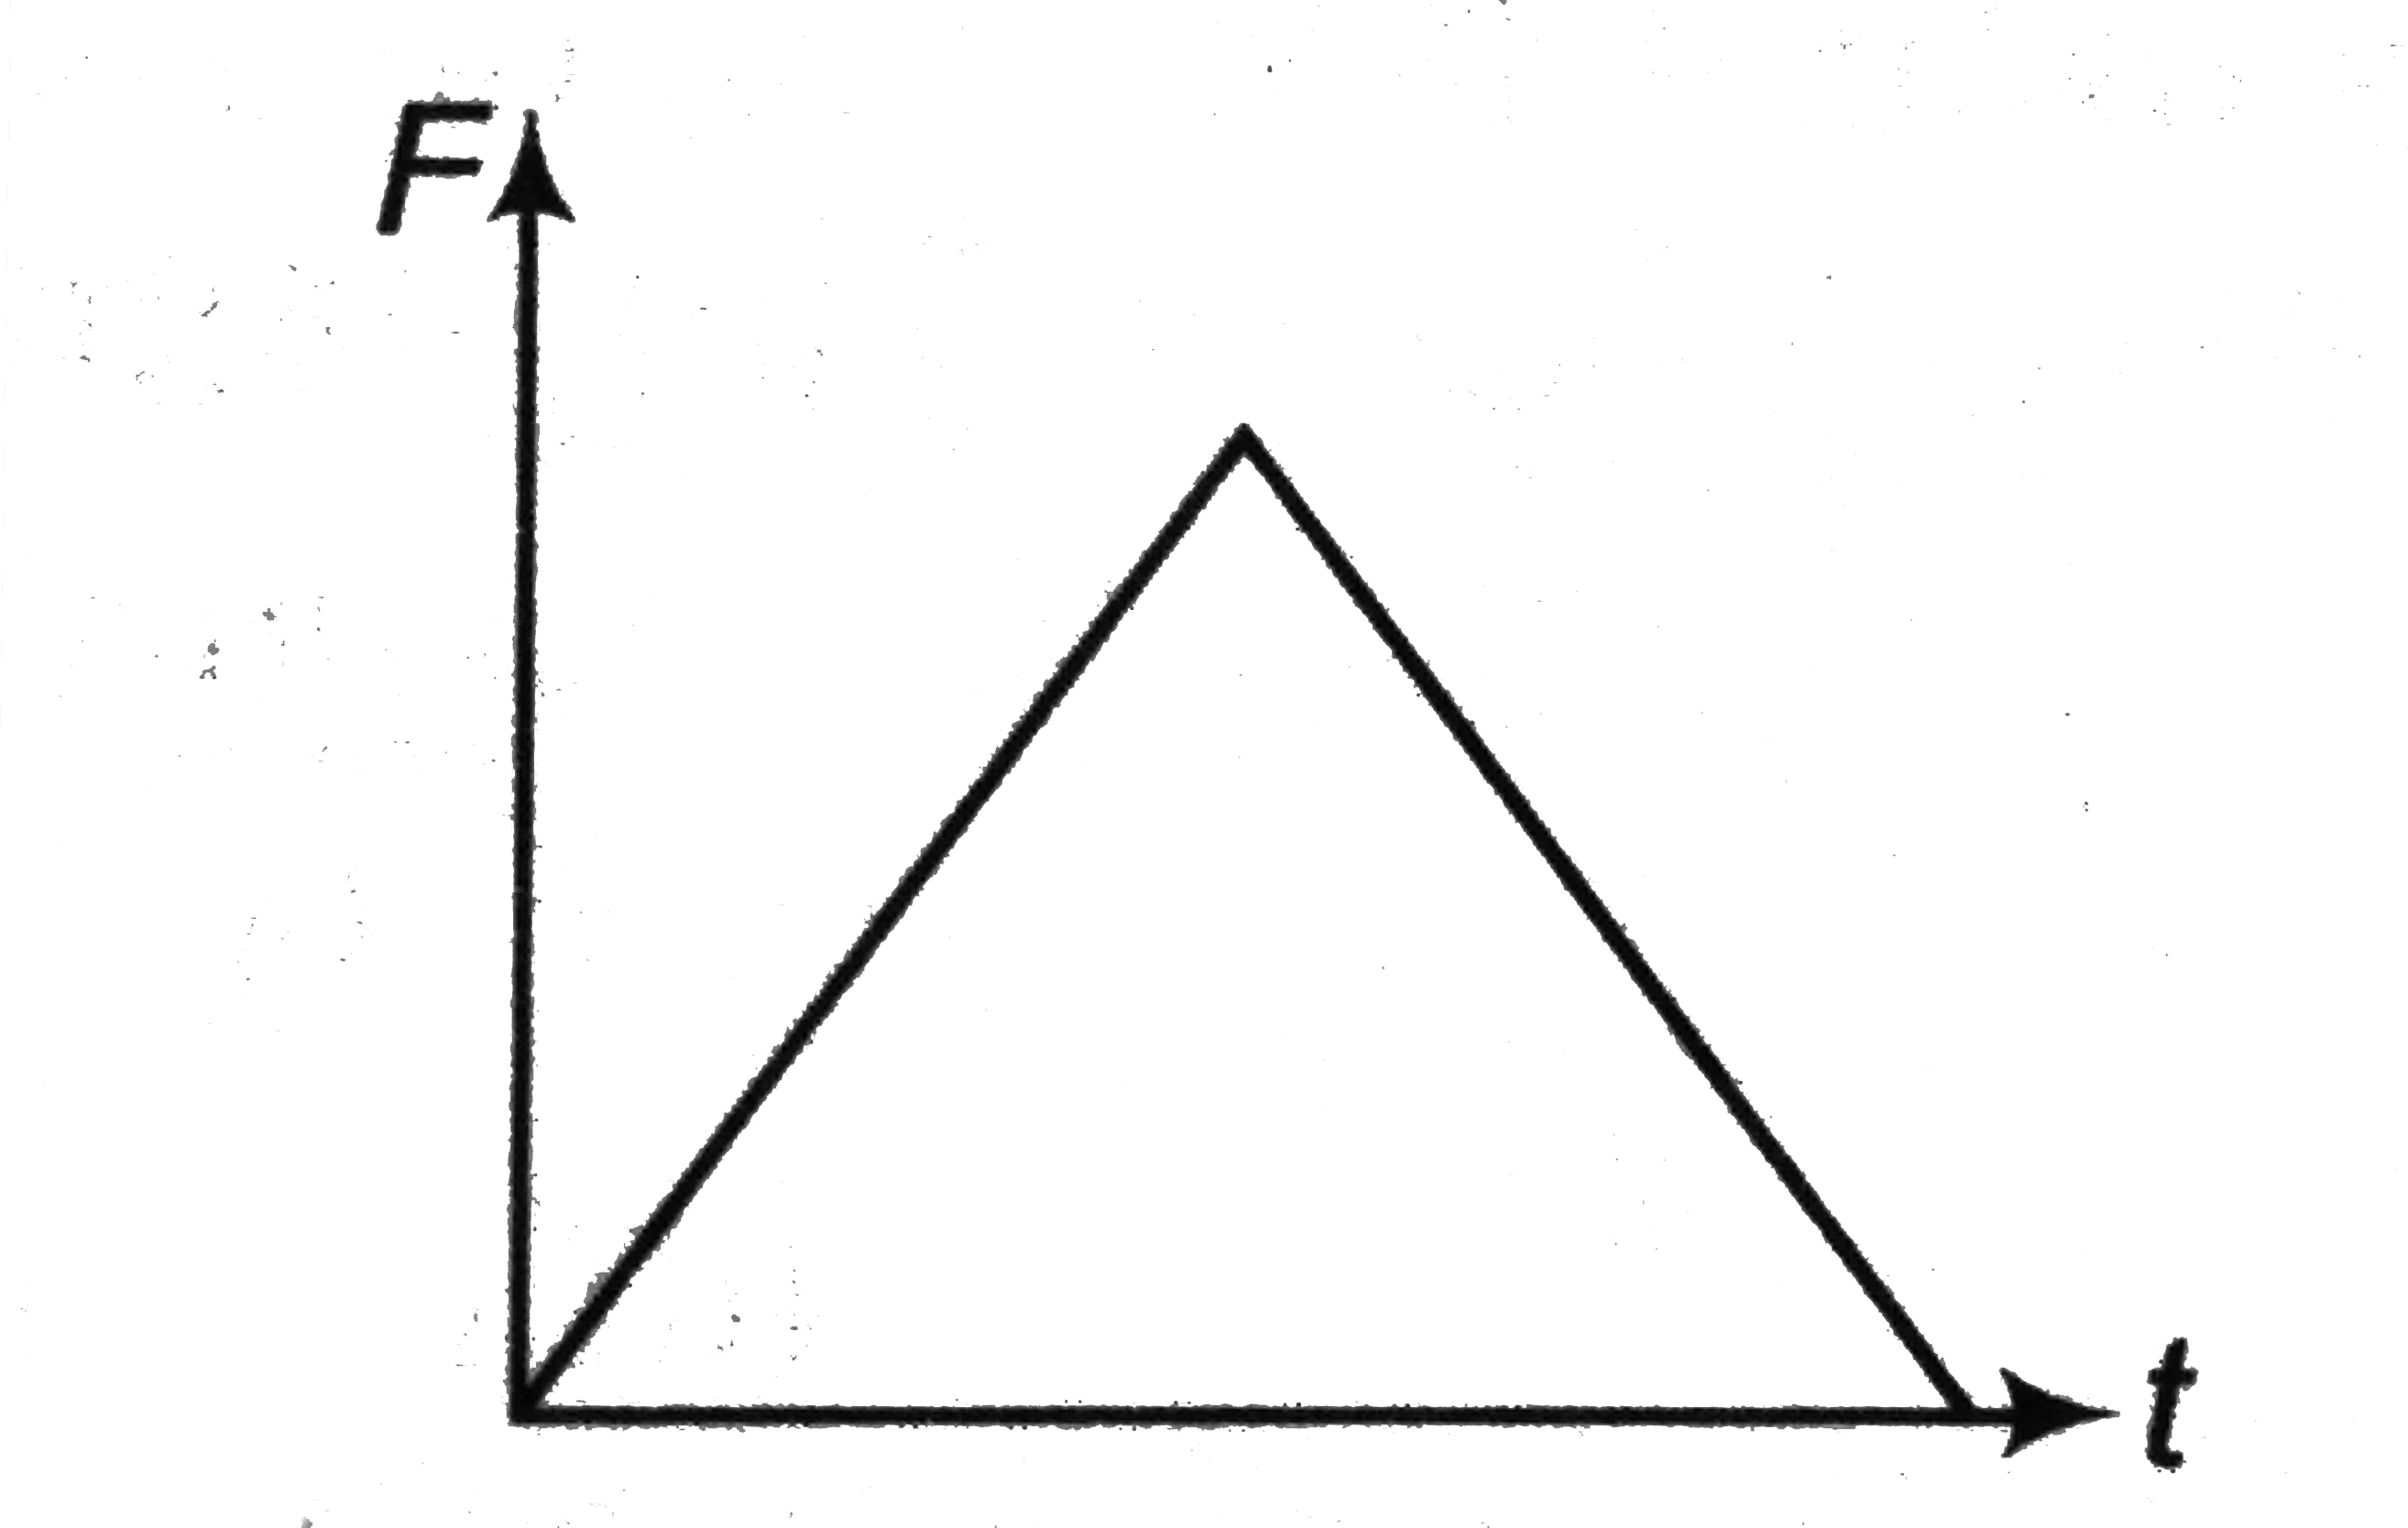
The force acting on a particle moving along a straight line varies with time as shown in diagram.
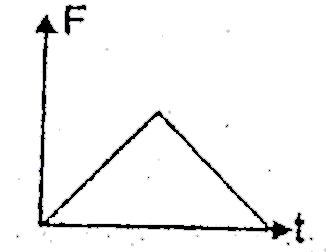
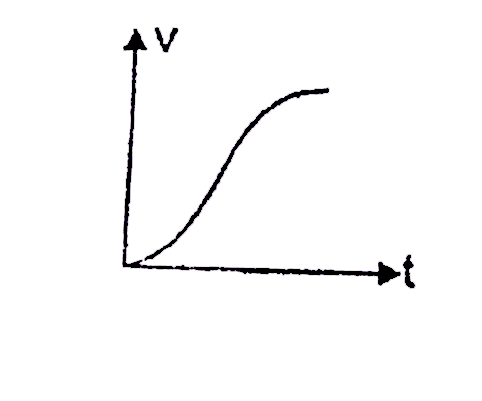
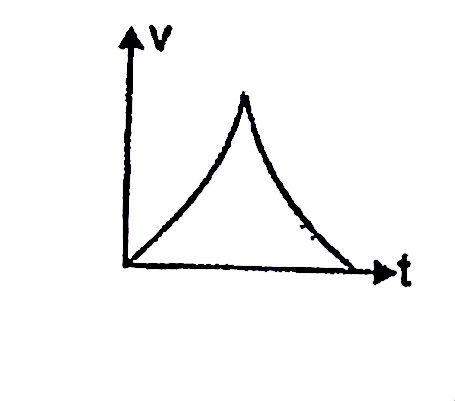
Which of the following graphs is best representative of its speed and time graphs. Initial velocity the particle is zero.
A
B
C
D
Video Solution
Text Solution
The correct Answer is:A
from the given graph of F versus t it is clear that finally acceleration is zero
so Option (1)
|
Updated on:21/07/2023
Topper's Solved these Questions
Similar Questions
Knowledge Check
- Question 1 - Select One
The net force acting on a particle moving along a straight line varies with time as shown in the diagram. Force is parallel to velocity. Which of the following graph is best representative of its speed with time? (Initial velocity of the particle is zero)
 A(a)
A(a) B(b)
B(b) C(c)
C(c) D(d)
D(d)
- Question 2 - Select One
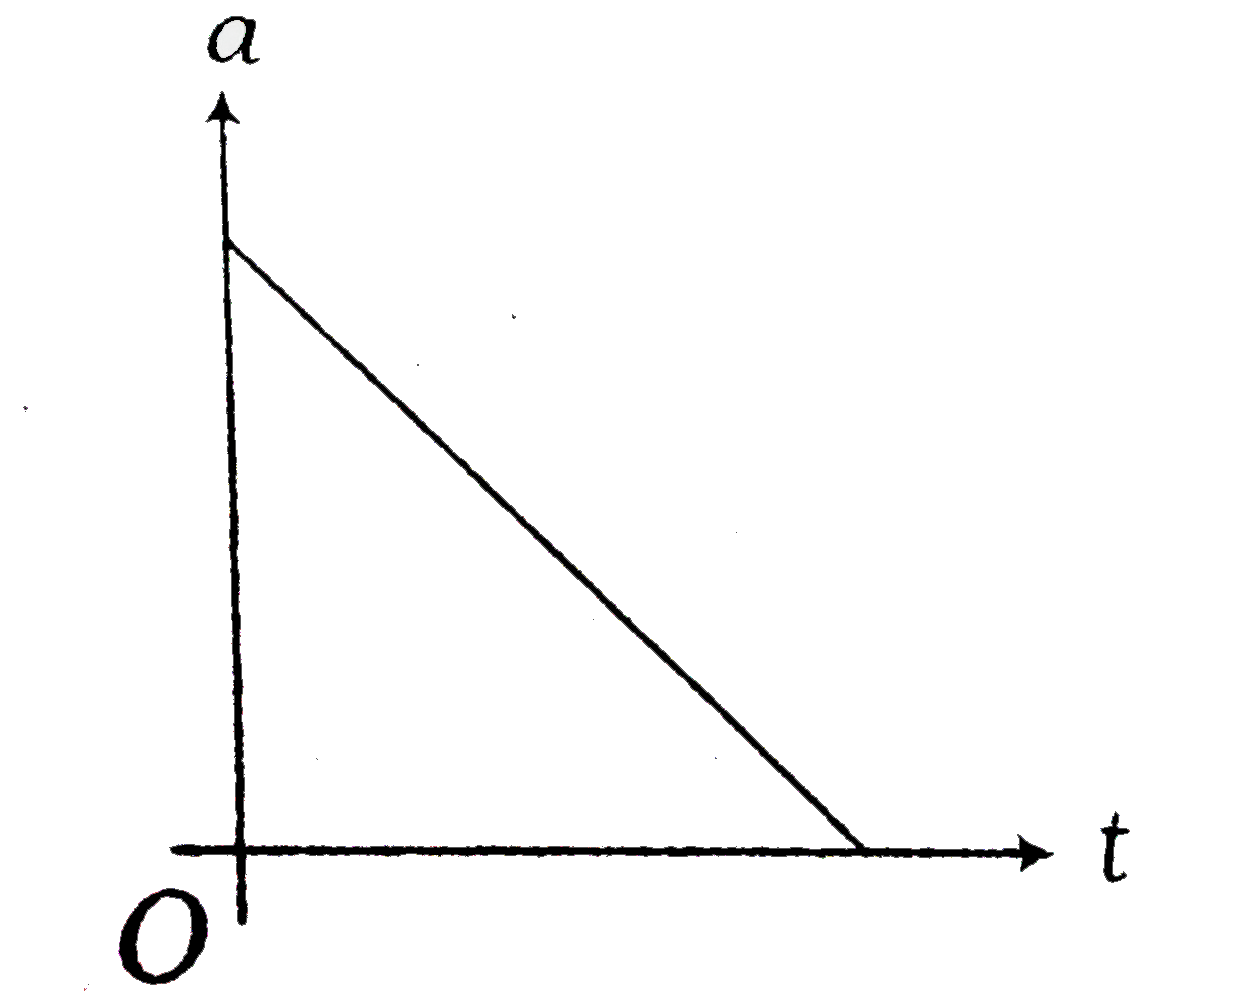
The acceleration (a)-time(t) graph for a particle moving along a straight from rest is shown in figur. Which of the following graph is the best representation of its velocity (v) with time (t) ?
 A
A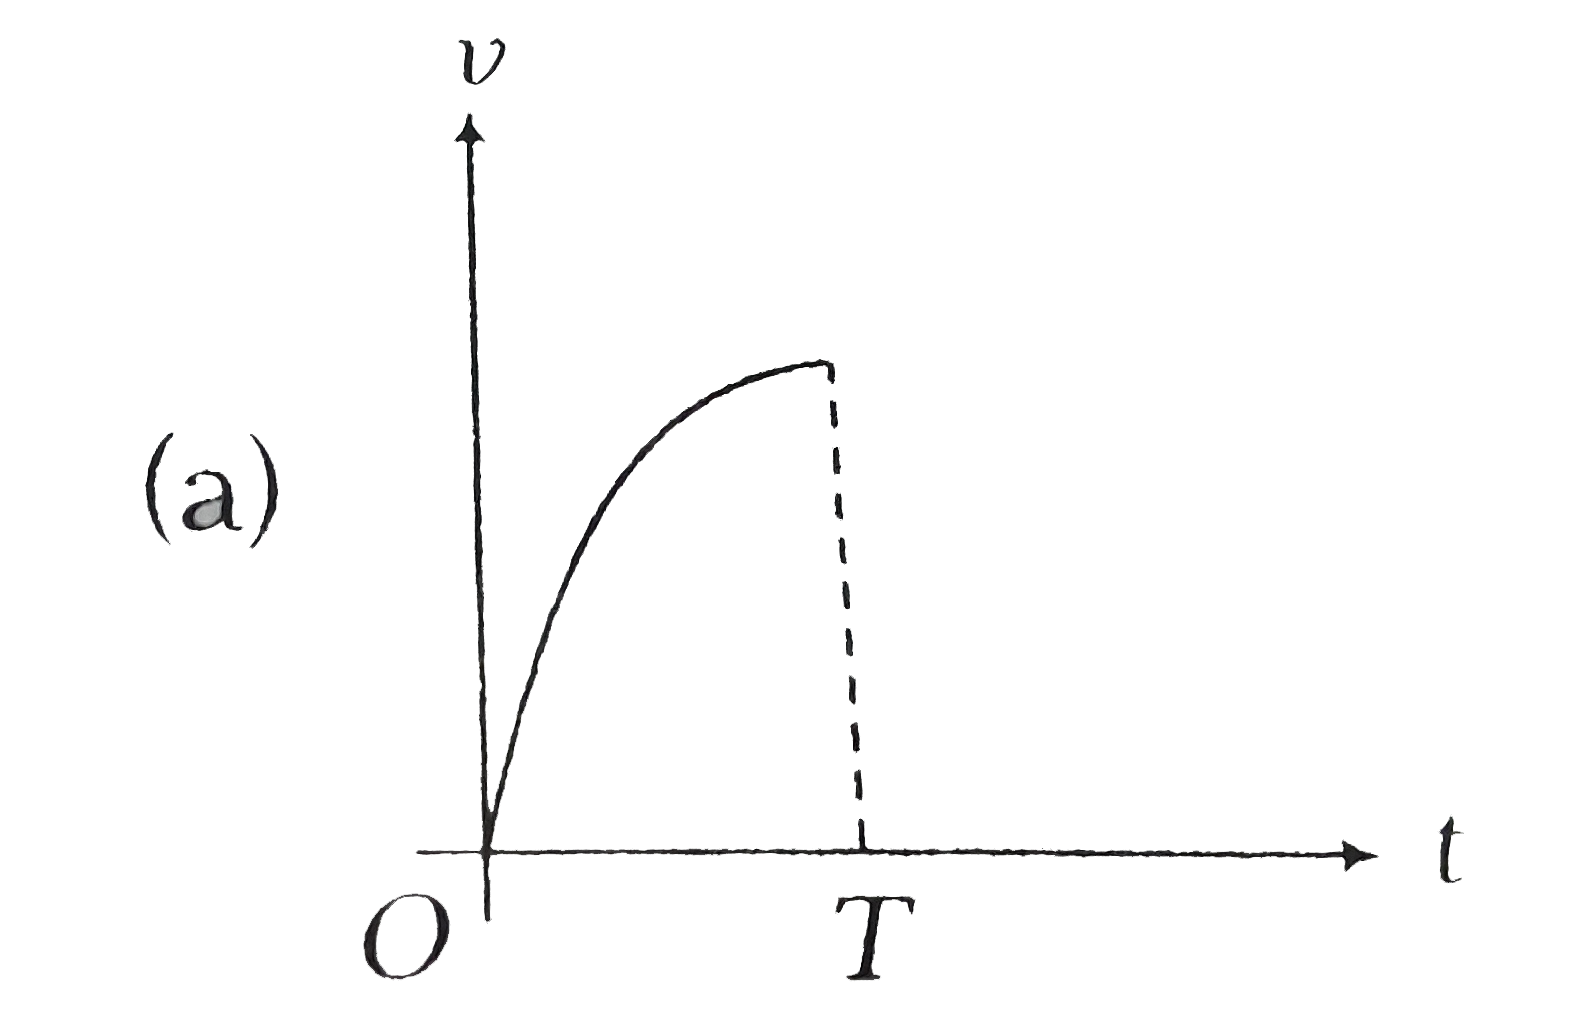 B
B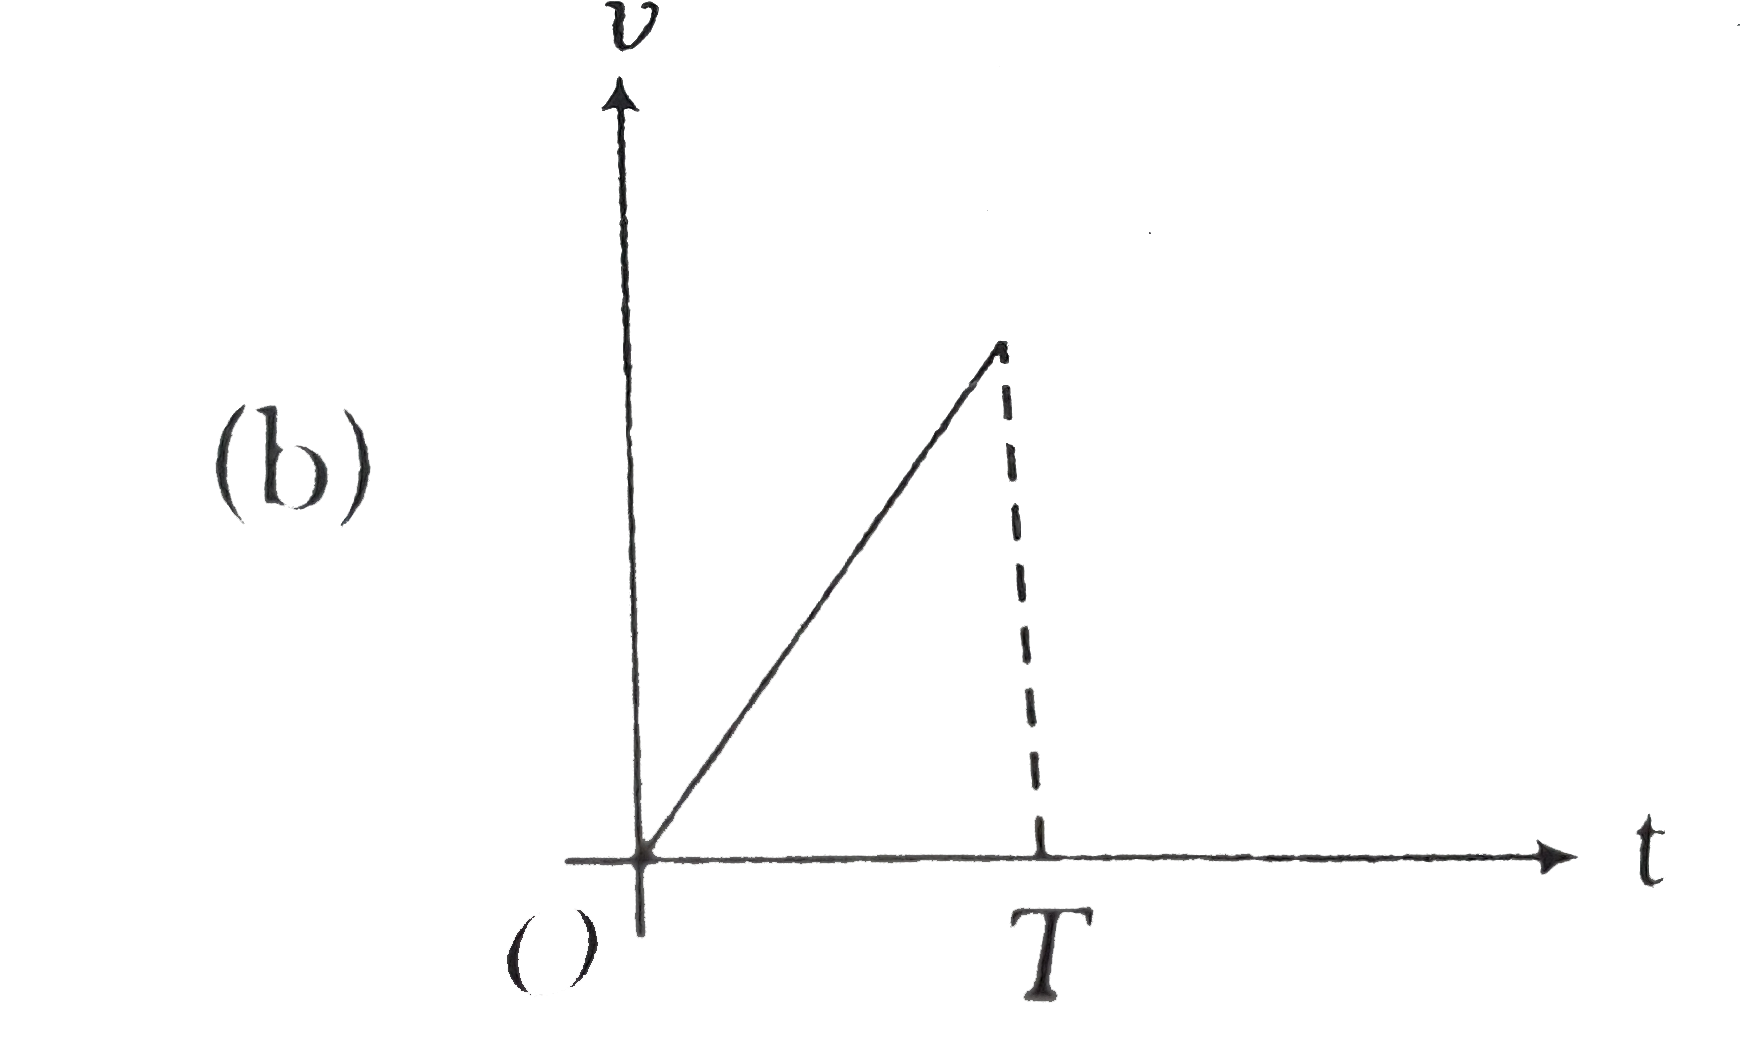 C
C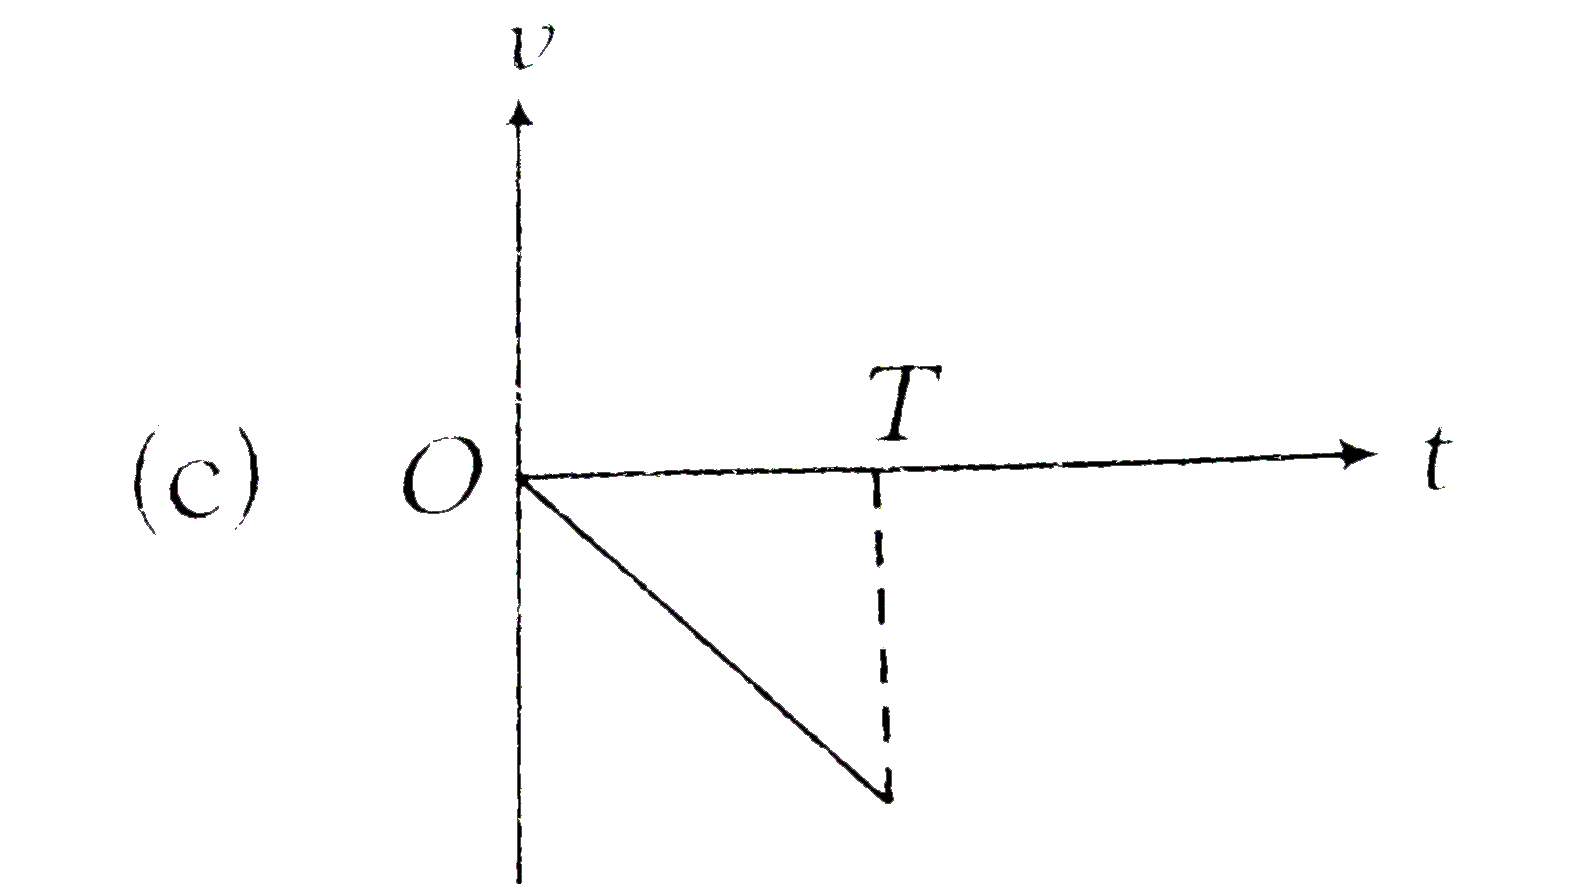 D
D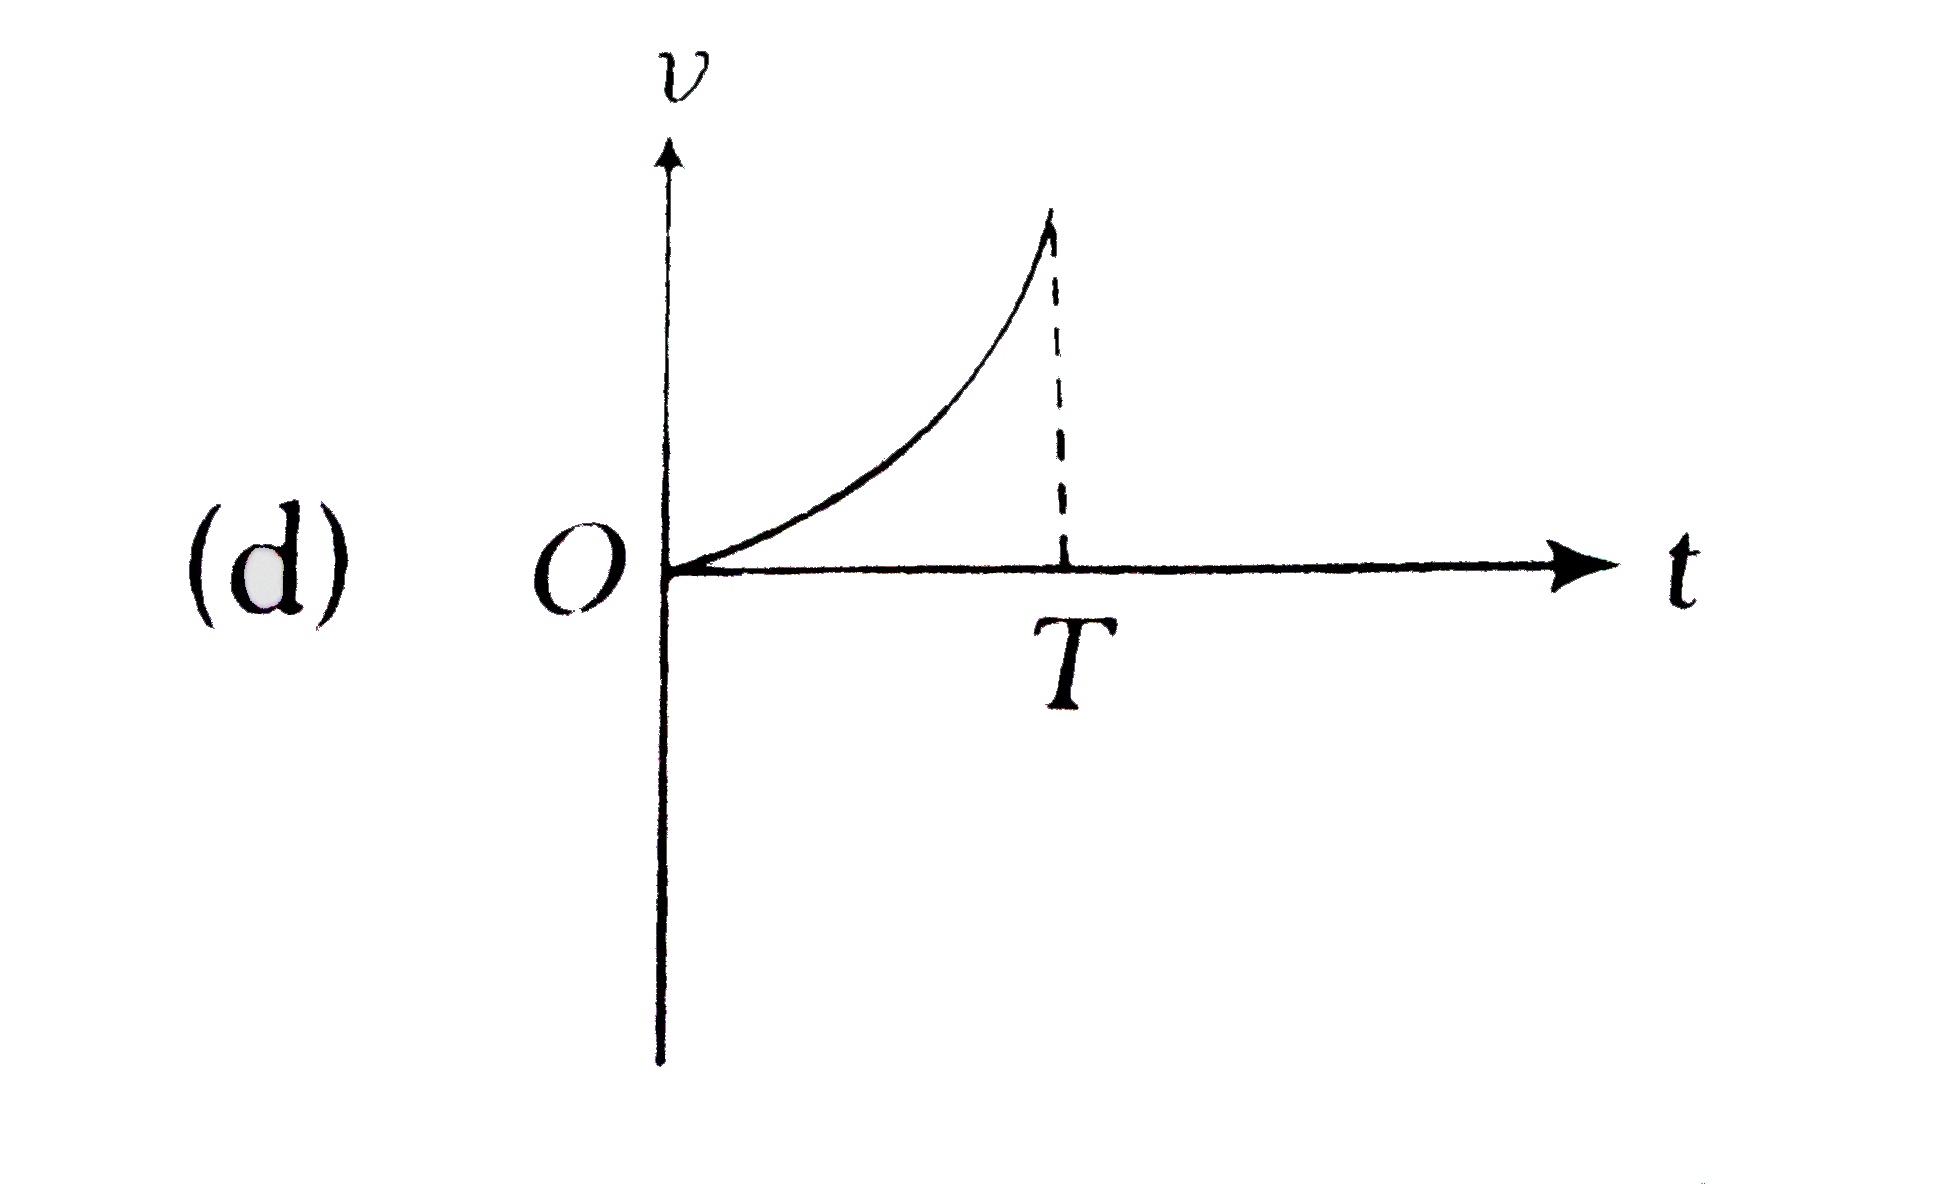
- Question 3 - Select One or More
Displacement time graph of a particle moving in a straight line is a shown in figure.
 Ain region A acceleration is positiveBin region B acceleration is negativeCin region C acceleration is positiveDin region D acceleration is negative
The x-t graph of a particle moving along a straight line is shown in figure

The v-t graph of the particle is correctly shown byView SolutionThe x-t graph of a particle moving along a straight line is shown in figure
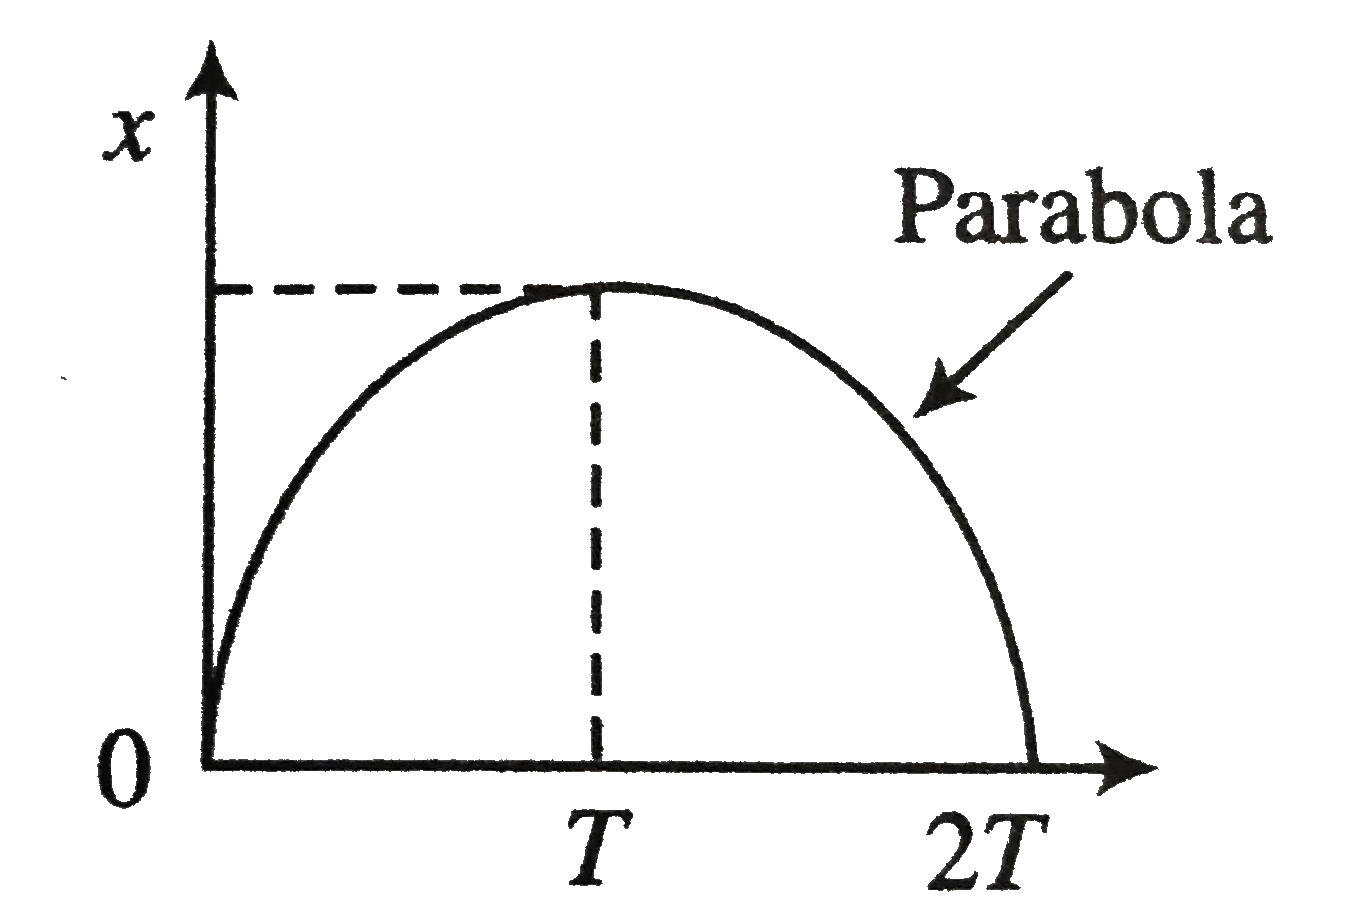
The a-t graph of the particle is correctly shown byView Solution
The velocity displacement graph of a particle moving along a straight line is shown in figure.
Then the acceleration displacement graph is.View SolutionKinetic energy of a particle moving in a straight line varies with time t as K=4t2. The force acting on the particle
View SolutionThe x−t graph of particle moving along a straight line is shown in figure
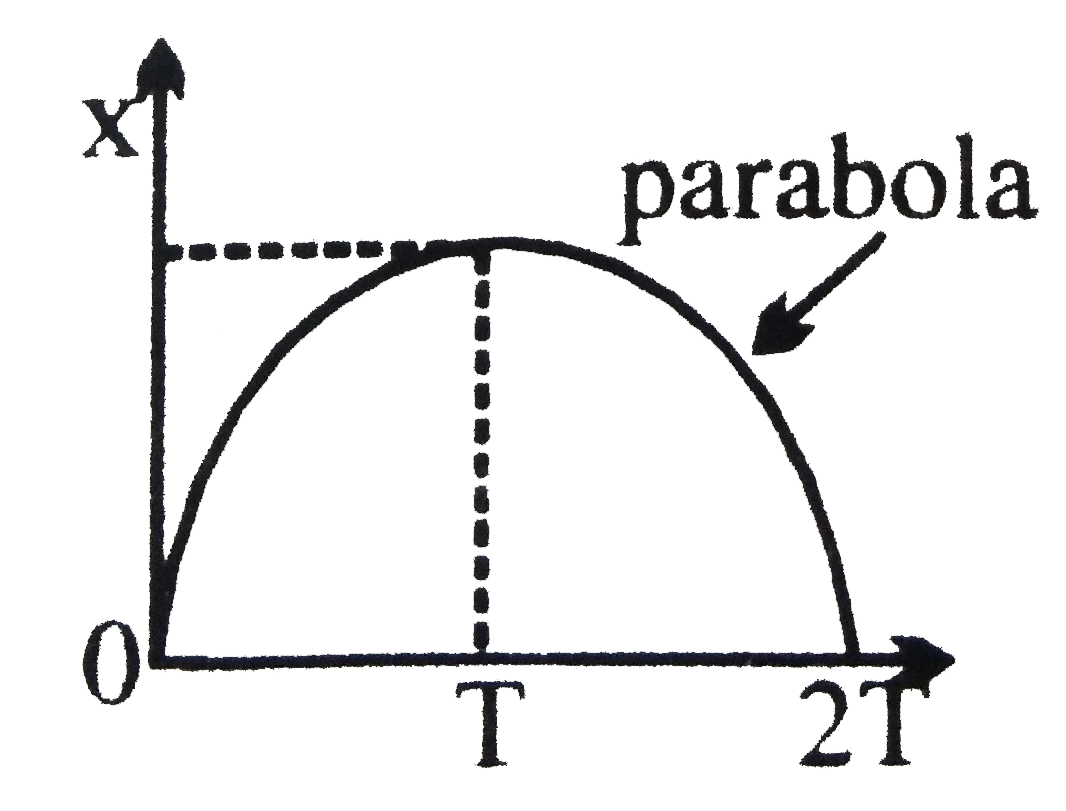
The a−t graph of the particle is correctly shown byView Solution


