A body is travelling in a straight line with uniformly increasing speed. Which one of the plots represents the changes in distance (s) travelled with time (t) ?
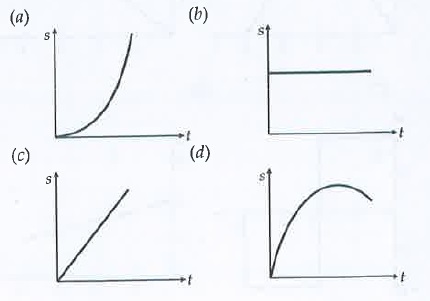


The correct Answer is:A
S=ut+12at2
if u=0,S=12at2
Topper's Solved these Questions
- MOTION IN ONE DIMENSIONBOOK - ERRORLESSCHAPTER - MOTION IN ONE DIMENSIONEXERCISE - NCERT BASED QUESTIONS (RELATIVE MOTION )
18 Videos
- MOTION IN ONE DIMENSIONBOOK - ERRORLESSCHAPTER - MOTION IN ONE DIMENSIONEXERCISE - NCERT BASED QUESTIONS (MOTION UNDER GRAVITY )
56 Videos
- MOTION IN ONE DIMENSIONBOOK - ERRORLESSCHAPTER - MOTION IN ONE DIMENSIONEXERCISE - NCERT BASED QUESTIONS (UNIFORM MOTION )
24 Videos
- KINETIC THEORY OF GASES BOOK - ERRORLESSCHAPTER - KINETIC THEORY OF GASES EXERCISE - ASSERTION AND REASON
16 Videos
- MOTION IN TWO DIMENSIONBOOK - ERRORLESSCHAPTER - MOTION IN TWO DIMENSIONEXERCISE - ASSERTION & REASON
19 Videos
Similar Questions
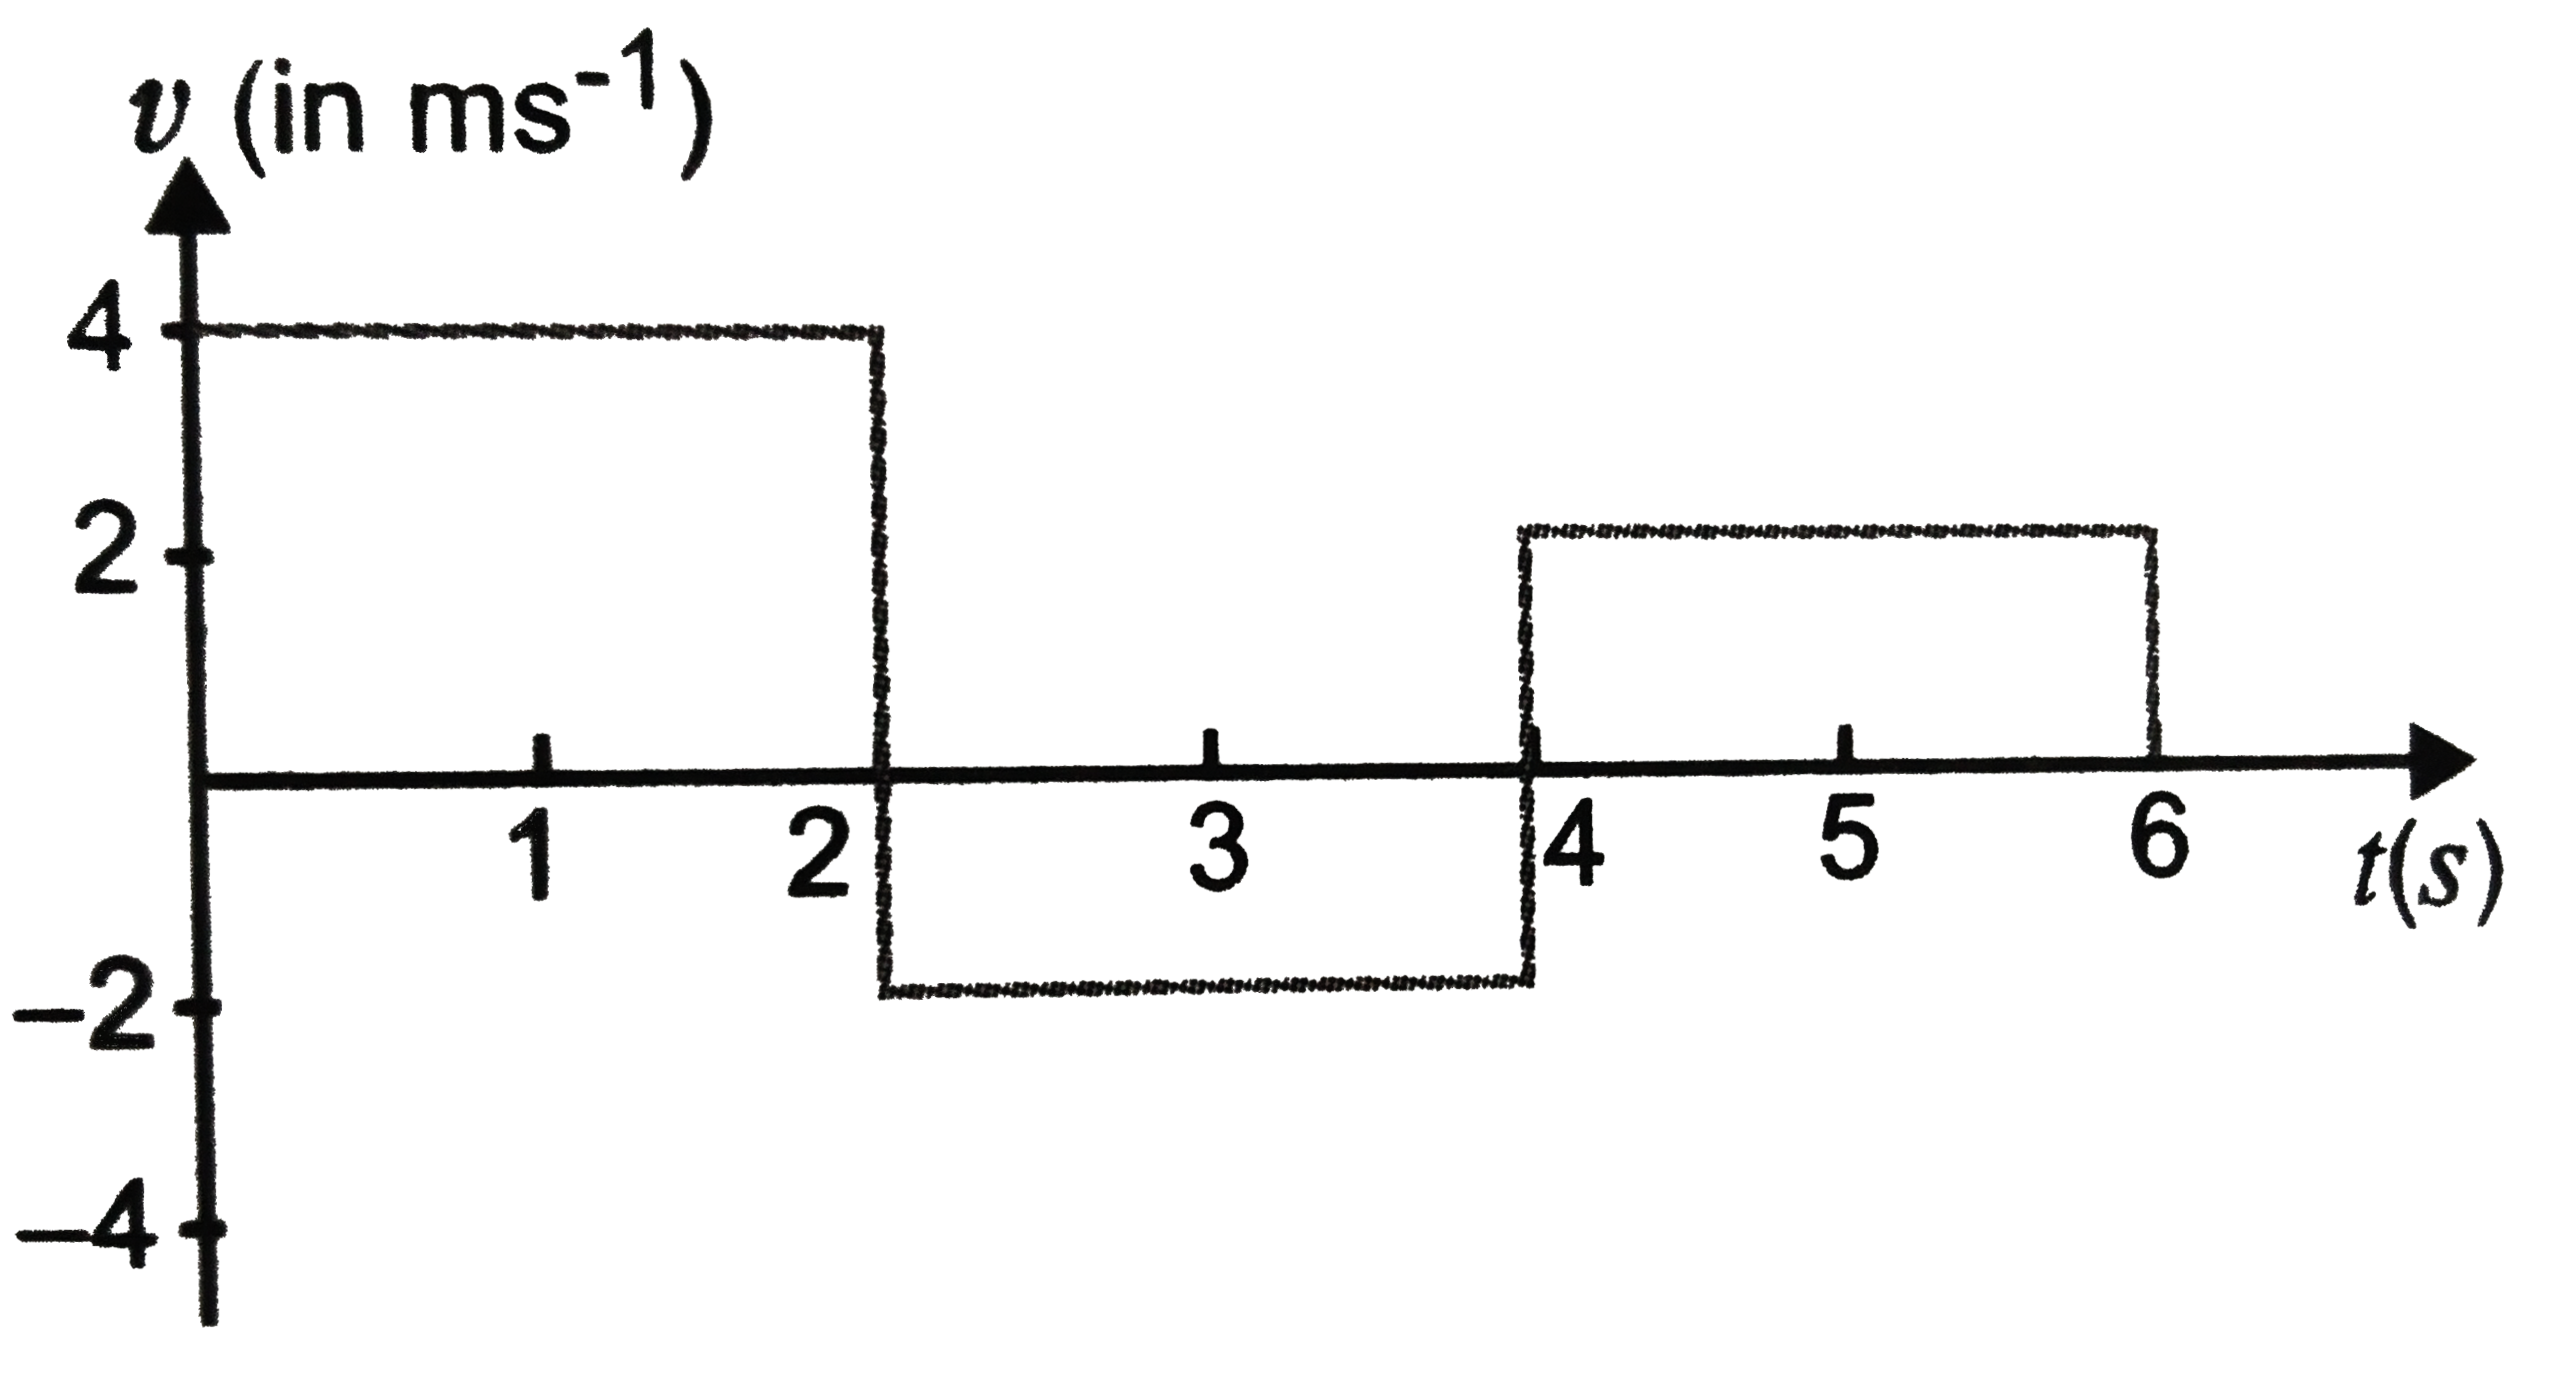
The velocit-time graph of a body moving in a straight line is shown in Fig. 2 (d) . 32. Find the displacement and the distance travelled by the body in 6seconds.
 .
.
View SolutionA particle moves in a straight line and its speed depends on time as v=|2t−3| ∫vdt representsthe distance travelled of the particle then find the displacement of the particle in 5 s
View Solution
Knowledge Check
A body starting from the rest moves along a straight line with constant acceleration .Which one of the following graphs represent the variation of speed (v) and distance (s) ?
A B
B C
C D
D
A body starting from the the rest moves along a straight line with constant acceleration. Which one of the following graphs represents the variation of speed(v) and distance(s)?
A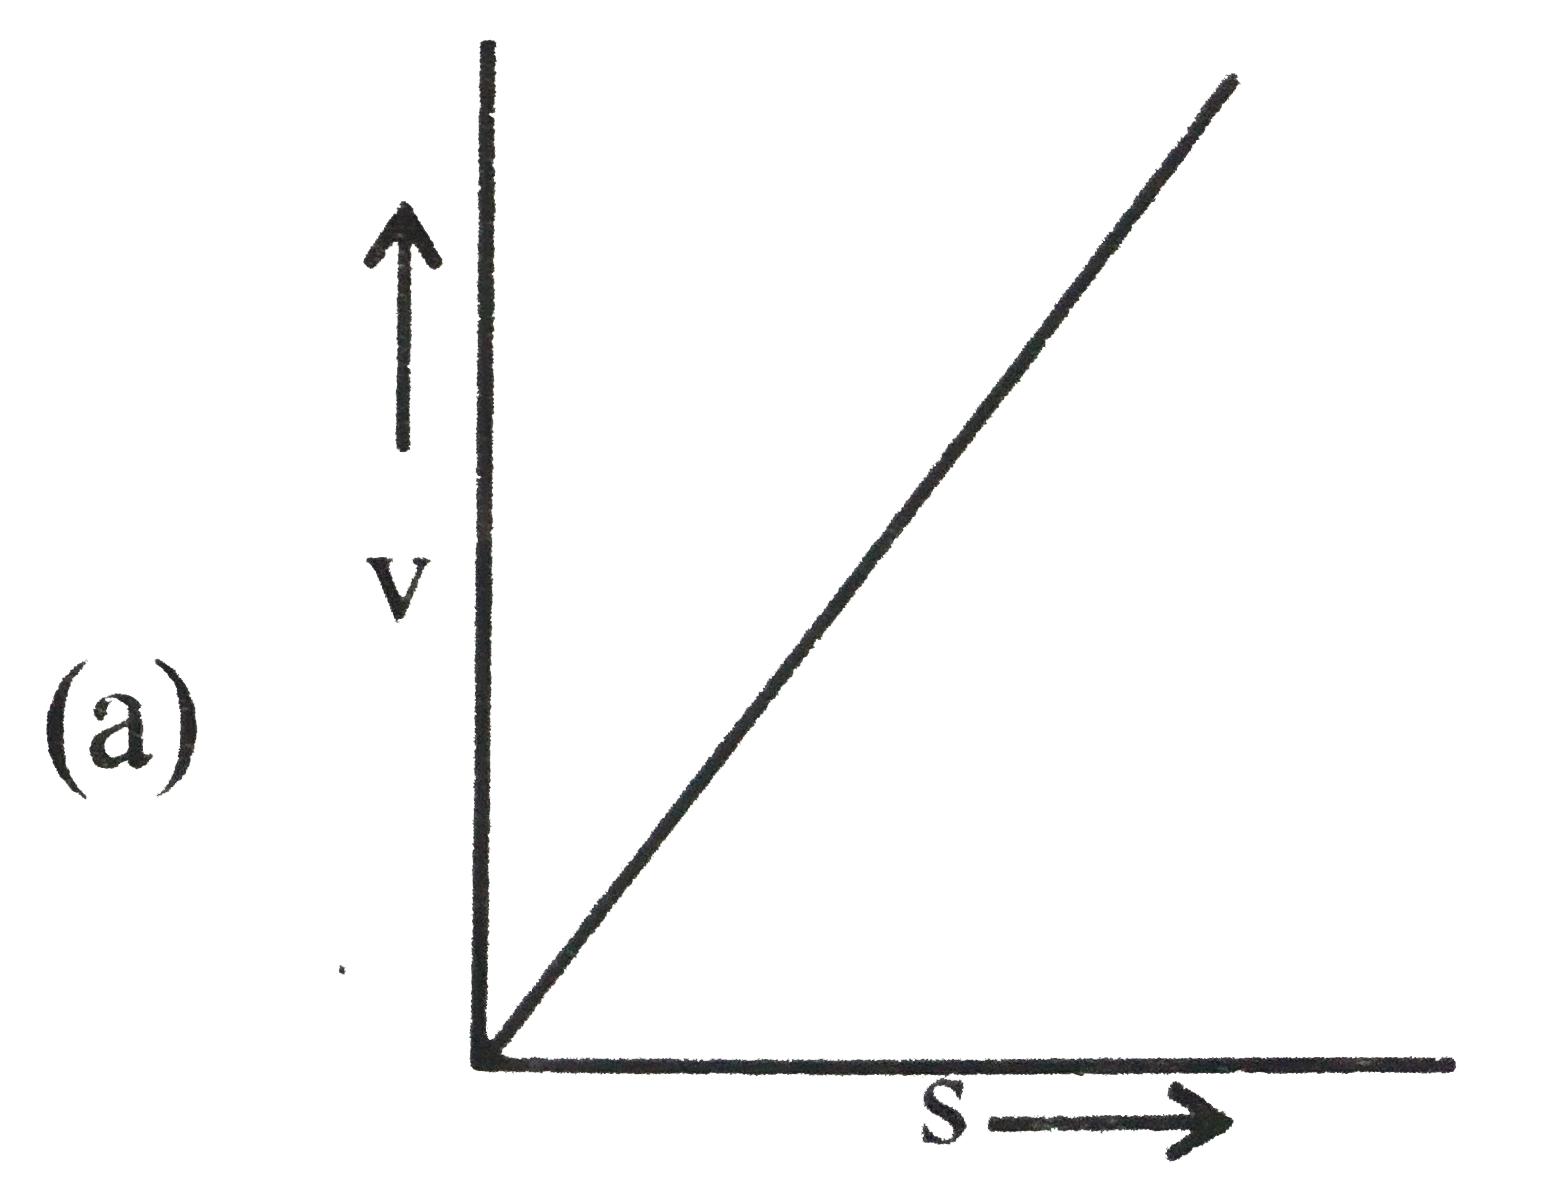 B
B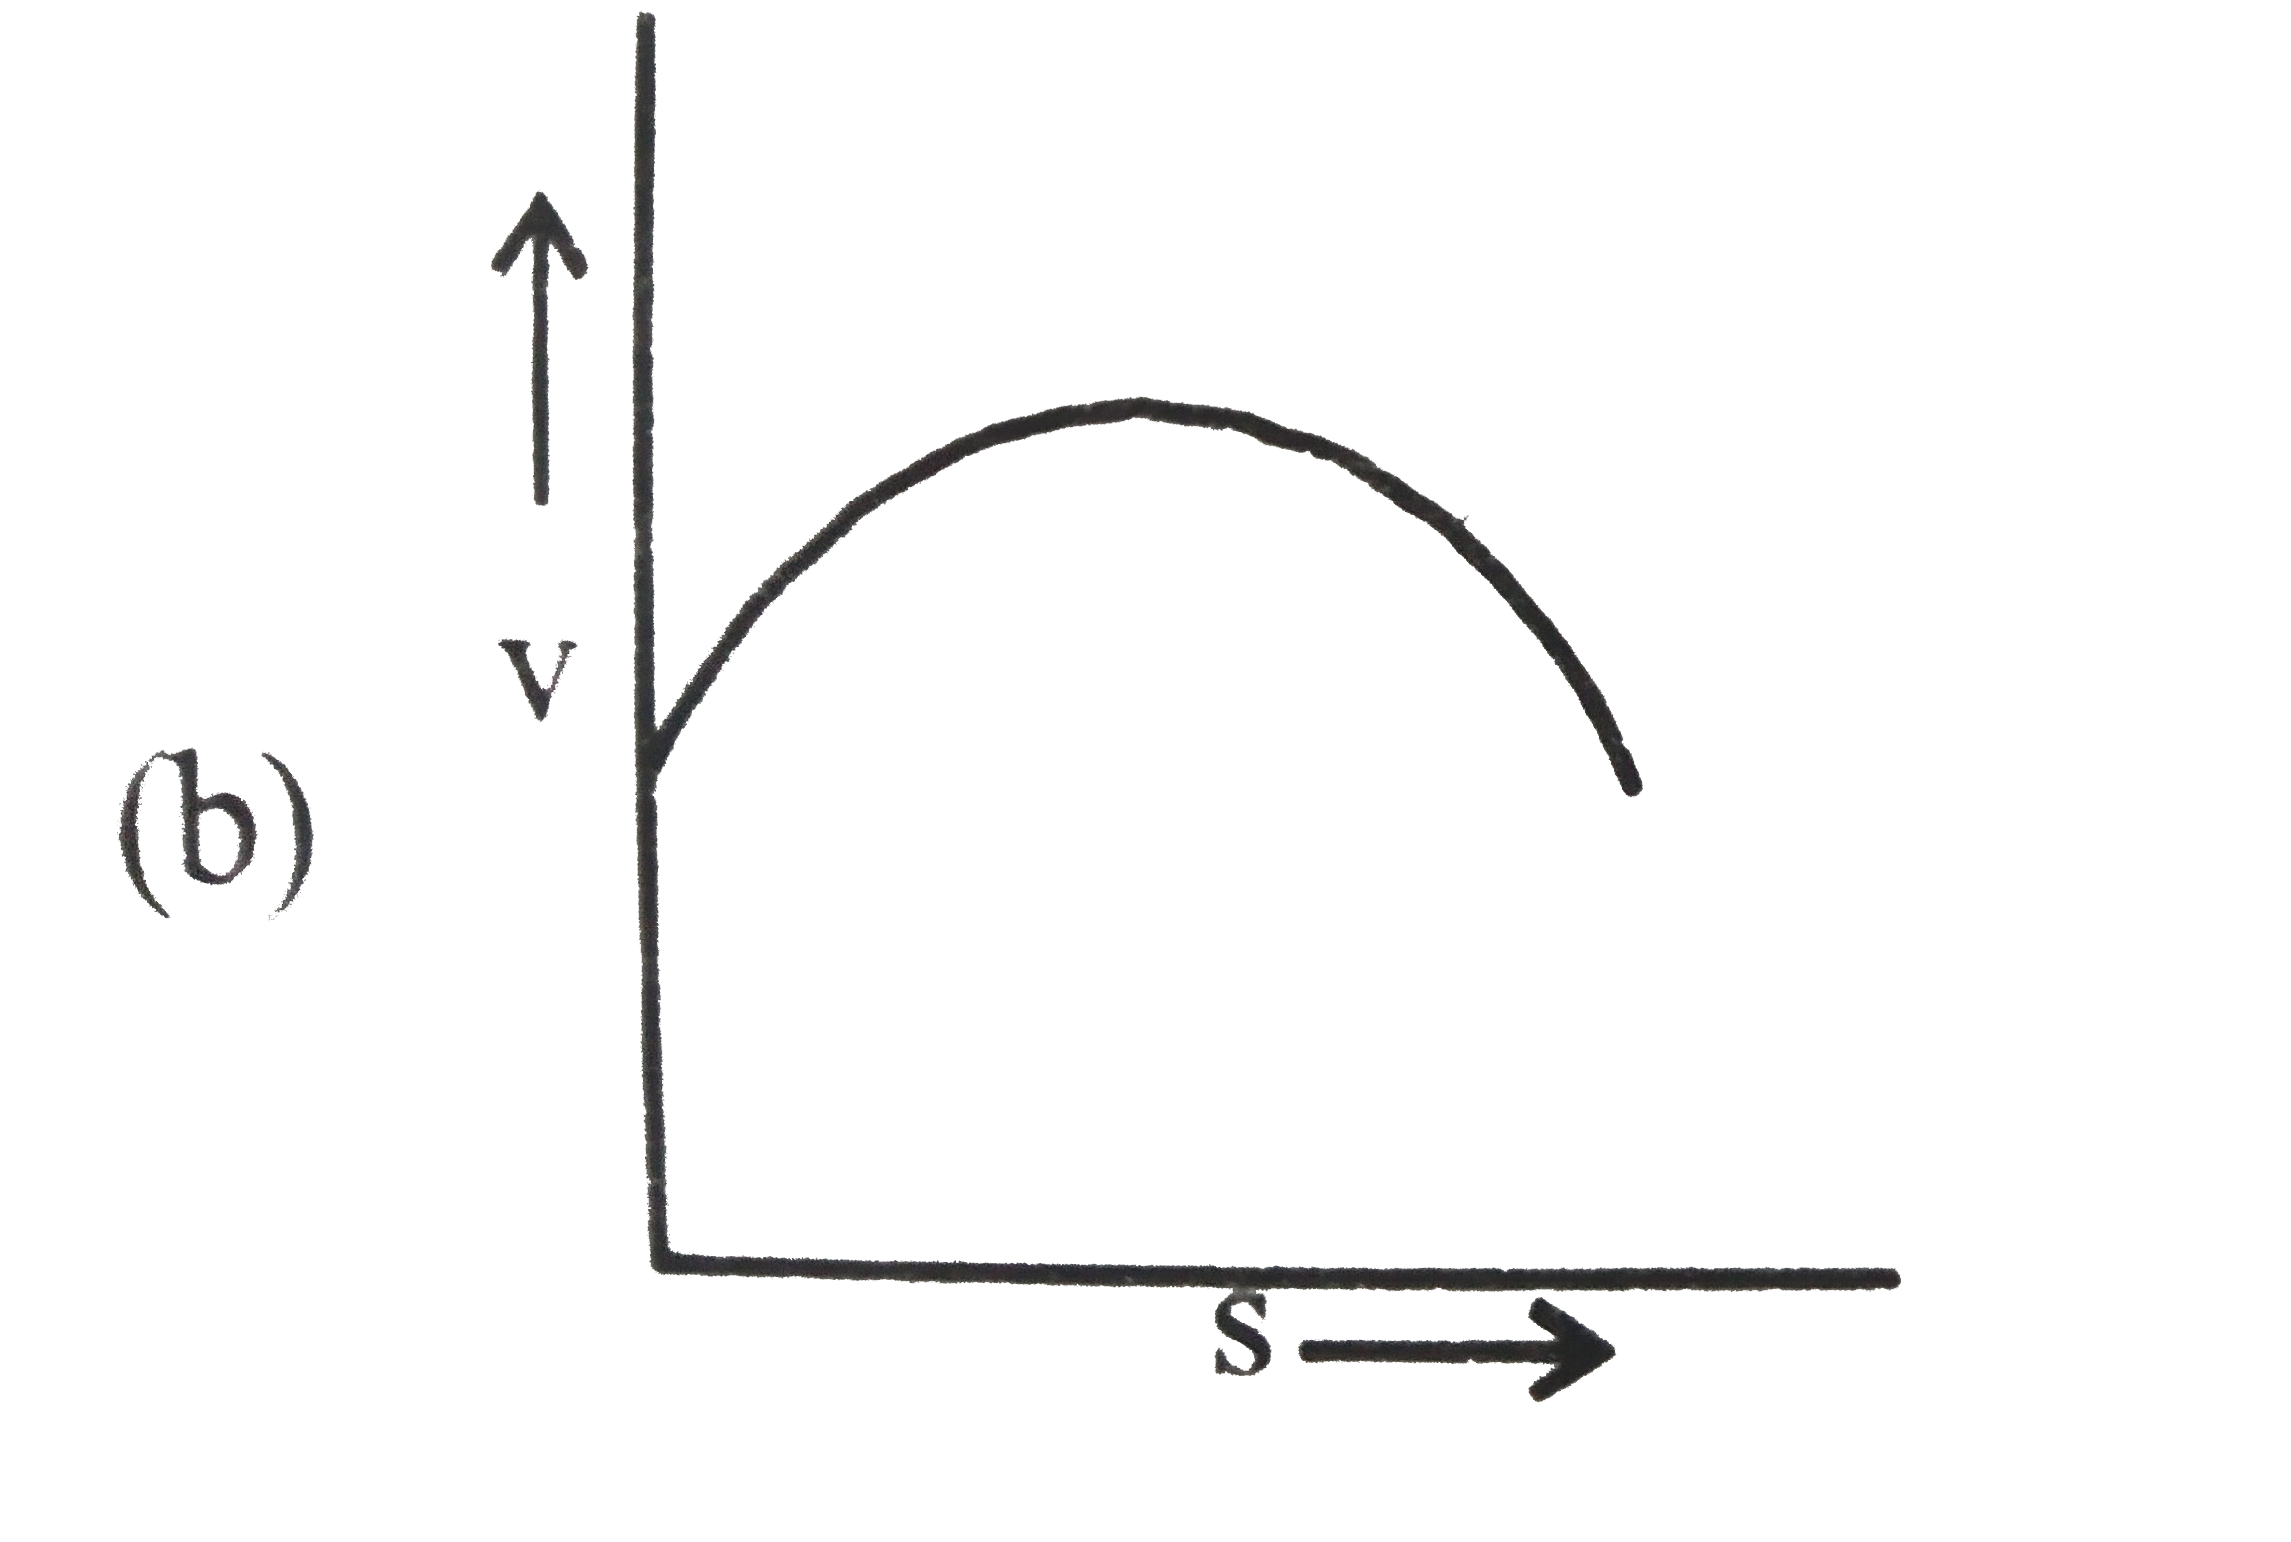 C
C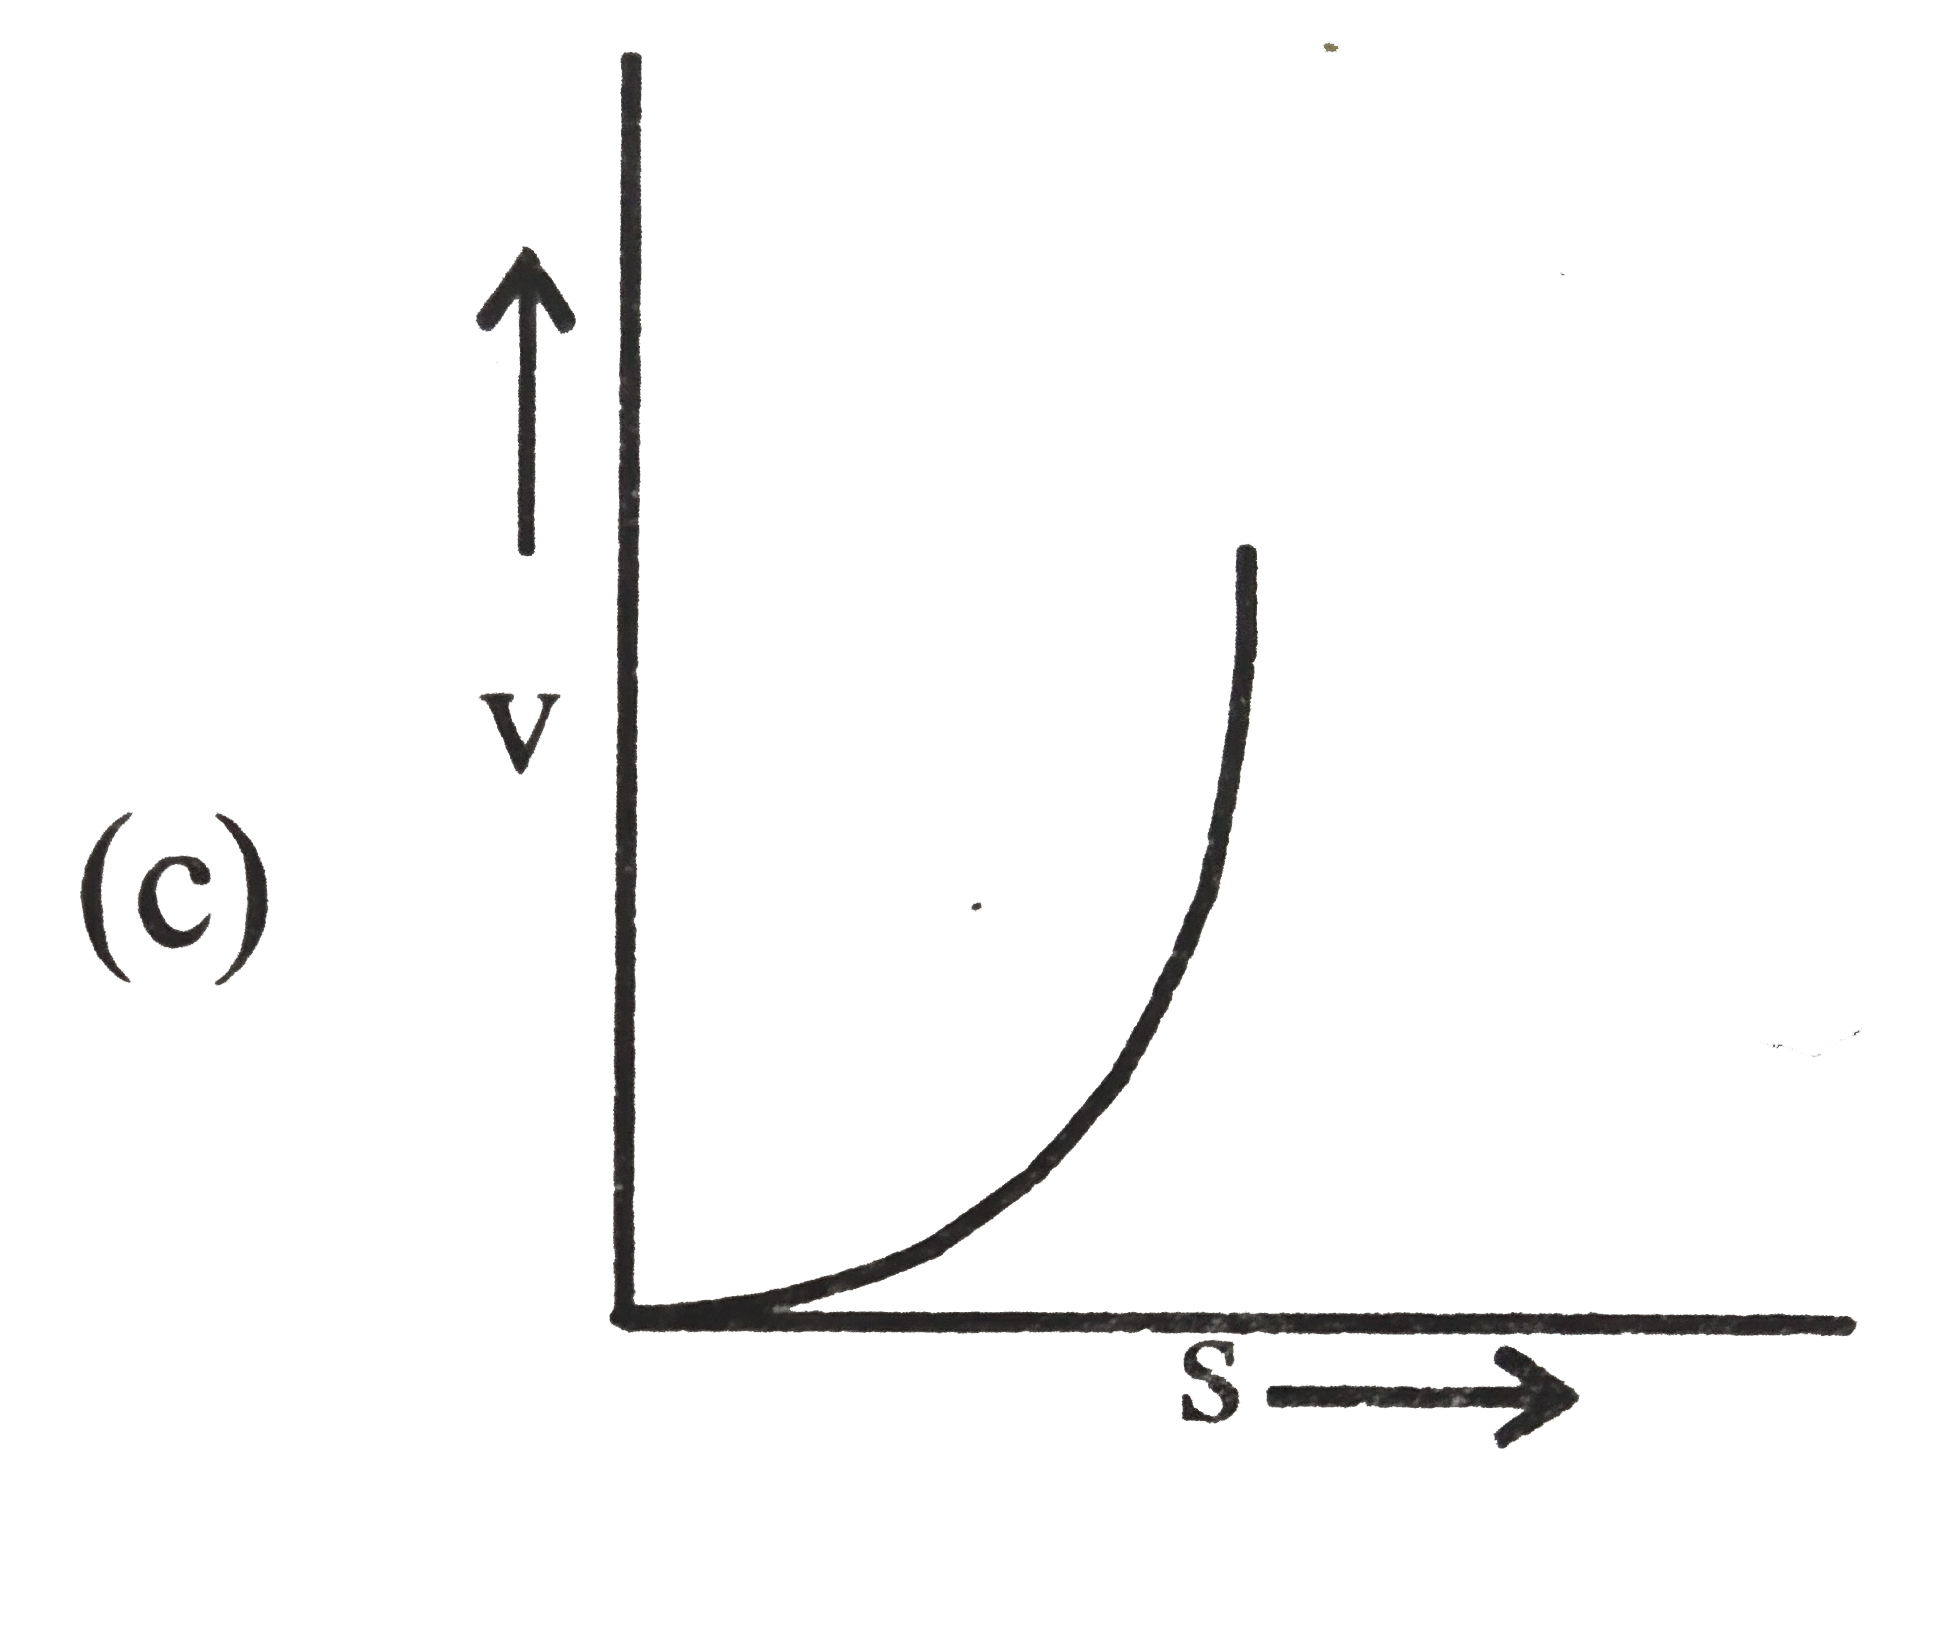 D
D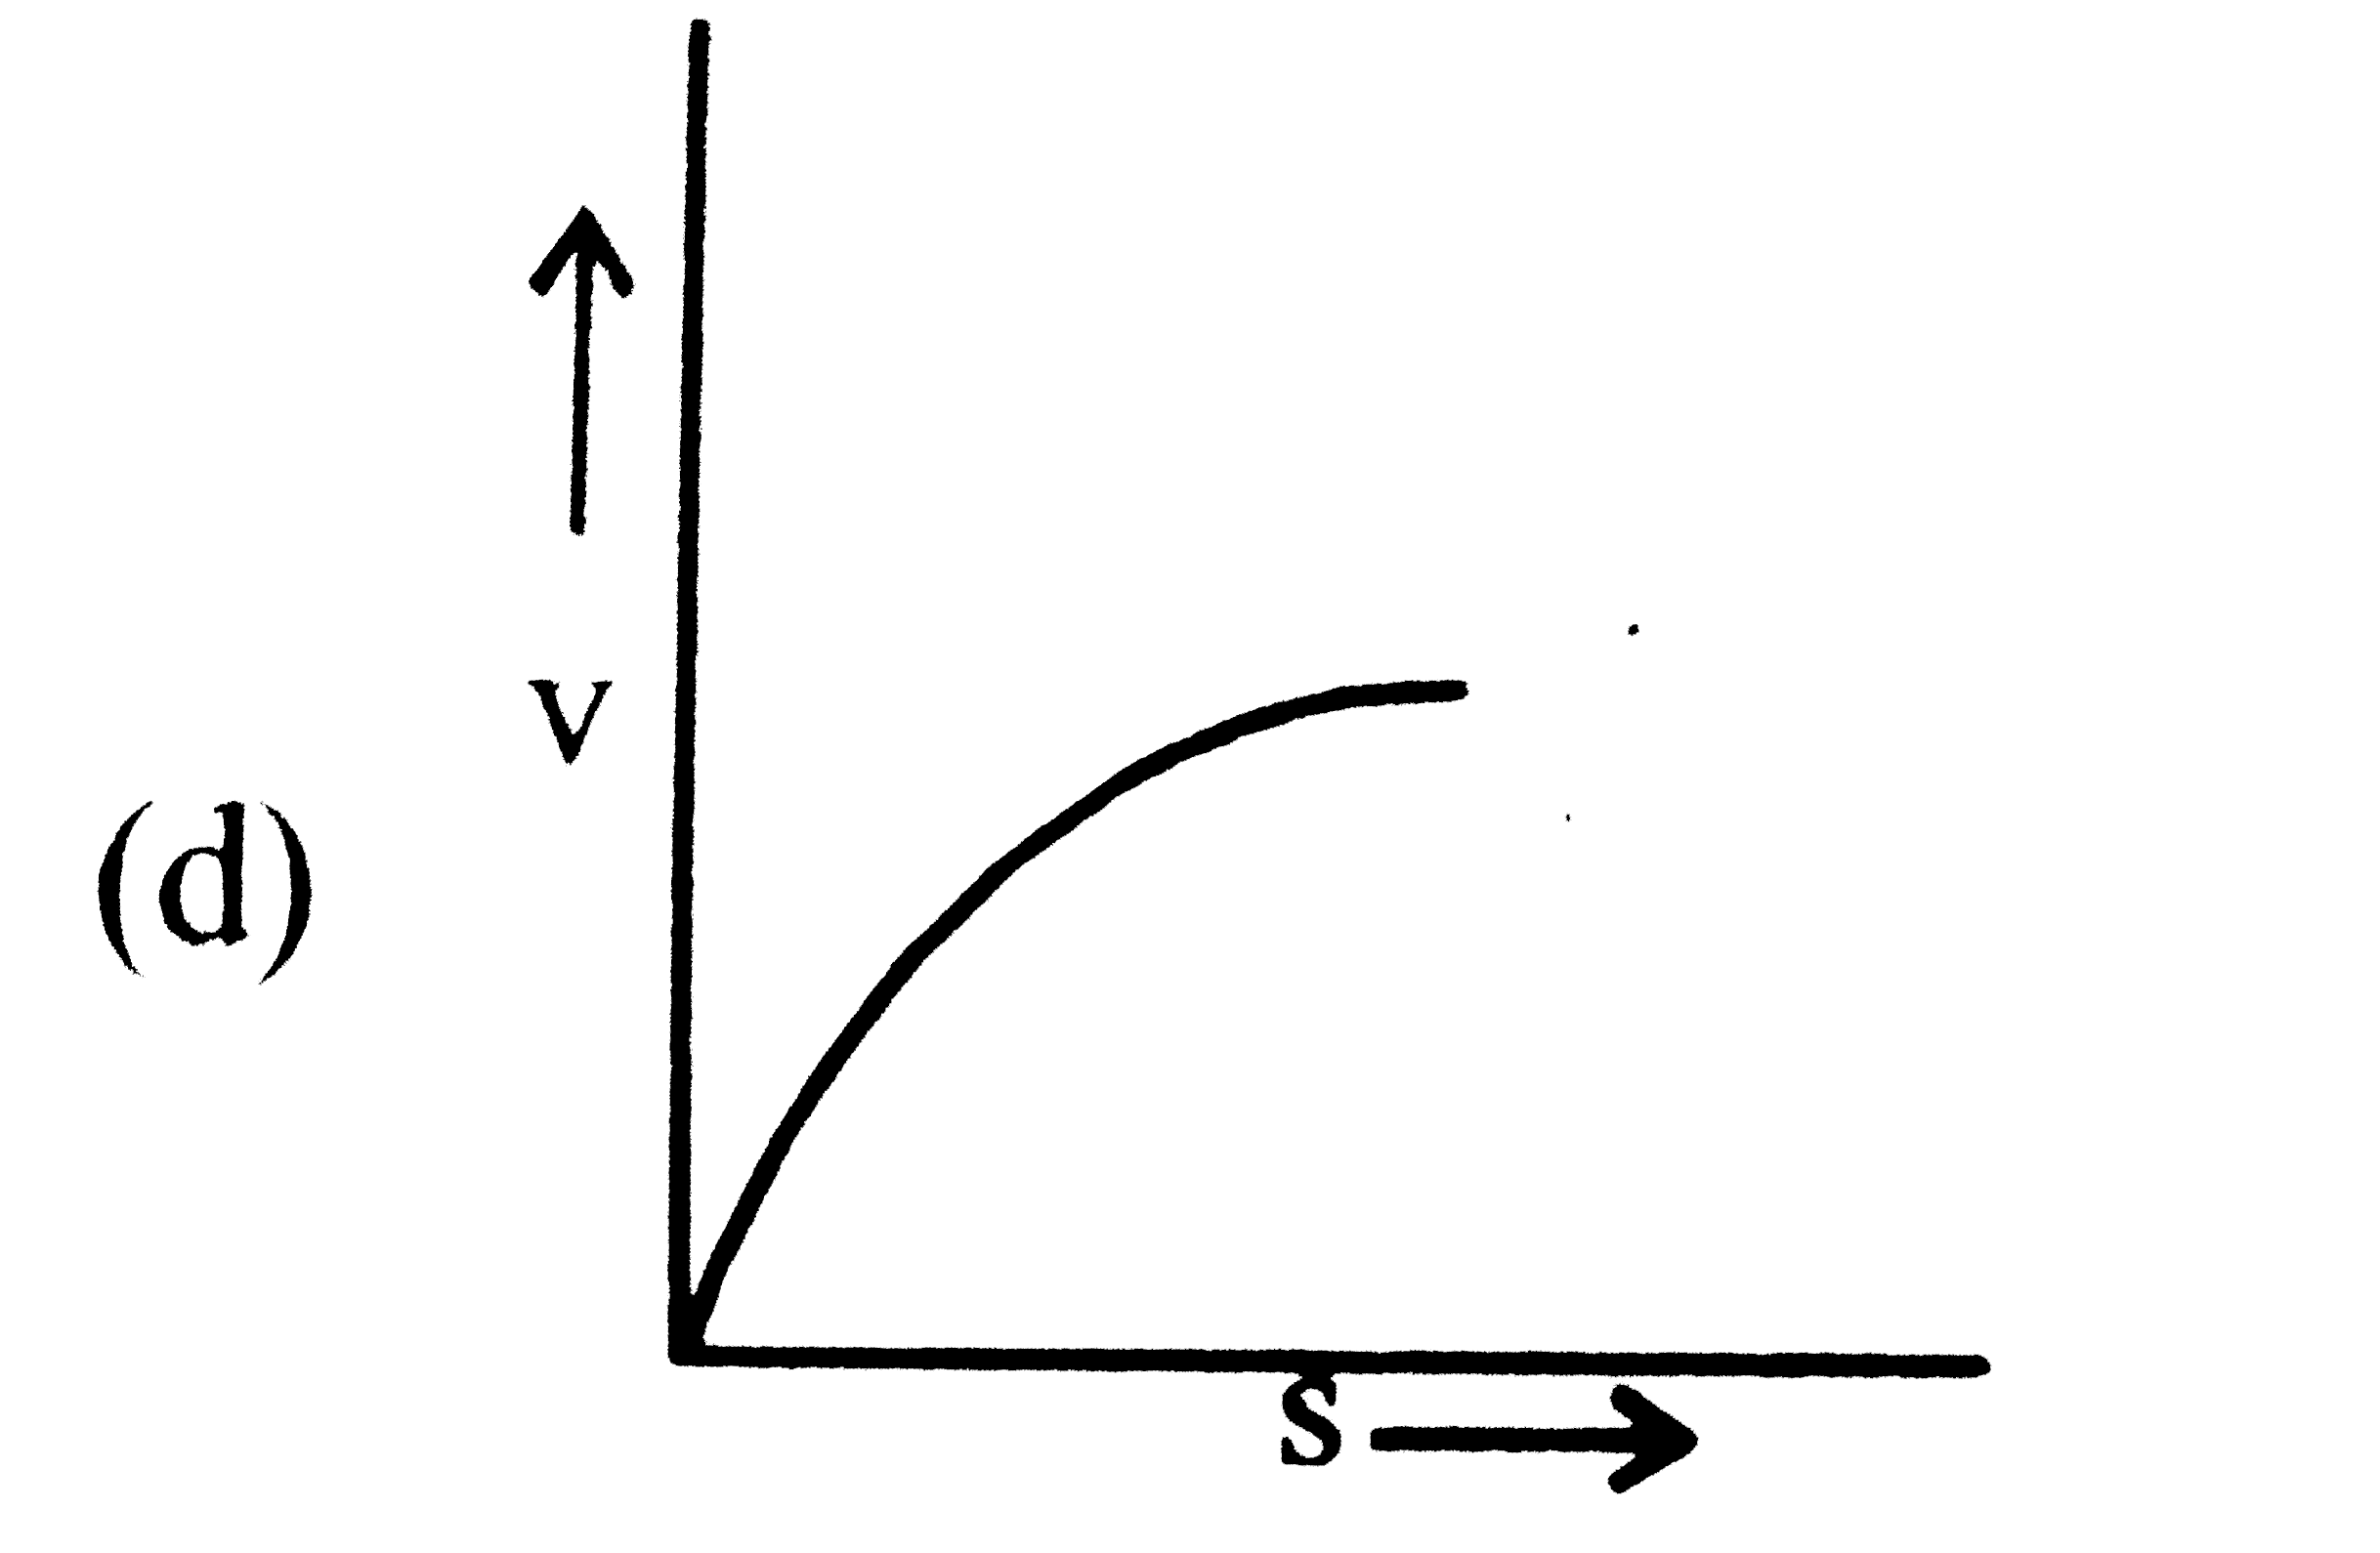
A body is moved in straight line by constant power of machine. What will be the relation between the travelling distance and time?
AS2∝t3BS2∝tCS3∝t2DS∝t3
Ram and Raj travel along a straight line from X to Y with different unifrom speeds. Ram started from X and reaches the place Y in t s. if Raj travels half of the total distance between X and Y in 2t s, determine the ratio of speevds of Ram and Raj.
View SolutionA body travels along a straight line with uniform acceleration a1 for time t1 and with uniform acceleration a2 for time t2 for time t2. What is the average acceleration?
View SolutionA body is moved in straight line by constant power of machine. What will be the relation between the travelling distance and time?
View SolutionA body travelling along a straight line traversed one third of the total distance with a velocity 4m/s. The remaining part of the distance was covered with a velocity 1 m/s for half the time and with velocity 3 m/s for the other half of time. The mean velocity averaged over the whole time of motion is :
View SolutionA body moving along a straight line travels one third of the total distance with a speed of 3.0ms−1. The remaining distance is covered with a speed of 4.0ms−1 for half the time and 5.0ms−1 for the other half of the time. The average speed during the motion is
View Solution
