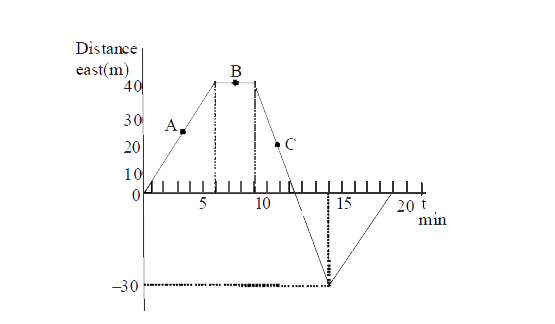
A boy begins to walk eastward along a street in front of his house and the graph of his position from home is shown in the following figure. His average speed for the whole time interval is equal to

8m/min
6m/min
83m/min
2m/min
The correct Answer is:B
vavg=40+0+60+2020 = 6m/min
Topper's Solved these Questions
- BOOK - ERRORLESSCHAPTER - MOTION IN ONE DIMENSIONEXERCISE - NCERT BASED QUESTIONS (RELATIVE MOTION )18videos
MOTION IN ONE DIMENSION
- BOOK - ERRORLESSCHAPTER - MOTION IN ONE DIMENSIONEXERCISE - NCERT BASED QUESTIONS (MOTION UNDER GRAVITY )56videos
MOTION IN ONE DIMENSION
- BOOK - ERRORLESSCHAPTER - MOTION IN ONE DIMENSIONEXERCISE - NCERT BASED QUESTIONS (UNIFORM MOTION )24videos
MOTION IN ONE DIMENSION
- BOOK - ERRORLESSCHAPTER - KINETIC THEORY OF GASES EXERCISE - ASSERTION AND REASON16videos
KINETIC THEORY OF GASES
- BOOK - ERRORLESSCHAPTER - MOTION IN TWO DIMENSIONEXERCISE - ASSERTION & REASON19videos
MOTION IN TWO DIMENSION
Similar Questions
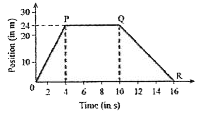
The position versus time graph of the motion of a boy along a straight path is shown in the given figure. The total time for which the boy remains in motion is
 View Solution
Position-time graph for a particle moving along x− direction is as shown in the figure. Average speed of the particle from t=0 to t=4 is :
 View Solution
Knowledge Check
- Question 1 - Select One
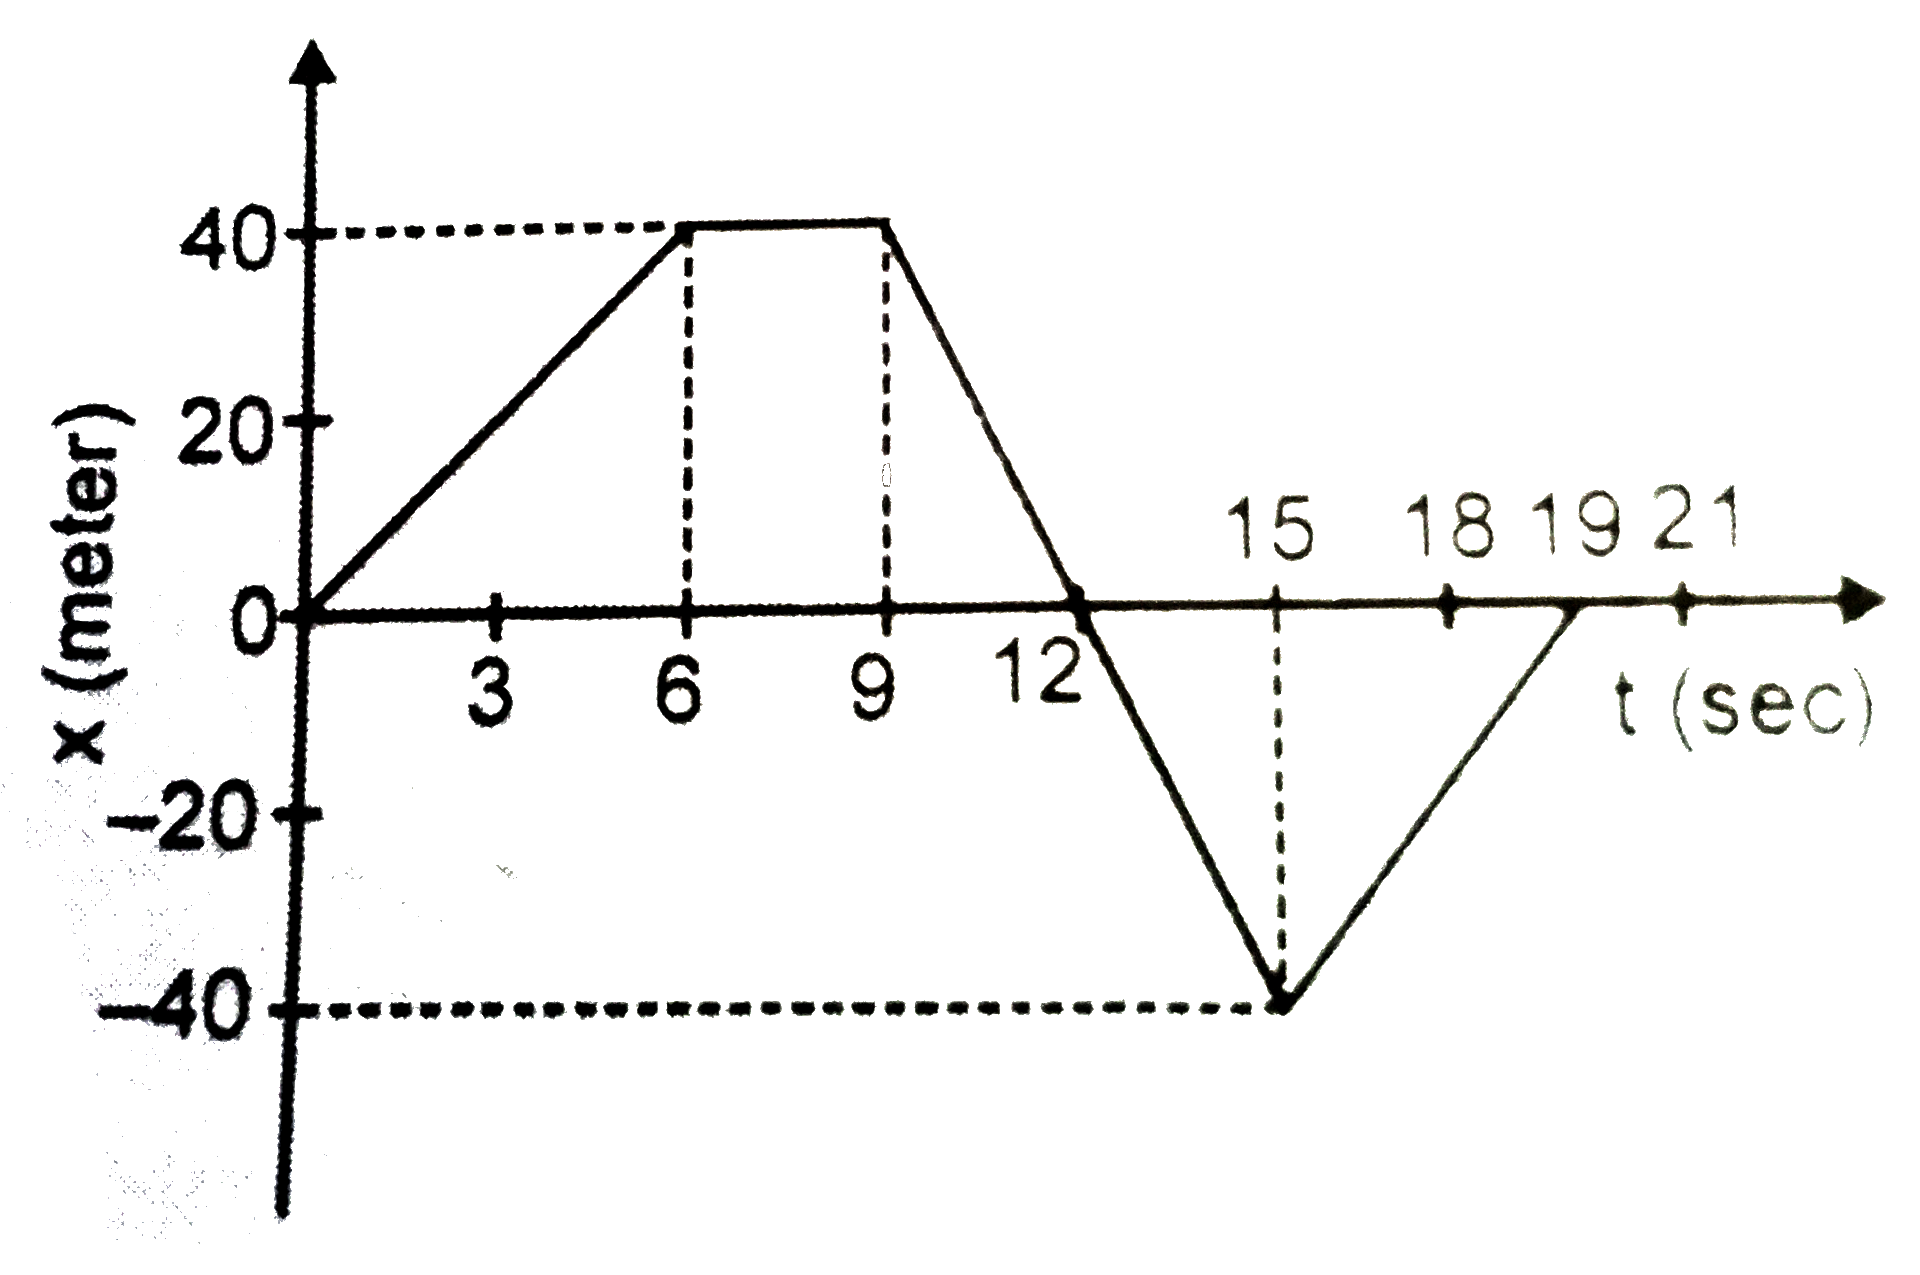
A person walks along an east-west street and a graph of his displacement from home is shown in figure. His average velocity for the whole time interval is:-
 A0ms−1B24ms−1C8.4ms−1DNone of these
 - Question 2 - Select One
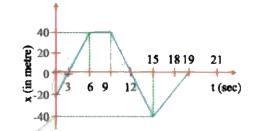
A person walks along an east-west street and a graph of his displacement from home is shown in figure. His average velocity for the whole time interval is :-
 A1.05 ms−1B23 ms−1C8.4 ms−1DNone of above
 - Question 3 - Select One
A girl walks along an east-west street, and a graph of her displacement from home is as shown in figure. Her average velocity for the whole time interval is-
 AZeroB6 m/minC11 m/ minD15 m/min
The position (x) - time (t) graph for a particle moving along a straight line is shown in figure. The average speed of particle in time interval t = 0 to t = 8 s is
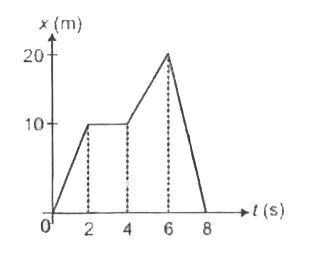 View Solution
Velocity time graph for the motion of a particle along a straight line is as shown in figure.
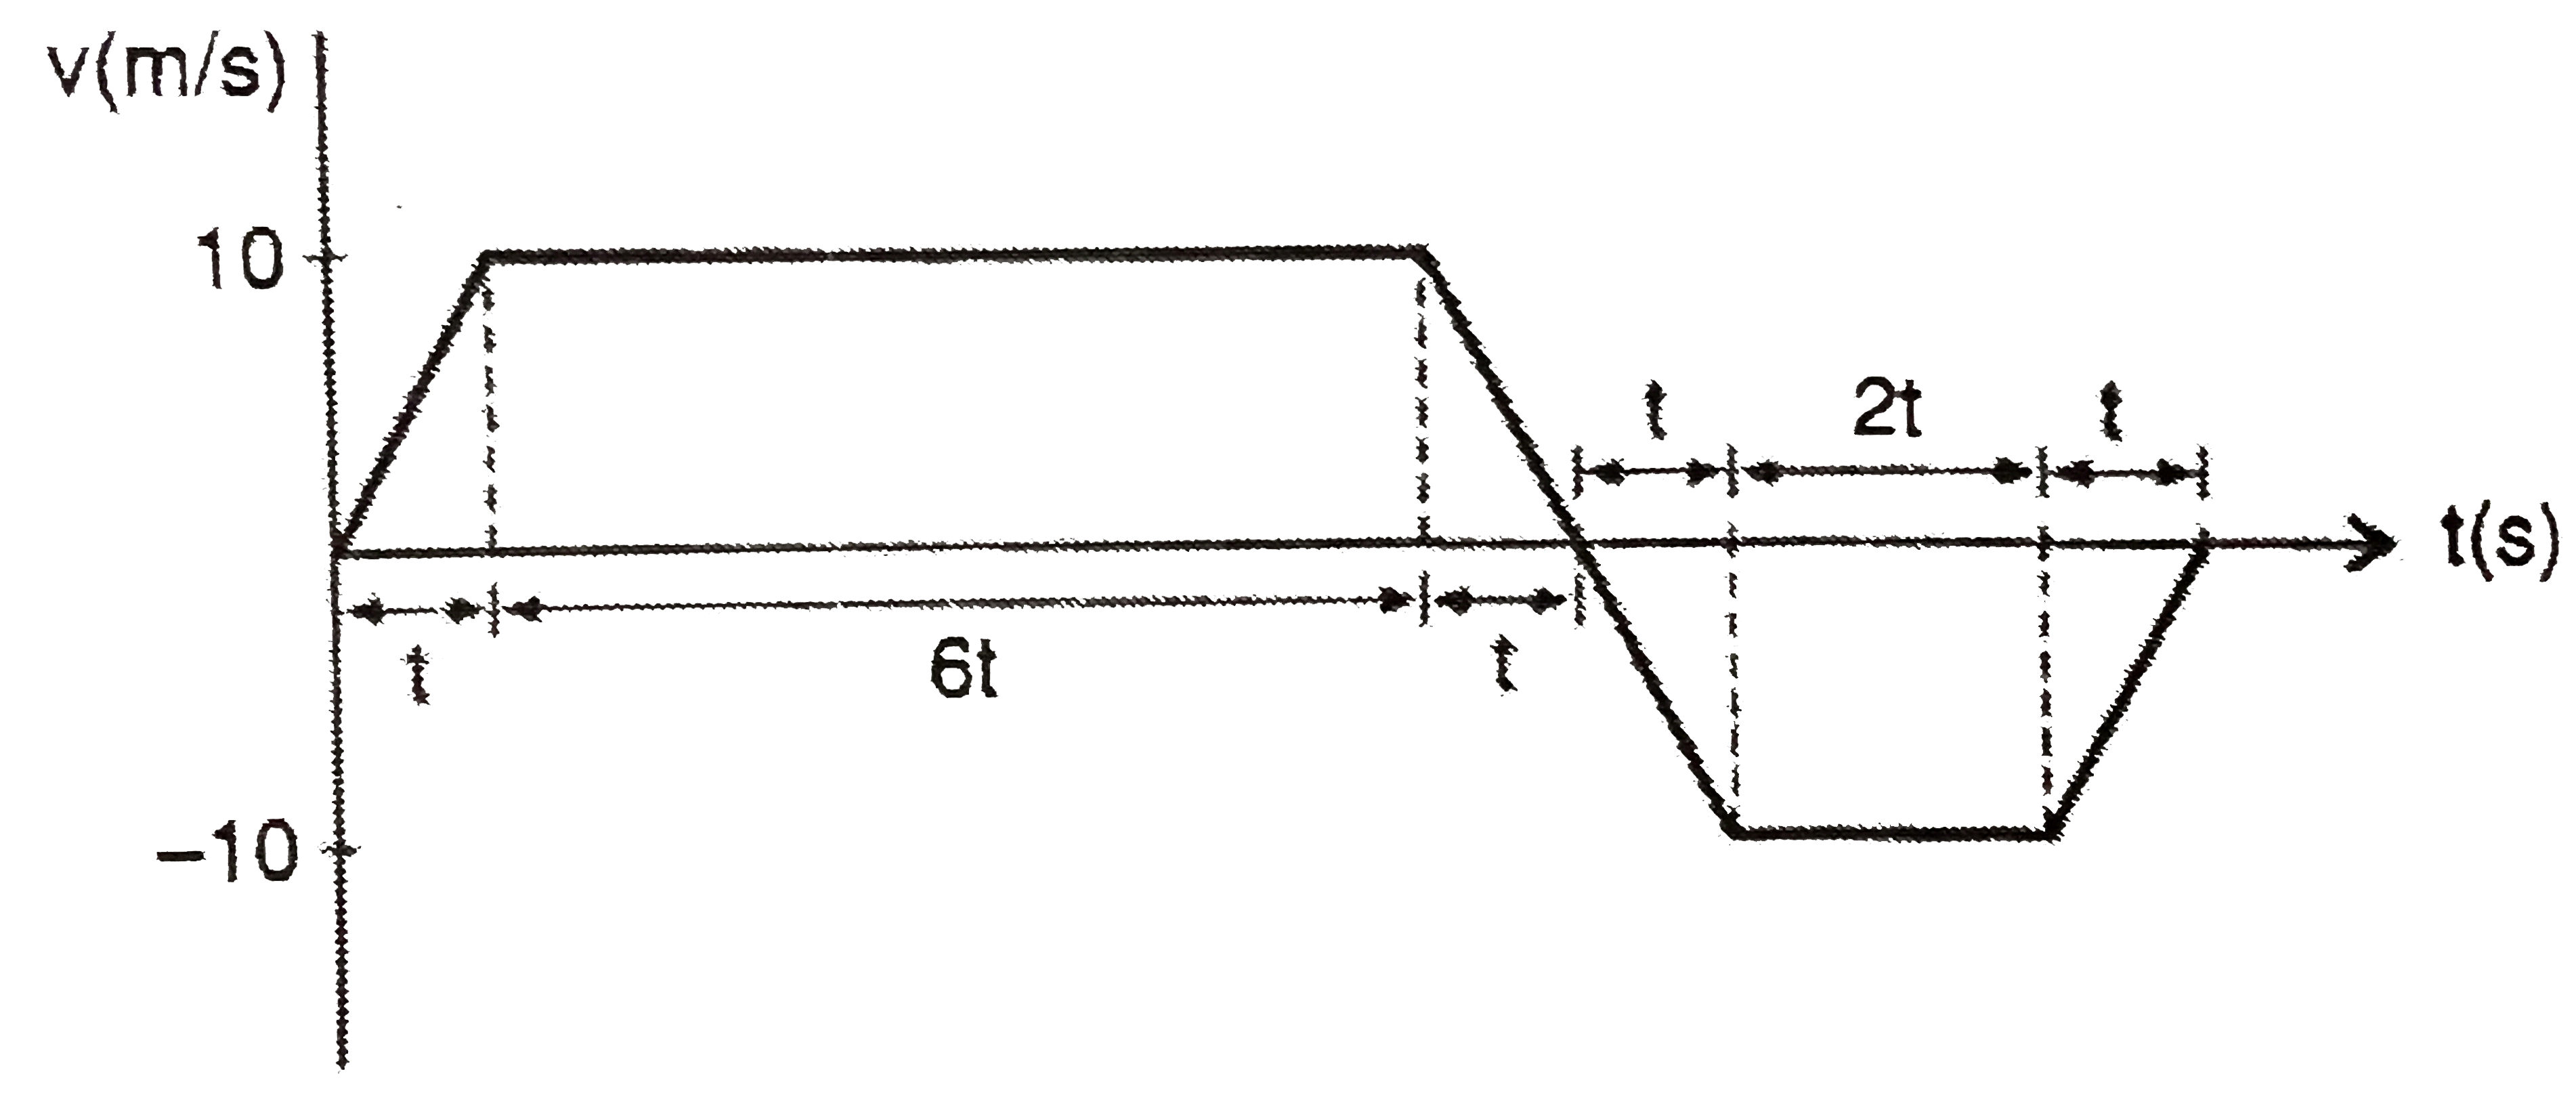
Average speed of the particle for the whole motion is:View SolutionThe velocity time graph of a particle moving along a straight line is shown in the figure. In the time interval from t=0 to t=8 second, answer the following three question.
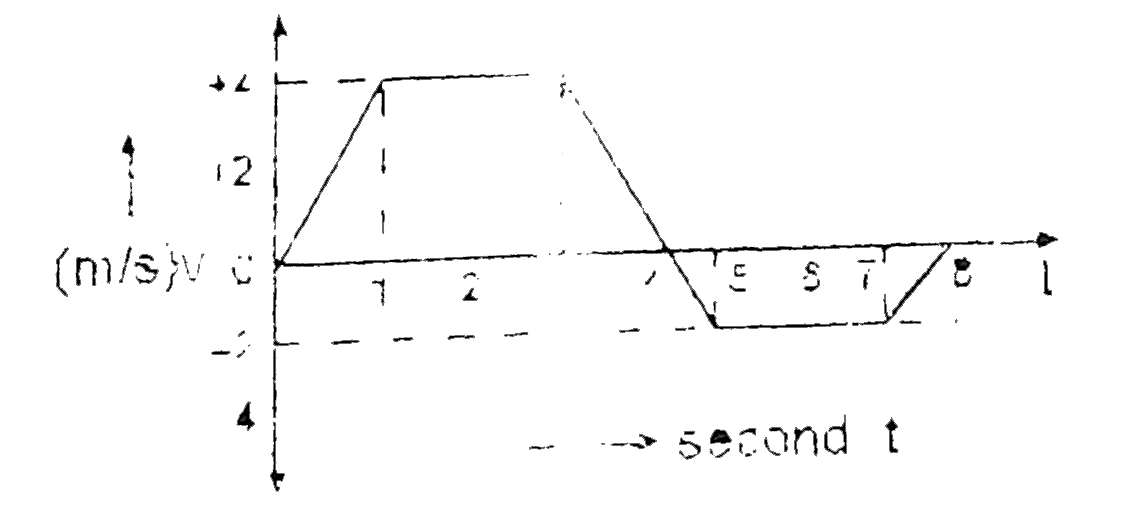
The value of maximum speedaverage speed for the given time interval is :View SolutionA student walks from his house at 6.30 am and reaches his school at 7:15 am. The distance of the school from his house is 6 km. The speed of the student is
View SolutionPosition - time graph for a particle is shown in figure. Starting from t = 0, at what time t, the average velocity is zer?
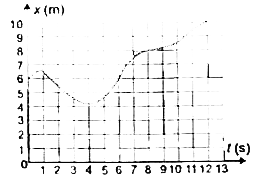 View Solution

