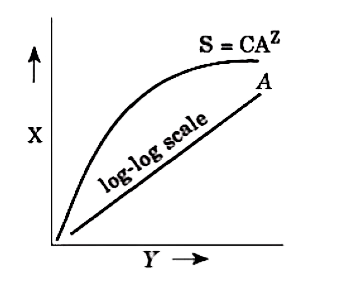
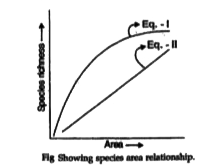
Within a region, species richness increases with increasing explored area but only up to a limit The given graph explains this relationship.

what is the value of the slope of line or regression coefficient Z for frugivorous birds?
0.1-0.2
1.15
0.01-0.1
0.6-1.2
Step by step video & image solution for Within a region, species richness increases with increasing explored area but only up to a limit The given graph explains this relationship. what is the value of the slope of line or regression coefficient Z for frugivorous birds? by Biology experts to help you in doubts & scoring excellent marks in Class 12 exams.
Updated on:21/07/2023Topper's Solved these Questions
Similar Questions
Indicate whether the following statements are true or false :
(i) New York in temperate area has 56 species of birds.
(ii) Tropical biomes unlike temperate ones, are more seasonal, relatively less constant and predictable.
(iii) Relationship between species richness (S) and area (A) turned out to be rectangular hyperboia on a logarithmic scale.
(iv) Slope of regression (Z) is 1.15 for frugivorous birds and mammals in tropical forests of different continents.
View SolutionWhich of the statement are in accordance with the observation of geographer Alexander von Humboldt ?
I. Within a region species, richness increases with increasing explored area but within a limit.
II. The relation between species richness and area is a rectangular hyperbole.
III. The richness of species decreases with the increasing explored area.
IV. There is no relation between the explored area and species richness .
View Solution
Knowledge Check
Who observed that 'within a region, species richess icreased with increasing explored area but only upto a limit'
APaul EhrlichBDavid TilmanCAlexander von HumboldtDEdward WilsonWho observed that 'within a region, species richess icreased with increasing explored area but only upto a limit'
AEdward WilsonBAlexandor Von HumboldtCRobert contanzaDE. HackelThe great German naturalist and geographer Alexander von Humboldt observed that within a region species richness increased with increasing explored area, but only up to a limit. In fact, relation between species richness and area for a wide variety of taxa (angiosperm plants, birds, bats, freshwater fi ishes) turns out to be a rectangular hyperbola. Now find out correct equations shown in the graph.
 AI - S−CAZ II -LogS=logC+ZlogABI - LogS=logC+ZlogA, II - S−CAZCI - S−CAZ+logC, II - LogS=logC+ZlogADI - S−CAZ+logA, II - LogS=logC+ZlogA
Alexander von Humboldt is associated with
(a.) species - area relationship
(b.) log S = log C + z logA
(C.) Within a region , species richness increases with the increasing limited explored area.
(d.) Increased diversity contributes to higher productivity.
(e.) Species diversity increases with the loss of keystone species.
View SolutionThe relation between specises richness and area is described on a logarithmic scale by the equation [where S = species richness, A = area, Z = slope of the line (regression coefficient ), C= Y - intercept]
View SolutionFor frugivorous birds and mammals in the tropical forests of different continents, Z (slope of the line / regression coefficient) is found to be
View SolutionAssertion : If the species-area relationship are analysed among very large areas like the entire continents, the value of Z, i.e., slope of line in the range of 0.1 to 0.2.
Reason : The value of Z, i.e., slope of line of species area relationship lies in the range of 0.6 to 1.2 when analysis is done among small areas.
View SolutionA simple pendulum made of bob of mass m and a metallic wire of negligible mass has time period 2s at T=0∘C. If the temperature of the wire is increased and the corresponding change in its time period is plotted against its temperature, the resulting graph is a line of slope S. If the coefficient of linear expansion of metal is α then value of S is :
View Solution
