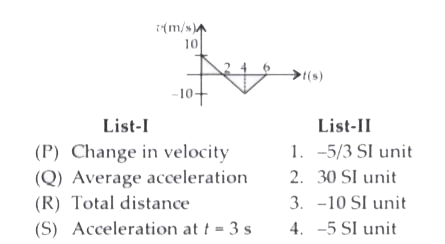
For the velocity-time graph shown in figure, in a time interval from t=0 to t=6 s, match the following
P-1,Q-2,R-3,S-4
P-3,Q-1,R-2,S-4
P-2,Q-3,R-4,S-1
P-3,Q-4,R-2,S-1
The correct Answer is:b
P-3,Q-1,R-2,S-4
vi=+10m/sandvf=0
∴Δv=vf−vi=−10m/s
aav=ΔvΔt=−106=−53m/s2
Total displacement=area under v-t graph (with sign) and acceleration=slope of v-t graph.
Topper's Solved these Questions
- BOOK - MTG IIT JEE FOUNDATIONCHAPTER - MOTIONEXERCISE - Exercise (Assertion & Reason Type)10videos
MOTION
- BOOK - MTG IIT JEE FOUNDATIONCHAPTER - MOTIONEXERCISE - Exercise (Comprehension Type)5videos
MOTION
- BOOK - MTG IIT JEE FOUNDATIONCHAPTER - MOTIONEXERCISE - Exercise (MCQ.s) Level-220videos
MOTION
- BOOK - MTG IIT JEE FOUNDATIONCHAPTER - GRAVITATION EXERCISE - Olympiad/HOTS Corner20videos
GRAVITATION
- BOOK - MTG IIT JEE FOUNDATIONCHAPTER - SOUNDEXERCISE - Olympiad/HOTS Corner15videos
SOUND
Similar Questions
The velocity time graph of a particle moving along a straight line is shown in the figure. In the time interval from t=0 to t=8 second, answer the following three question.
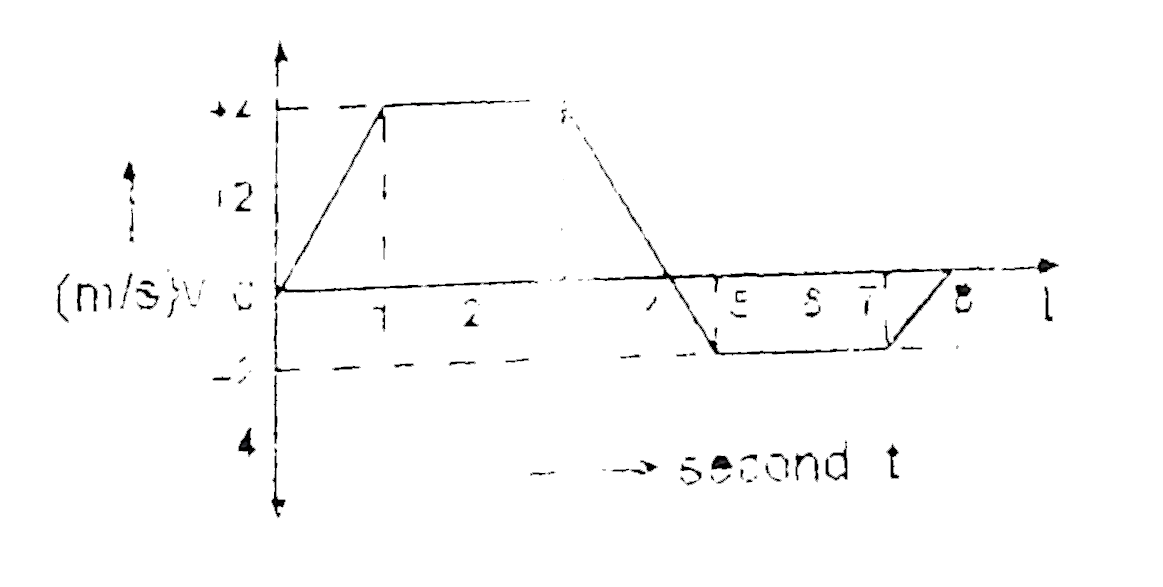
The distance travelled by the particle is :View SolutionThe velocity time graph of a particle moving along a straight line is shown in the figure. In the time interval from t=0 to t=8 second, answer the following three question.
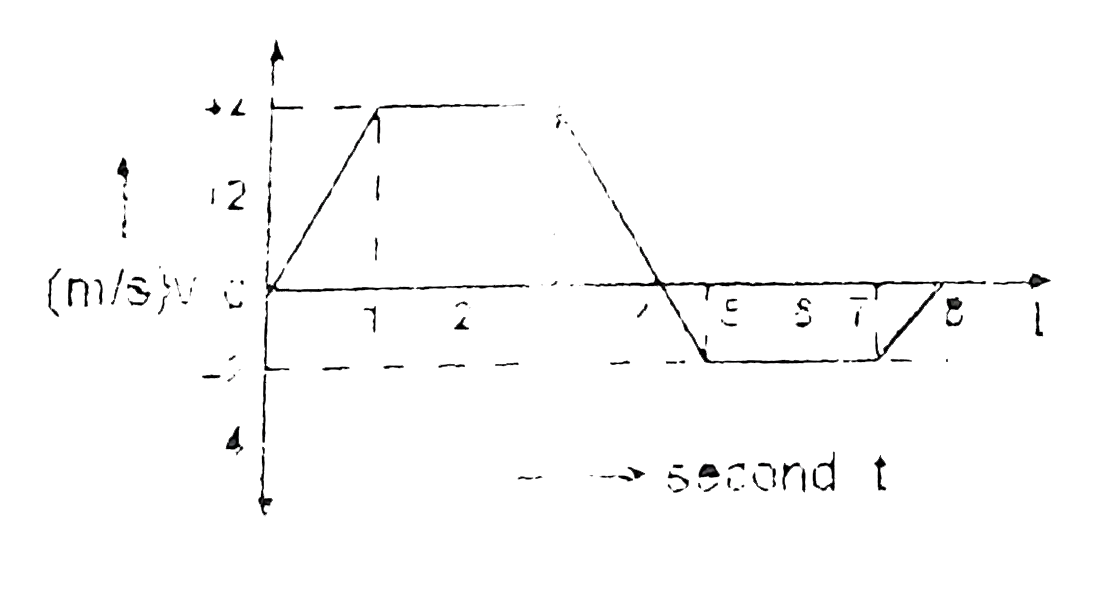
The value of magnitude of maximum velocitymagnitude of average velocity for the given time interval is :View Solution
Knowledge Check
- Question 1 - Select One
The velocity time graph of a particle moving along a straight line is shown in the figure. In the time interval from t=0 to t=8 second, answer the following three question.

The distance travelled by the particle is :A18 mB6 mC8 mDnone of these - Question 2 - Select One
The velocity time graph of a particle moving along a straight line is shown in the figure. In the time interval from t=0 to t=8 second, answer the following three question.

The value of magnitude of maximum velocitymagnitude of average velocity for the given time interval is :A89B83C169D163 - Question 3 - Select One
The velocity time graph of a particle moving along a straight line is shown in the figure. In the time interval from t=0 to t=8 second, answer the following three question.
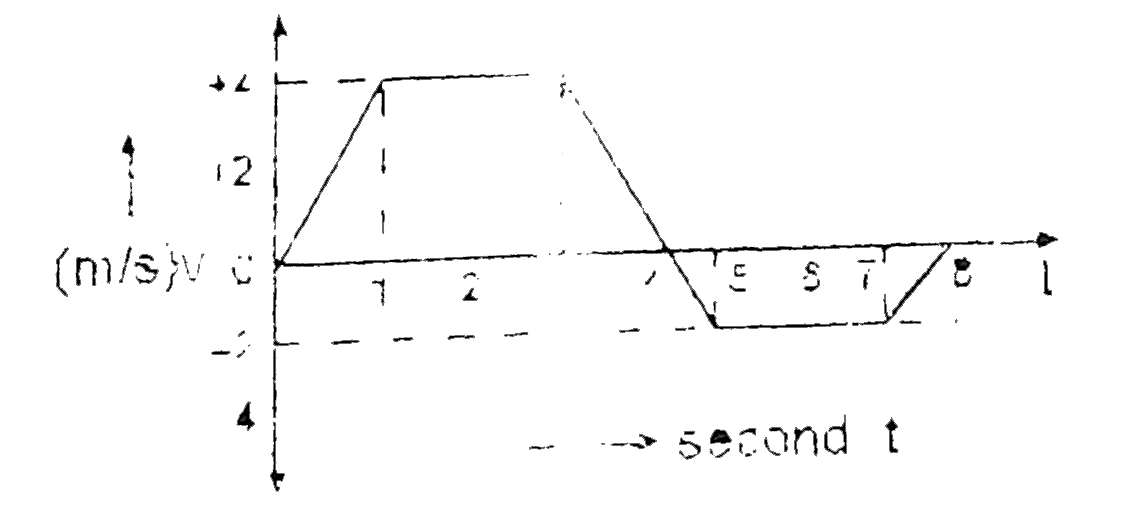
The value of maximum speedaverage speed for the given time interval is :A89B83C169D163
The velocity time graph of a particle moving along a straight line is shown in the figure. In the time interval from t=0 to t=8 second, answer the following three question.

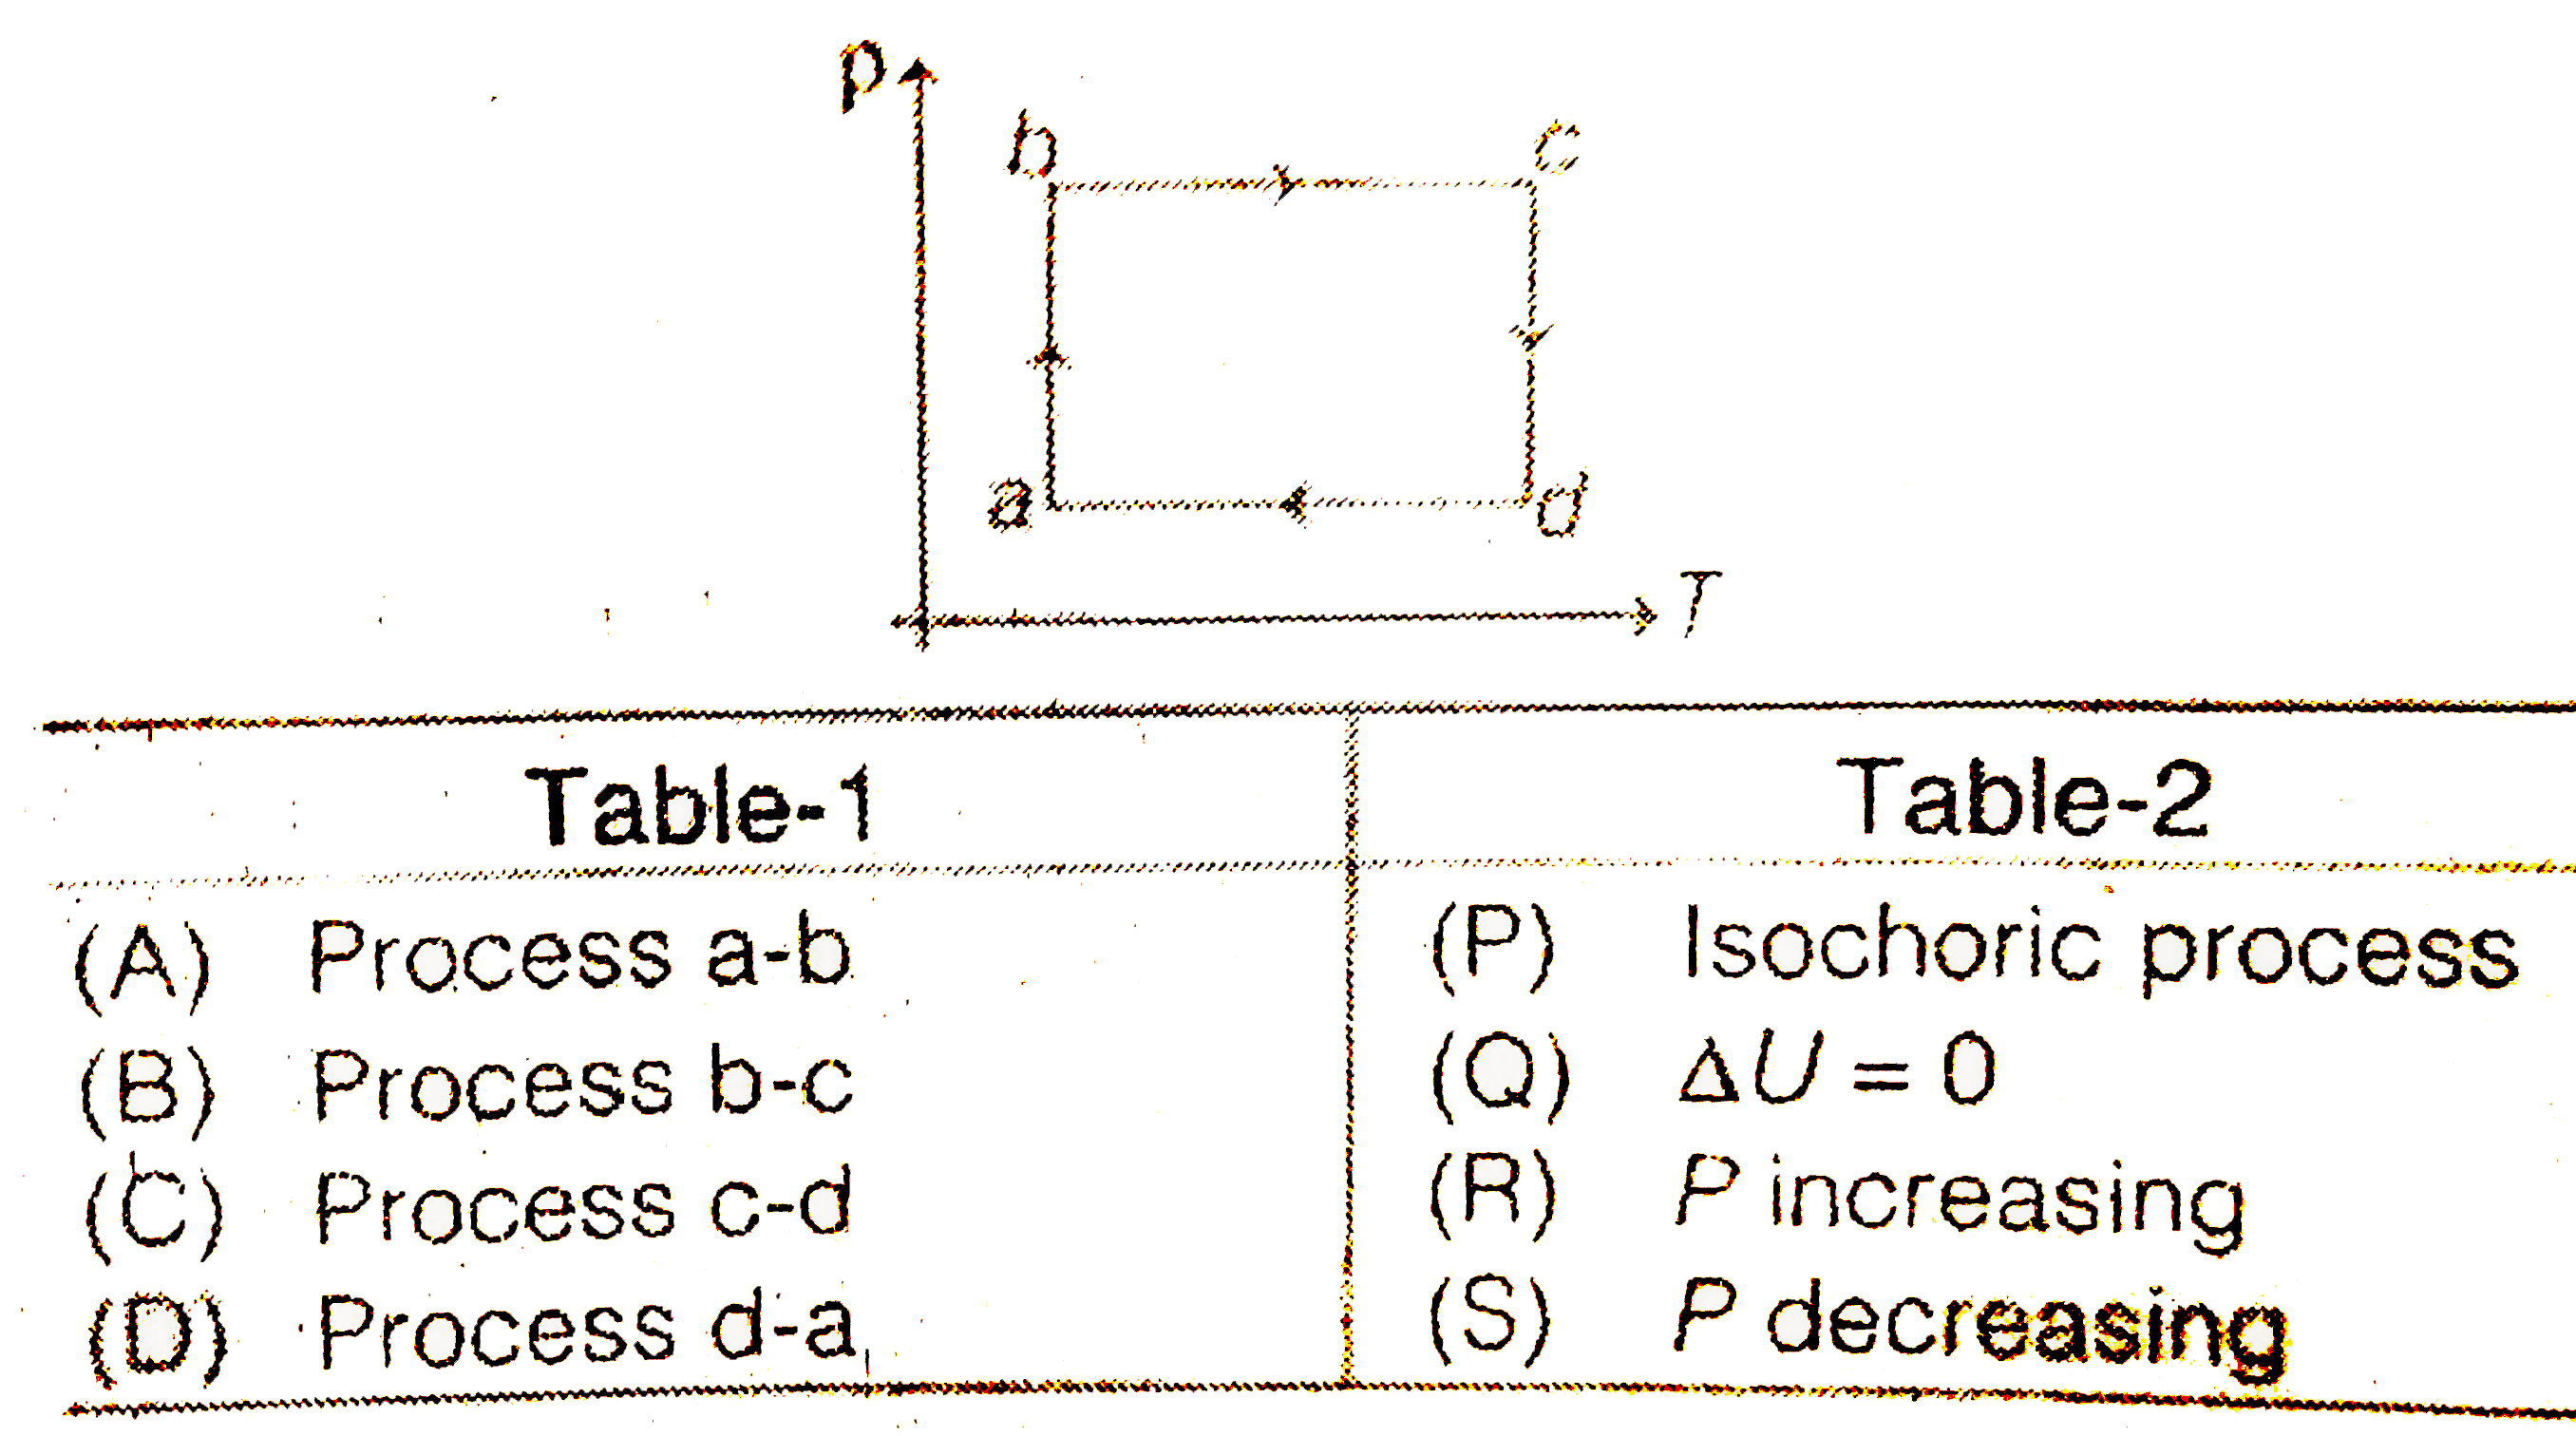
The value of maximum speedaverage speed for the given time interval is :View SolutionIn the ρ-T graph shown in figure, match the following.
 View Solution
In the ρ-T graph shown in figure, match the following.
 View Solution
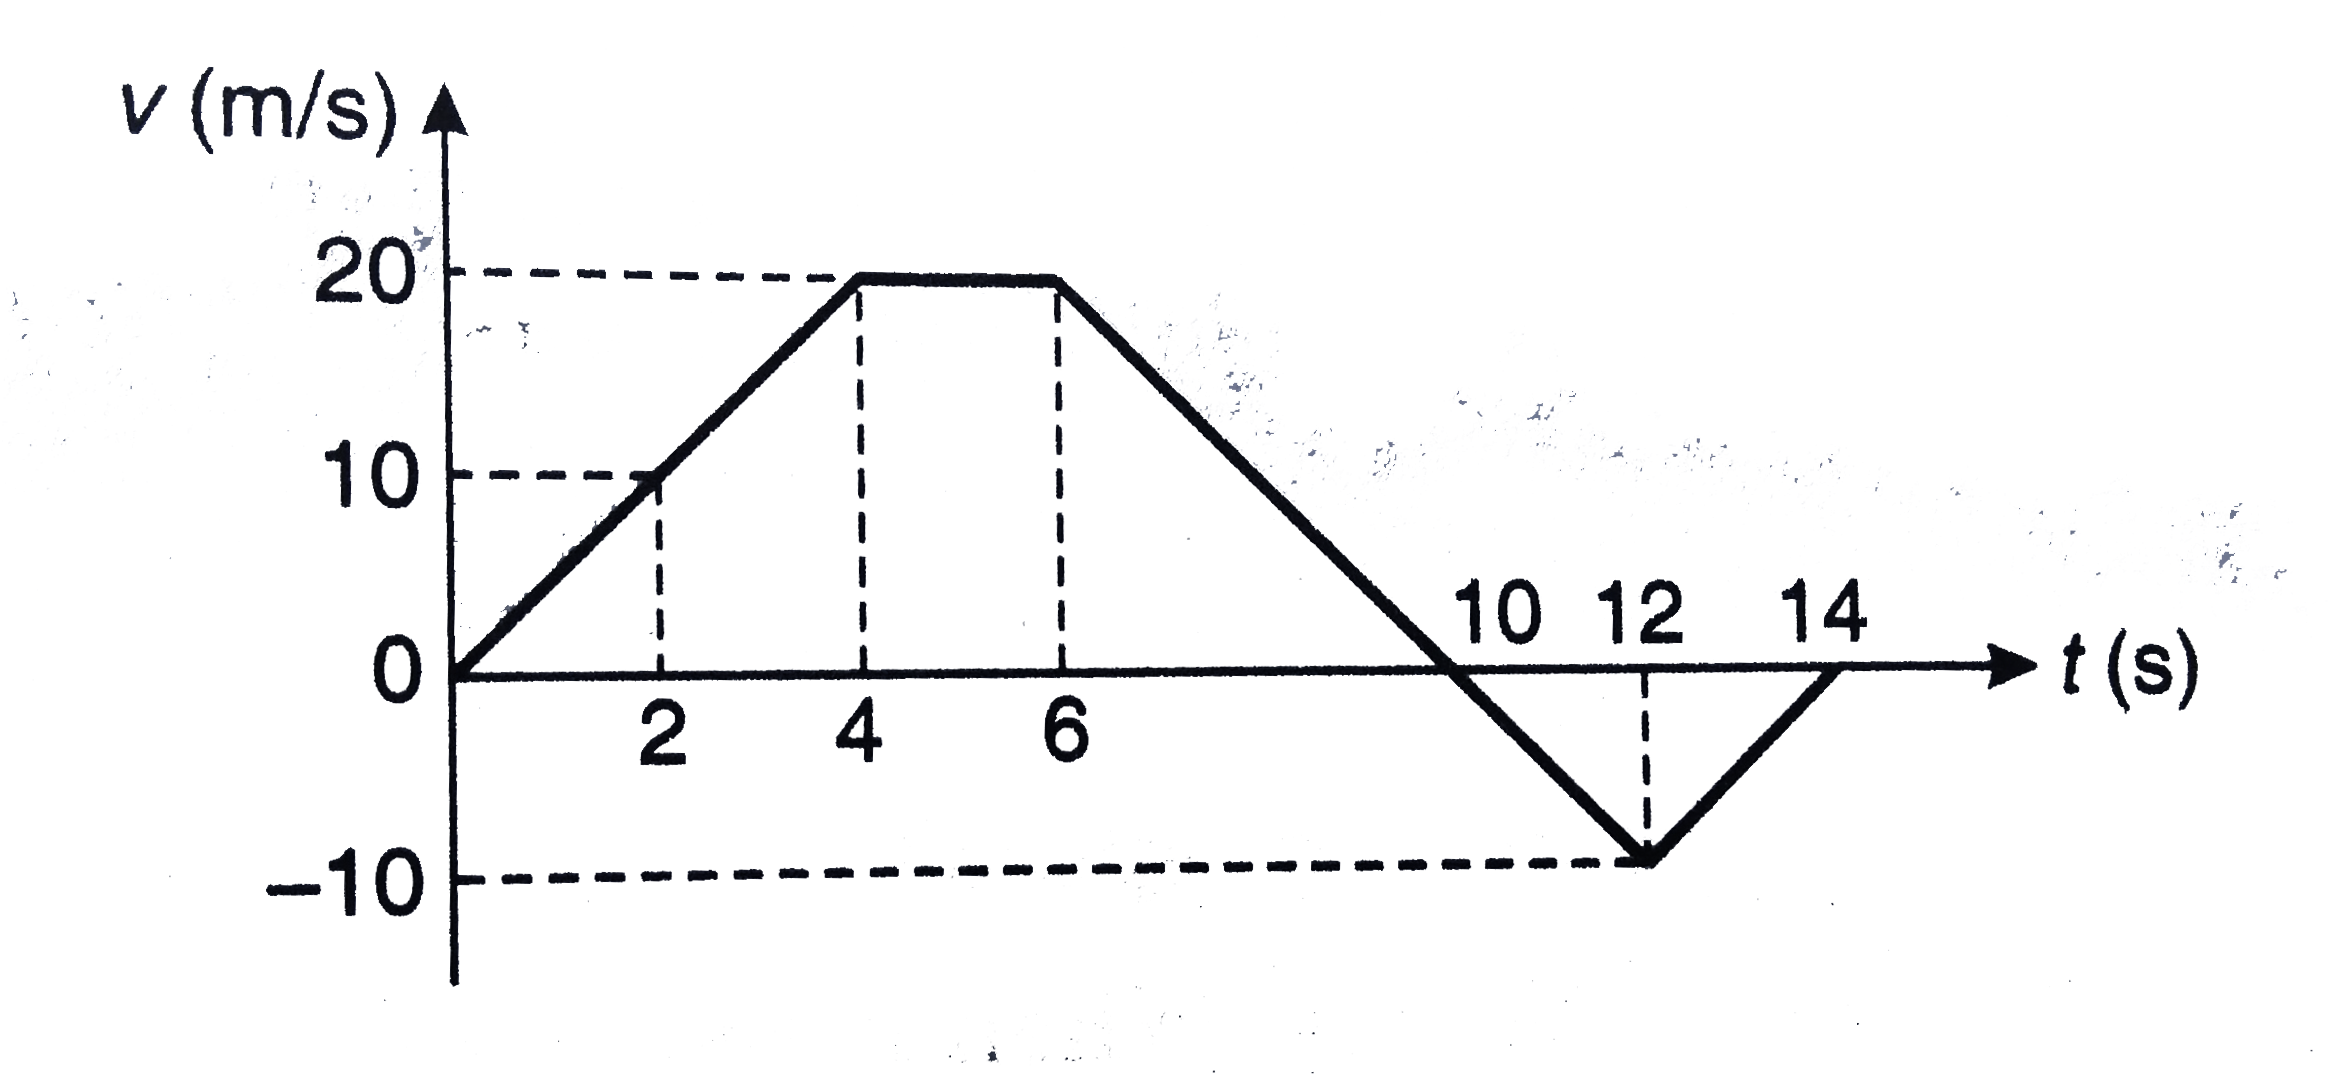
Velocity-time graph of a particle moving in a straight line is shown in figure. In the time interval from t=0 to t=14s, find
(a) average velocity and
(b) average speed of the particle.View SolutionVelocity-time graph of a particle moving in a straight line is shown in figure. In the time interval from t=0 to t=14s, find

(a) average velocity and
(b) average speed of the particle.View Solution
