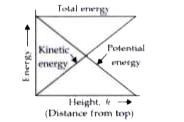
Draw a graph showing the variation of kinetic energy potential energy and total energy during the motion of a freely falling body.
The variation of kinetic, potential and total energies for a freely falling object during its motion is shown in the figure given below

Here, h is the distance from top
Topper's Solved these Questions
- WORK AND ENERGYBOOK - MTG IIT JEE FOUNDATIONCHAPTER - WORK AND ENERGYEXERCISE - Exercise (Subjective Problems short Answer Type)
16 Videos
- WORK AND ENERGYBOOK - MTG IIT JEE FOUNDATIONCHAPTER - WORK AND ENERGYEXERCISE - Exercise (Long Answer Type)
17 Videos
- WORK AND ENERGYBOOK - MTG IIT JEE FOUNDATIONCHAPTER - WORK AND ENERGYEXERCISE - Exercise (Comprehension Type)
5 Videos
- THRUST AND PRESSUREBOOK - MTG IIT JEE FOUNDATIONCHAPTER - THRUST AND PRESSUREEXERCISE - Olympiad/HOTS Corner
15 Videos
Similar Questions
Knowledge Check
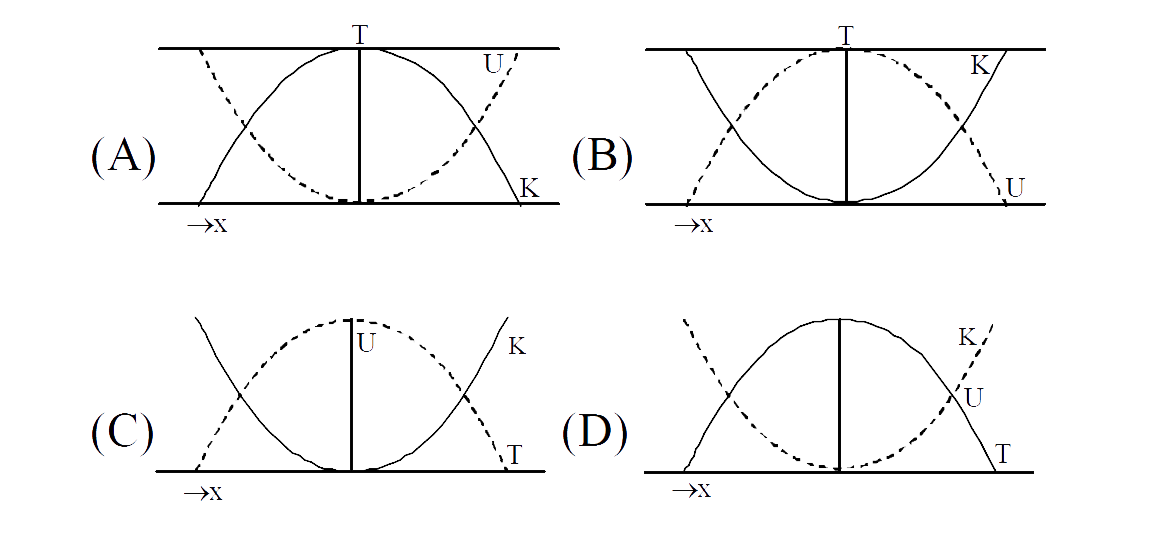
For a simple harmonic oscillator moving along a straight line, the graphs which represent the variation of kinetic energy K, potential energy U and total energy T with displacement are
A B
B C
C D
D
A particle is executing S.H.M. along a straight line. The graph showing the variation of kinetic, potential and total energy K, U and T respectively with displacement is -
 A
A B
B C
C D
D
Sketch graph showing the variation of (i) the kinetic energy, (ii) the potential energy and (iii) the total energy of a simple harmonic oscillation with displacement.
View SolutionDraw the graph showing distribution of kinetic energy of electrons emitted during beta decay.
View SolutionA particle is executing S.H.M. along a straight line. The graph showing the variation of kinetic, potential and total energy K, U and T respectively with displacement is -

View SolutionShow that the sum of kinetic energy and potential energy (ie, total mechanical energy) is always conserved in the case of a freely falling body under gravity (with air resistance neglected from a height by finding it when (i) the body is at the top c) the body has fallen a distance in the body has reached the ground.
View SolutionAs an electron makes a transition from an excited state to the ground state of a hydrogen like atom/ion
(a) kinetic energy, potential energy and total energy decrease
(b) kinetic energy decreases, potential energy increases but total energy remains same
(c ) kinetic energy and total energy decrease but potential energy increases
(d) its kinetic energy increases but potential energy and total energy decrease
View Solution
