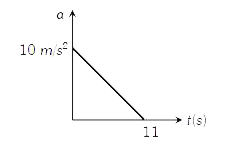
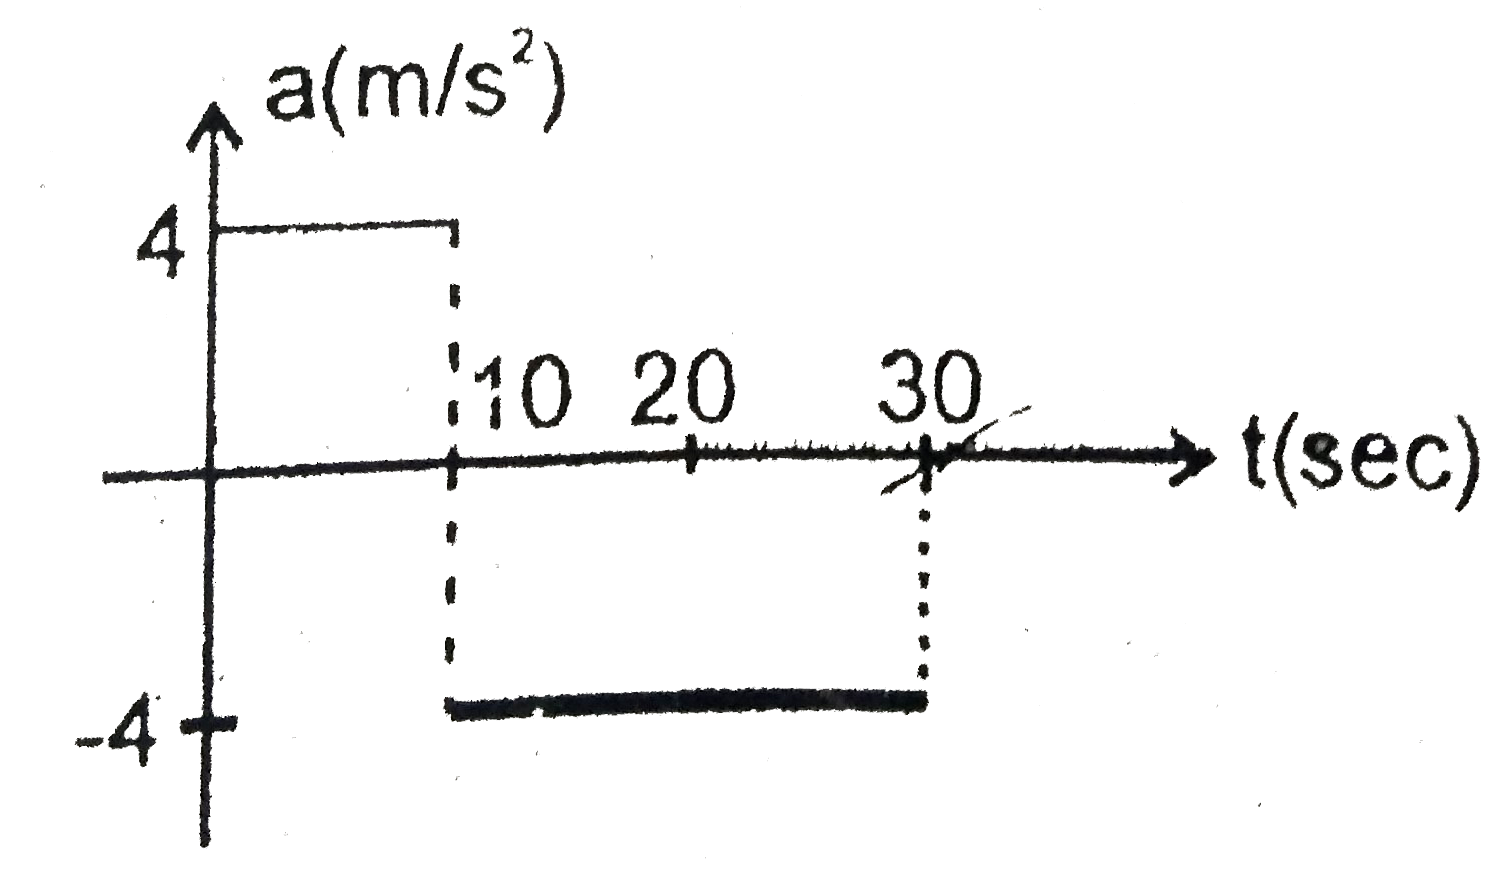
A particle starts from rest .its acceleration (a) versus time (t) is as shown in the figure . The maximum speed of the particle will be
110 m/s
55 m/s
550 m/s
660 m/s
The correct Answer is:B
vmax= area under a -t graph
=12×10×11
= 55 m/s .
Similar Questions
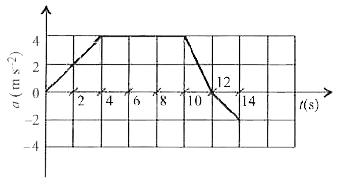
A graph of acceleration versus time of a particle starting from rest at t =0 is shown. The speed of the particle at t=14 second is
View SolutionA particle starts from rest. Its acceleration (a) versus time (t) is as shown in the figure. The maximum speed of the particle will be
View SolutionA particle starts from rest .its acceleration a versus time t is as shown in the figure . Find the maximum speed of the particle during its motion
(a is in ms−2and t is in seconds)
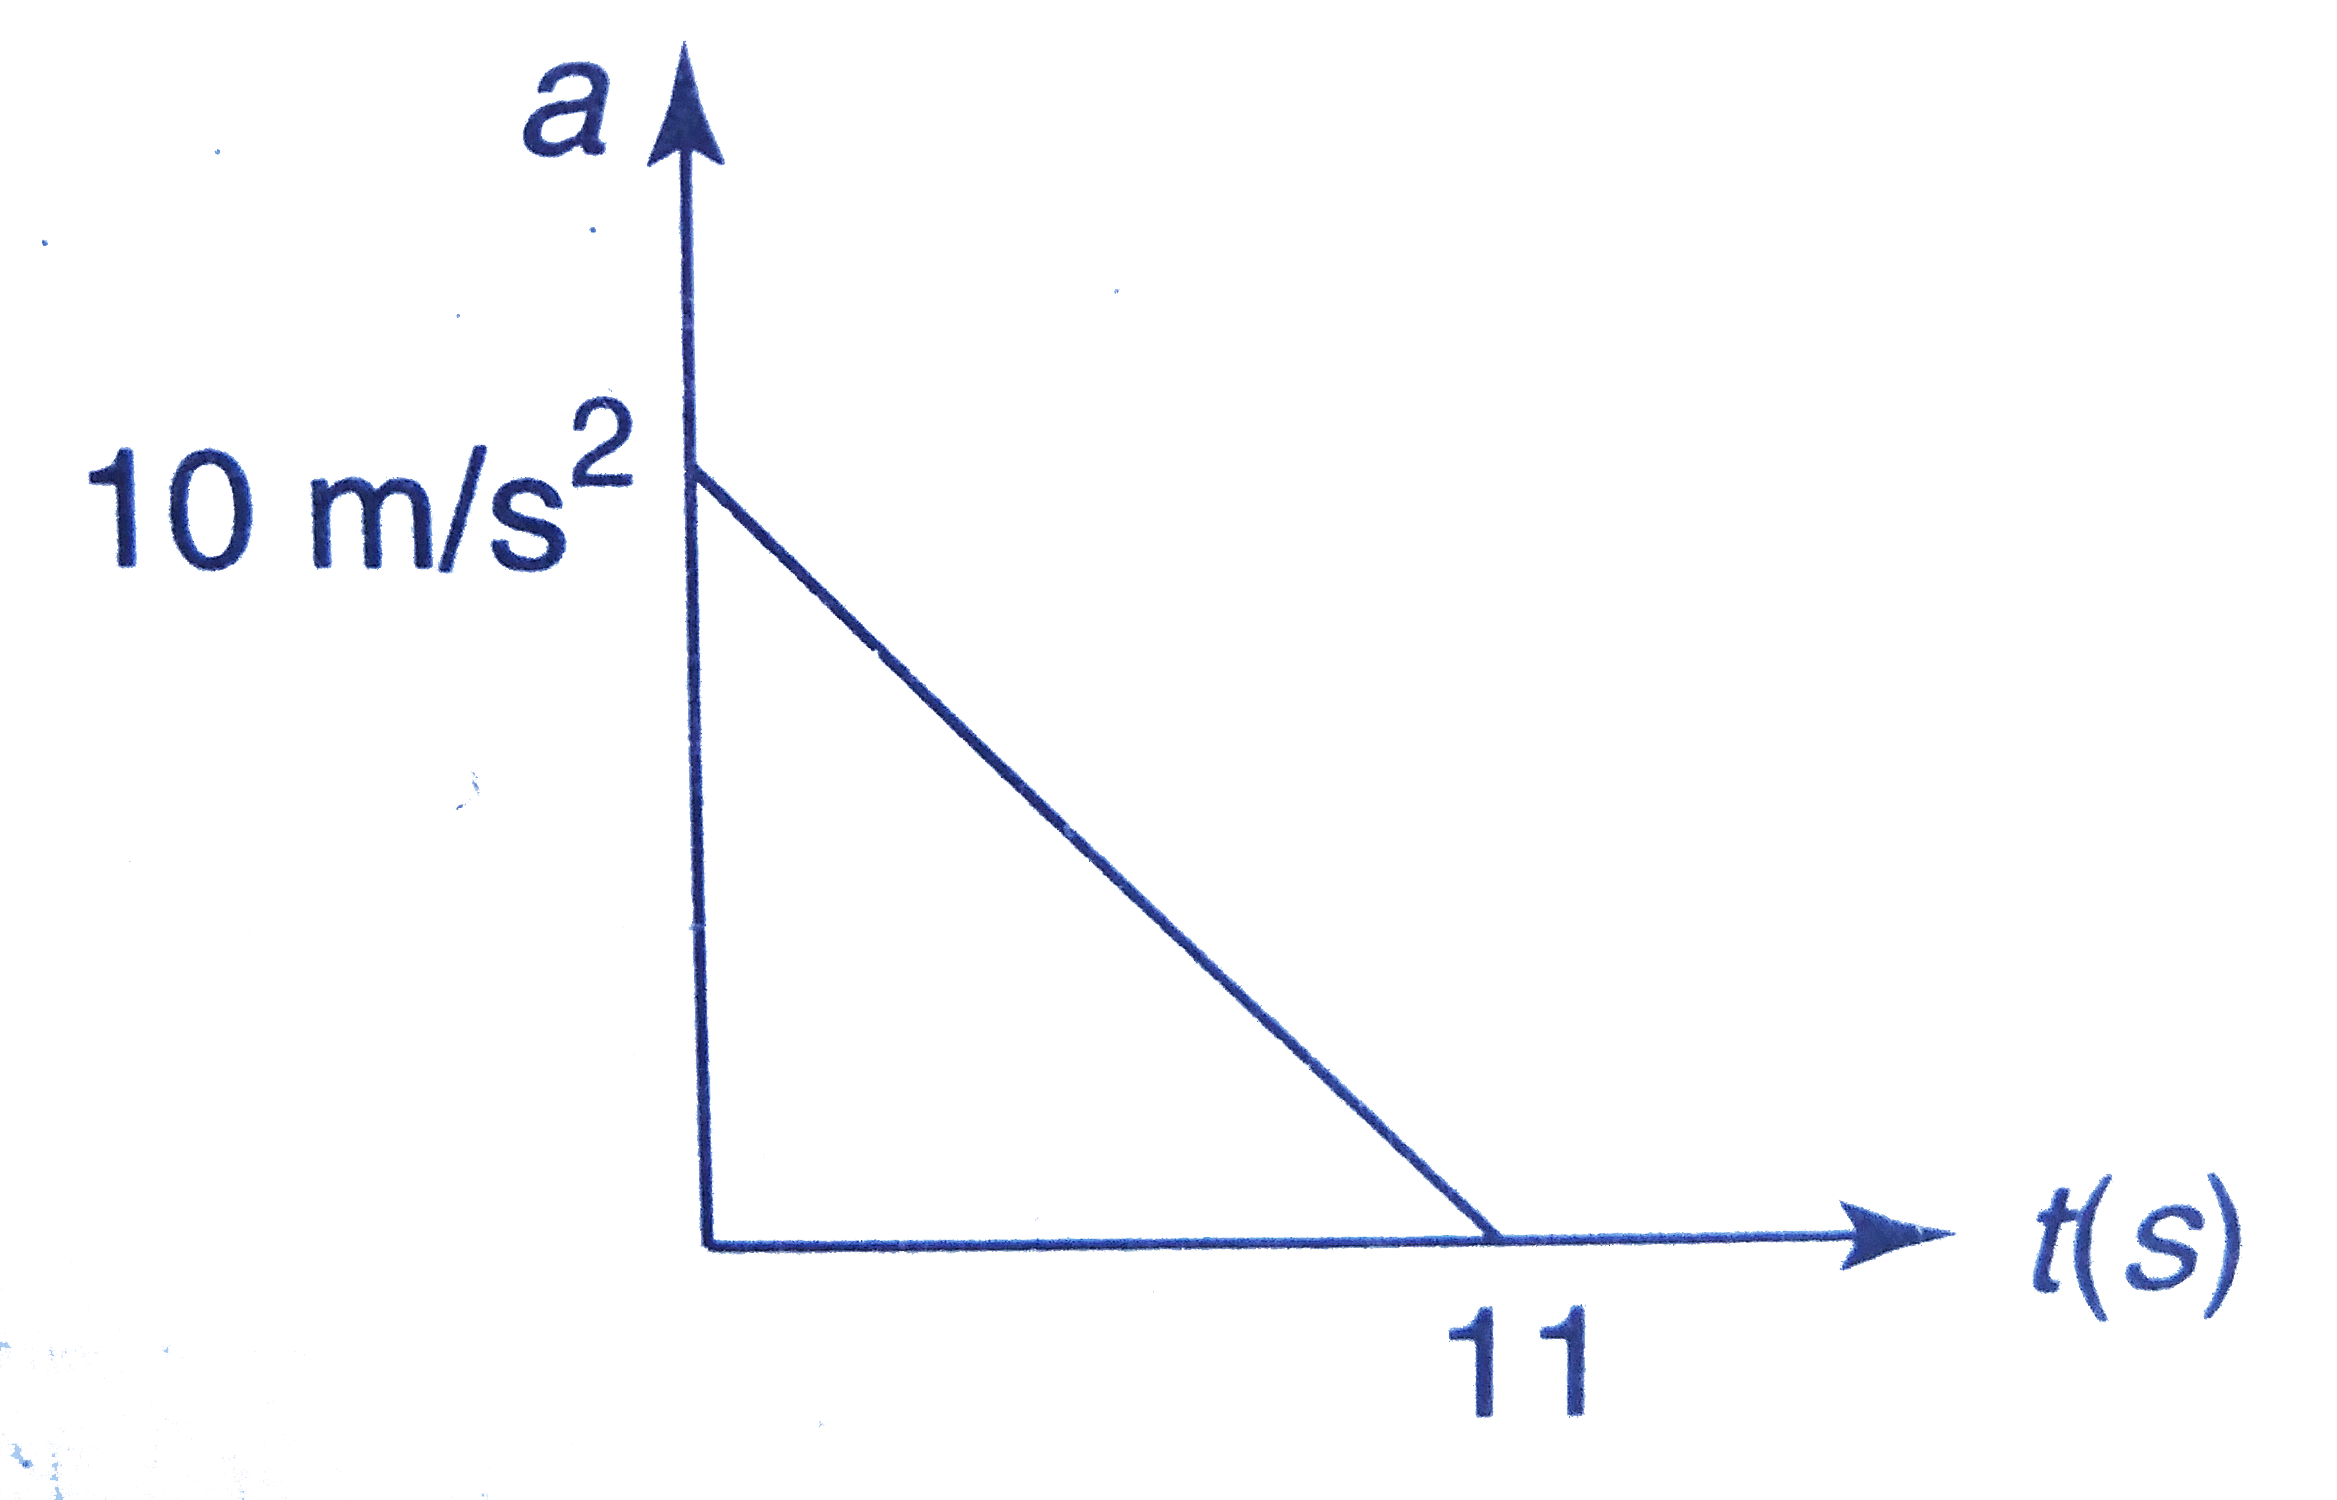
View SolutionA particle starting from rest. Its acceleration (a) versus time (t) is as shown in the figure.
The maximum speed of the particle will be.
View SolutionA particle starting from rest. Its acceleration (a) versus time (t) is as shown in the figure.
The maximum speed of the particle will be.

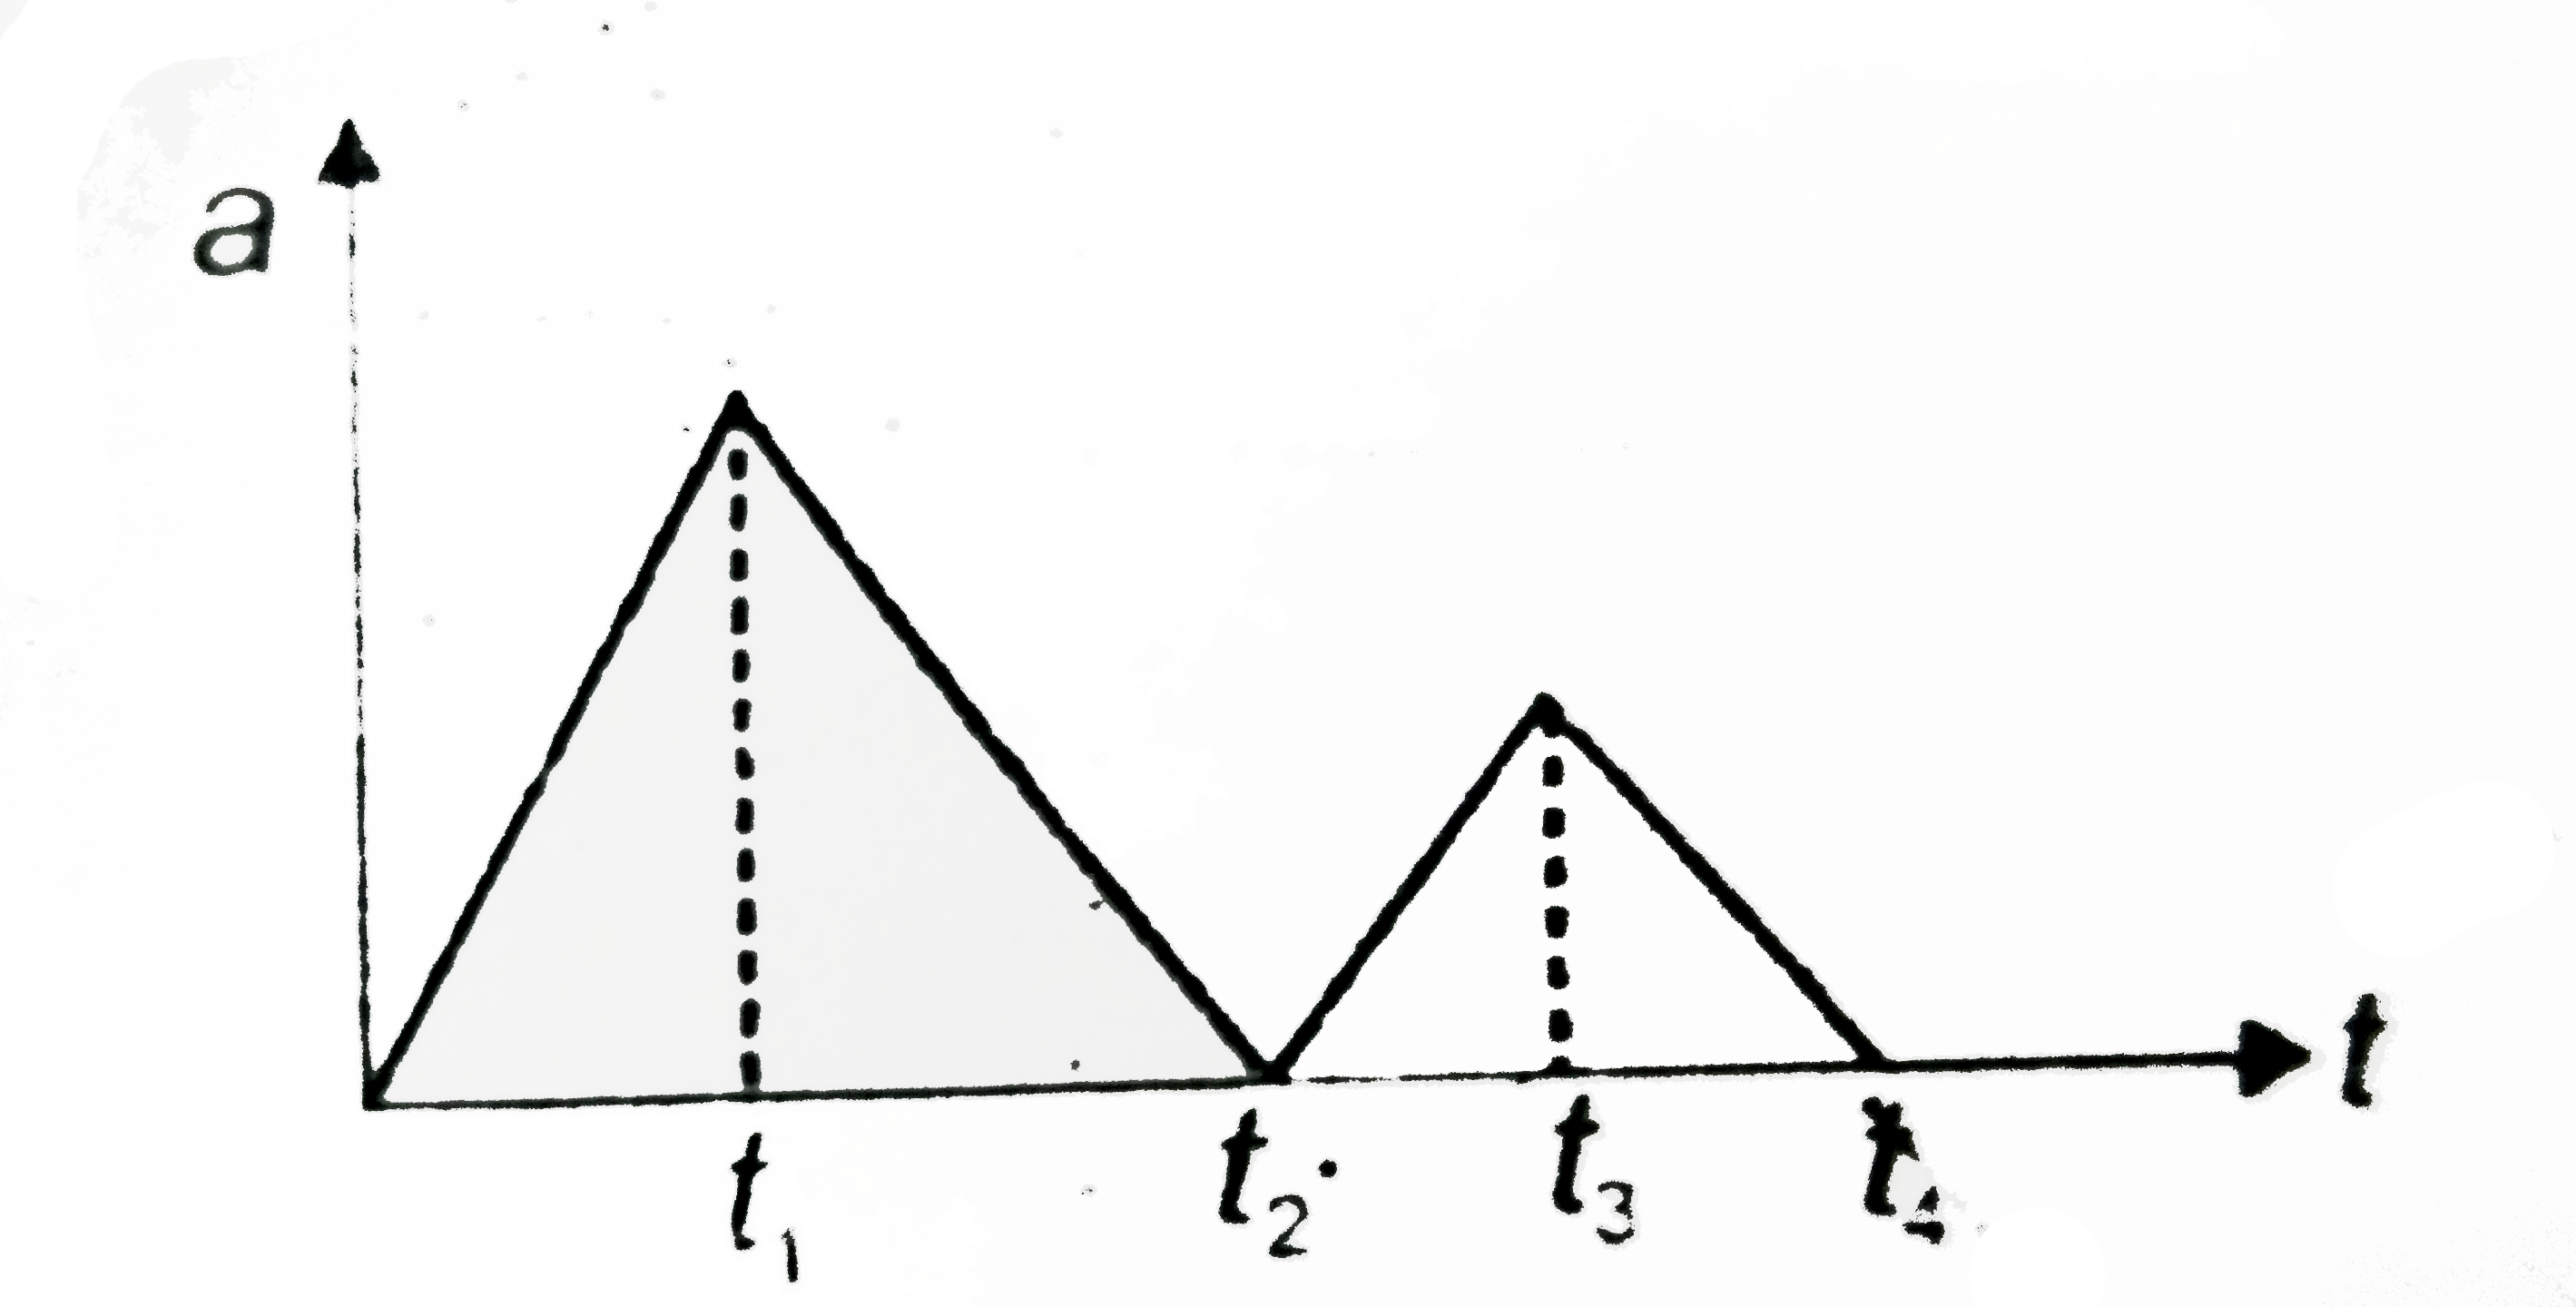
View SolutionA particle starts moving from rest on a straight line. Its acceleration a verses time t is shown in the figure. The speed of the particle is maximum at the instant
View SolutionThe acceleration versus time graph for a particle moving along a straight line is shown in the figure. If the particle starts from rest at t = 0, then its speed at t = 30 sec will be :
View SolutionA graph of acceleration versus time of a particle starting from rest at t=0 is as shown in figure. The speed of the particle at t = 14s is
View Solution
