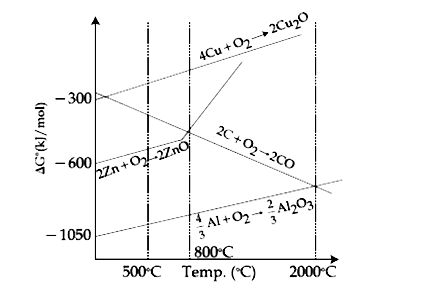
Statement 1: In Ellingham diagram metal having higher value of G is more likely to form oxide
Statement 2: In ellingham diagram lower metal will reduce upper metal
To analyze the statements regarding the Ellingham diagram, let's break down the concepts step by step.
Step 1: Understanding the Ellingham Diagram
The Ellingham diagram is a graphical representation used to predict the stability of metal oxides. It plots the Gibbs free energy change (ΔG) for the formation of oxides of various metals against temperature.
Step 2: Analyzing Statement 1
Statement 1: "In Ellingham diagram, metal having higher value of G is more likely to form oxide."
- Explanation: In the context of the Ellingham diagram, a higher ΔG value indicates that the formation of the metal oxide is less favorable thermodynamically. Therefore, metals with a higher ΔG are less likely to form stable oxides compared to those with lower ΔG values. Thus, this statement is incorrect.
Step 3: Analyzing Statement 2
Statement 2: "In Ellingham diagram, lower metal will reduce upper metal."
- Explanation: In the Ellingham diagram, if a metal is positioned lower on the graph, it means that it has a more negative ΔG value for oxide formation, indicating that it is more stable and more reactive. Therefore, a lower metal (more reactive) can reduce an upper metal (less reactive) from its oxide. This statement is correct.
Conclusion
- Statement 1 is False: A higher ΔG does not indicate a greater likelihood of forming an oxide.
- Statement 2 is True: A lower metal can reduce a higher metal from its oxide.
Final Answer
- Statement 1 is incorrect, and Statement 2 is correct.
---
The Ellingham diagram is a graphical representation used to predict the stability of metal oxides. It plots the Gibbs free energy change (ΔG) for the formation of oxides of various metals against temperature.
Statement 1: "In Ellingham diagram, metal having higher value of G is more likely to form oxide."
Statement 2: "In Ellingham diagram, lower metal will reduce upper metal."
- Statement 1 is False: A higher ΔG does not indicate a greater likelihood of forming an oxide.
- Statement 2 is True: A lower metal can reduce a higher metal from its oxide.
- Statement 1 is incorrect, and Statement 2 is correct.
Topper's Solved these Questions
Similar Questions
Knowledge Check
Select the correct statements for Ellingham diagram.
AThe slope of the curves of the formation of metal oxide is +ve because ΔfGӨ becomes less negative or increases with the rise in temperature.BEach curve is a straight line except when some change takes place in phase (s→1or1→g)CEach curve is not a straight line except when some changes takes place in phase (s→1or1→g).DThe slope of the curves of the formation of metal oxide is −ve becomes less negative or increases with the rise in temperature.Select the correct statements for Ellingham diagram.
AAny metal will reduce the oxide of other metals which lie about it in the Ellingham diagramBAccording to Ellingham diagram, Al will not reduce MgO at temperature below 1350∘C.CAccording to Ellingham diagram, Al will reduce MgO at temperature below 1350∘C.DAny metal will not reduce the oxide of other metals which lie above it in Ellingham diagram.Select the correct statements (Ellingham diagram) :
AWhen temperature is raised, a point will be reached where the graph crosses the ΔfGӨ=0 line. Below this temperature, the free energy of formation of the oxide is negative, so the oxide is stableBWhen the temperature is raised, a point will be reached where the graph crosses the ΔfGӨ=0 line. Above this temperature, the free energy of formation of the oxide is positive, and the oxide becomes instable, and should decompose into the metal and dioxygen.CTheoretically, all oxides can be decomposed to give the metal and dioxygen if a sufficiency high temperature can be attained.DTheoretically, all oxides cannot be decomposed to give the metal and dioxide if a sufficiently high temperature can be attained.
Statement 1: Ellingham diagram is used to check which metal to be reduced by which compound
Statement 2: In Ellingham diagram as we move from left to right ΔS increase
View SolutionIn Ellingham diagram, the slope of the curve of the formation metal oxide:
View SolutionWhich of the following statemetnt is incorrect regarding Ellingham diagram for a metal ?
View SolutionELLINGHAM DIAGRAM
View SolutionThe statement that is INCORRECT about Ellingham diagram is
View Solution

