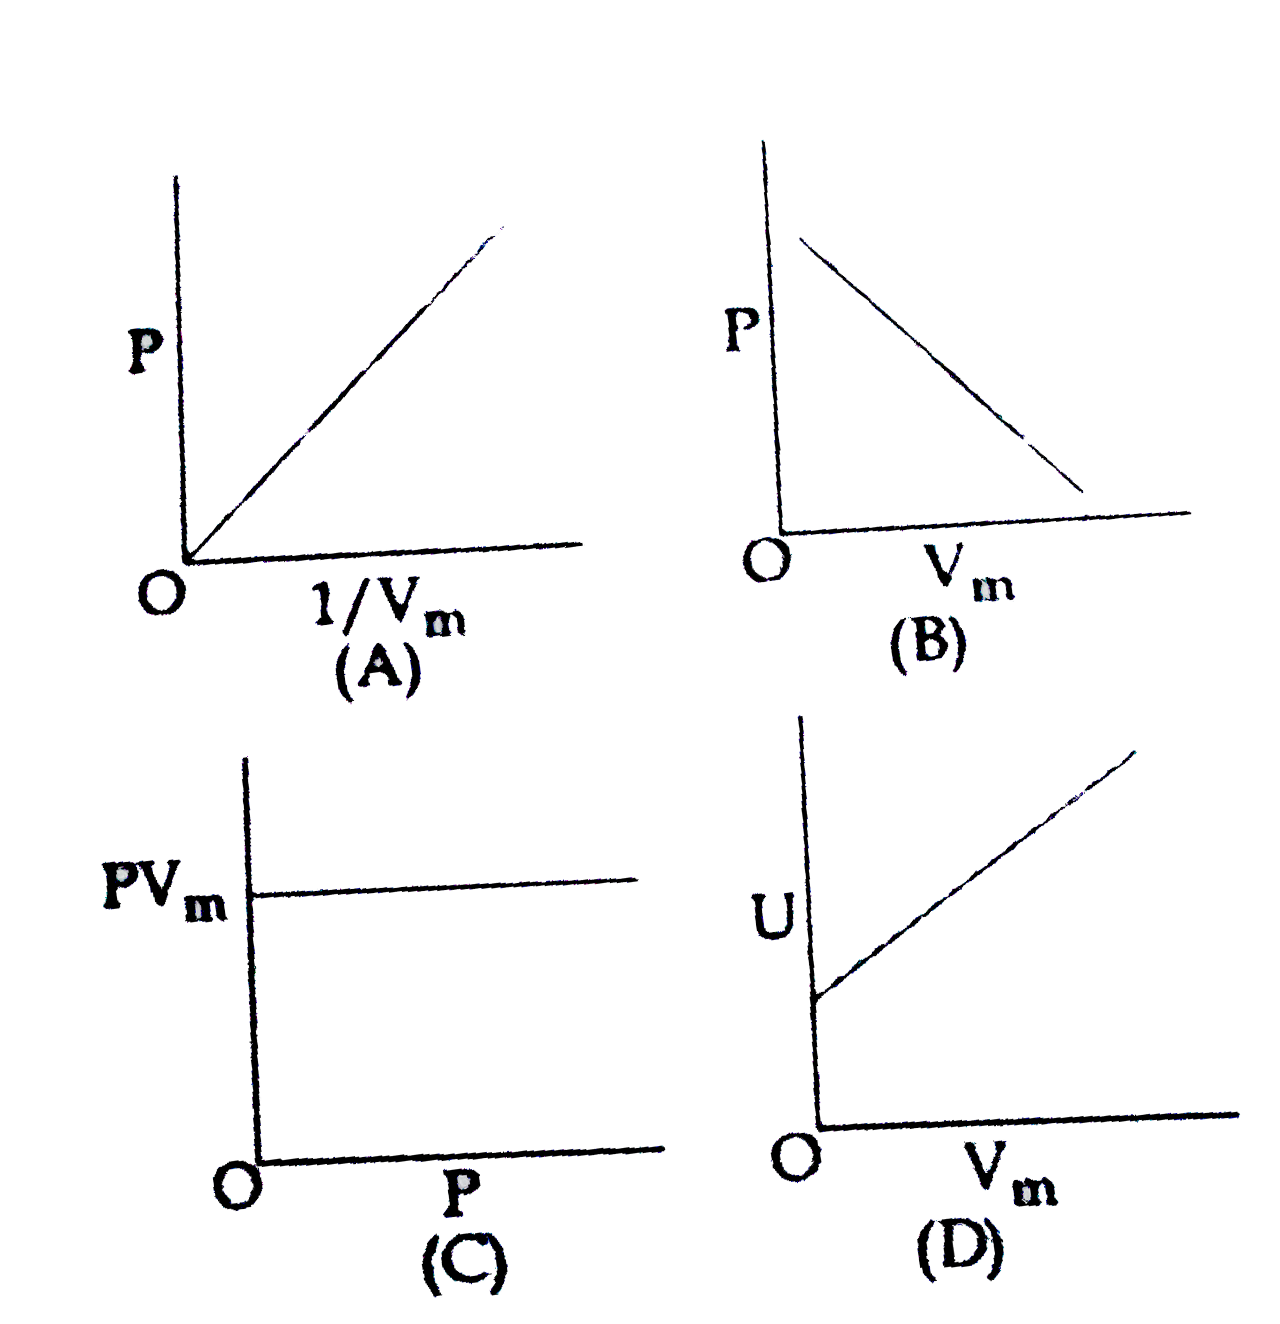
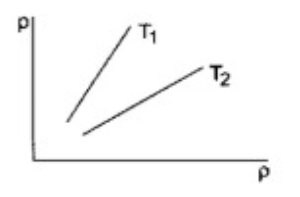
Which amongst the given plots is the correct plot for pressure (p) vs density (d) for an ideal gas ?
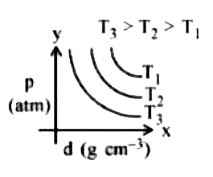
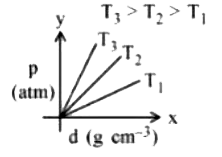
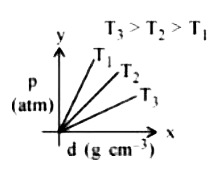
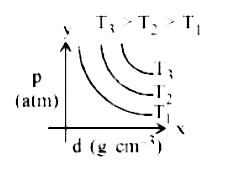
The correct Answer is:B
To determine the correct plot for pressure (p) versus density (d) for an ideal gas, we can start by using the ideal gas law, which is given by the equation:
PV=nRT
Where:
- P = Pressure
- V = Volume
- n = Number of moles
- R = Universal gas constant
- T = Temperature
We can also express density (d) in terms of mass (m) and volume (V):
d=mV
From the ideal gas law, we can rearrange it to express pressure in terms of density:
1. Substitute V in terms of density:
V=md
2. Substitute V back into the ideal gas law:
P(md)=nRT
3. Rearranging gives:
P=nRTdm
4. If we consider n and m as constants for a given gas, we can simplify this to:
P=k⋅d
where k=nRTm is a constant that depends on the temperature and the specific gas.
This equation shows that pressure is directly proportional to density. Therefore, the graph of pressure (P) versus density (d) will be a straight line passing through the origin with a positive slope.
Now, considering the effect of temperature:
- If the temperature increases, the value of k increases, which means the slope of the line will be steeper.
- Therefore, for different temperatures T1<T2<T3, the plots will be straight lines through the origin with increasing slopes.
Conclusion:
The correct plot for pressure vs density for an ideal gas will be a straight line passing through the origin, with the slope increasing with temperature.
- P = Pressure
- V = Volume
- n = Number of moles
- R = Universal gas constant
- T = Temperature
V=md
P(md)=nRT
P=nRTdm
P=k⋅d
where k=nRTm is a constant that depends on the temperature and the specific gas.
- If the temperature increases, the value of k increases, which means the slope of the line will be steeper.
- Therefore, for different temperatures T1<T2<T3, the plots will be straight lines through the origin with increasing slopes.
The correct plot for pressure vs density for an ideal gas will be a straight line passing through the origin, with the slope increasing with temperature.
Topper's Solved these Questions
- BOOK - JEE MAINS PREVIOUS YEARCHAPTER - JEE MAINS 2022EXERCISE - CHEMISTRY (SECTION-B)10videos
JEE MAINS 2022
- BOOK - JEE MAINS PREVIOUS YEARCHAPTER - JEE MAINS 2022EXERCISE - PART : CHEMISTRY30videos
JEE MAINS 2022
- BOOK - JEE MAINS PREVIOUS YEARCHAPTER - JEE MAINS 2021EXERCISE - Chemistry (Section B )10videos
JEE MAINS 2021
- BOOK - JEE MAINS PREVIOUS YEARCHAPTER - JEE MAINS 2023 JAN ACTUAL PAPEREXERCISE - Question360videos
JEE MAINS 2023 JAN ACTUAL PAPER
Similar Questions
Knowledge Check
- Question 1 - Select One
Which is the correct plot for In k vs 1/T?
A B
B C
C D
D
- Question 2 - Select One or More
Which of the following plots are correct for an ideal gas ?
A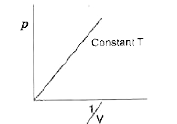 B
B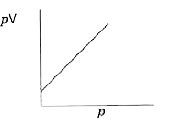 C
C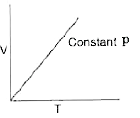 D
D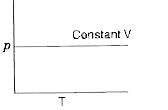
- Question 3 - Select One or More
Which of the plots of ln K vs (1T) is/are correct?
A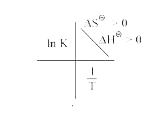 B
B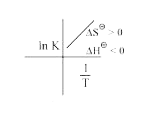 C
C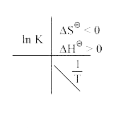 D
D
The combination of plots which does not represent isothermal expansion of an ideal gas is :
View SolutionThe plot of √v vs Z is
View SolutionWhich of the following is a correct plot of the volume of fixed amount of ideal gas as a function of temperature (at constant pressure)
View SolutionShows graphs of pressure vs density for an ideal gas at two temperaturesT1andT2
 View Solution
Which of the following plots is(are) correct for the given reaction? ([P]0 is the initial consentration of P)
 View Solution


