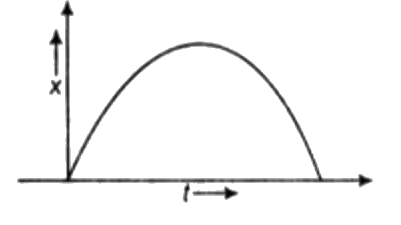
In SHM, v-x graph will be
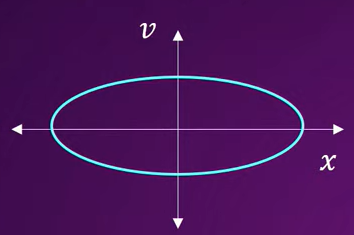
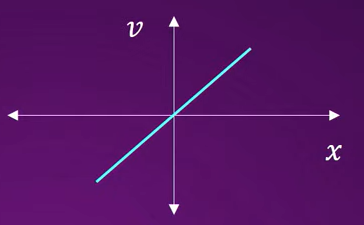
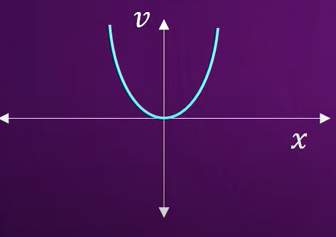
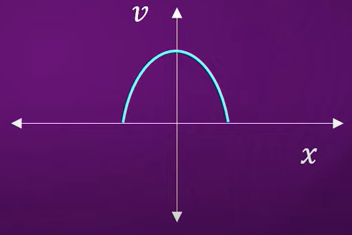
To find the relationship between velocity (v) and displacement (x) in Simple Harmonic Motion (SHM), we can derive the equation step by step.
1. Understanding the relationship in SHM:
In SHM, the velocity (v) of the particle can be expressed in terms of its displacement (x) from the mean position. The formula for velocity in SHM is given by:
v=ω√A2−x2
where ω is the angular frequency, A is the amplitude, and x is the displacement.
2. Squaring both sides:
To eliminate the square root, we square both sides of the equation:
v2=ω2(A2−x2)
3. Rearranging the equation:
Rearranging the equation gives us:
v2=ω2A2−ω2x2
This can be rewritten as:
ω2x2+v2=ω2A2
4. Identifying the form of the equation:
The equation ω2x2+v2=ω2A2 resembles the standard form of an ellipse equation, which is:
x2A2+v2ω2=1
Thus, we can see that the graph of v versus x will be an ellipse.
5. Finding intercepts:
- The y-intercept occurs when x=0:
v=ω(maximum velocity)
- The x-intercept occurs when v=0:
x=A(maximum displacement)
6. Graphing the relationship:
When we plot the graph of v against x:
- The maximum value of v is ω (at x=0).
- The maximum value of x is A (at v=0).
- The graph will be an ellipse with the axes defined by these maximum values.
Conclusion:
The graph of velocity (v) versus displacement (x) in Simple Harmonic Motion is an ellipse, with the y-axis intercept at ω and the x-axis intercept at A.
In SHM, the velocity (v) of the particle can be expressed in terms of its displacement (x) from the mean position. The formula for velocity in SHM is given by:
v=ω√A2−x2
where ω is the angular frequency, A is the amplitude, and x is the displacement.
To eliminate the square root, we square both sides of the equation:
v2=ω2(A2−x2)
Rearranging the equation gives us:
v2=ω2A2−ω2x2
This can be rewritten as:
ω2x2+v2=ω2A2
The equation ω2x2+v2=ω2A2 resembles the standard form of an ellipse equation, which is:
x2A2+v2ω2=1
Thus, we can see that the graph of v versus x will be an ellipse.
- The y-intercept occurs when x=0:
v=ω(maximum velocity)
- The x-intercept occurs when v=0:
x=A(maximum displacement)
When we plot the graph of v against x:
- The maximum value of v is ω (at x=0).
- The maximum value of x is A (at v=0).
- The graph will be an ellipse with the axes defined by these maximum values.
The graph of velocity (v) versus displacement (x) in Simple Harmonic Motion is an ellipse, with the y-axis intercept at ω and the x-axis intercept at A.
Topper's Solved these Questions
Similar Questions
Knowledge Check
In SHM, graph of which of the following is a straight line?
AT.E. against displacementBP.E. against displacementCacceleration against timeDvelocity against displacementIn S.H.M., the graph between kinetic energy K and time 't' is
A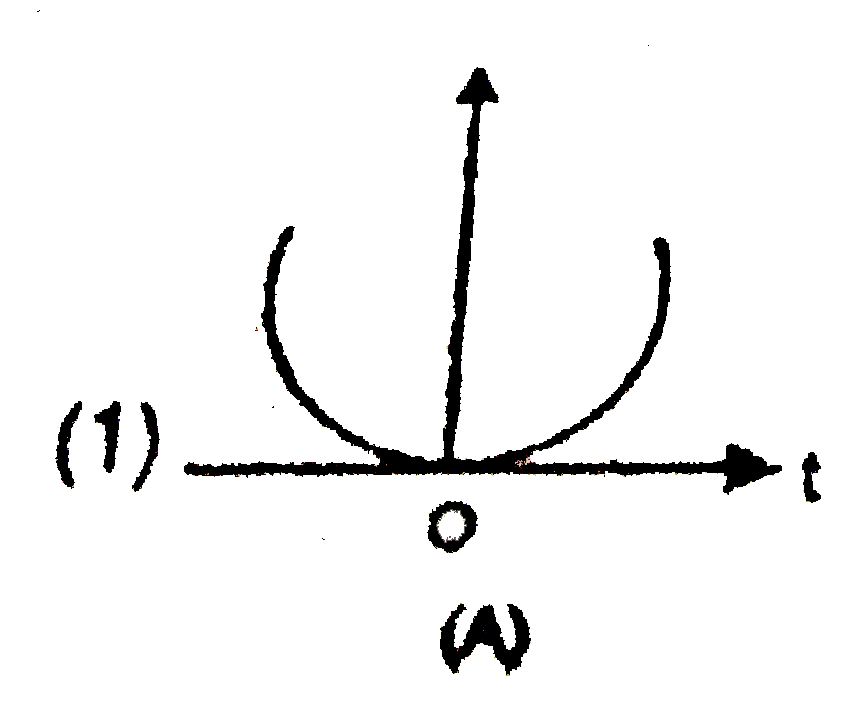 B
B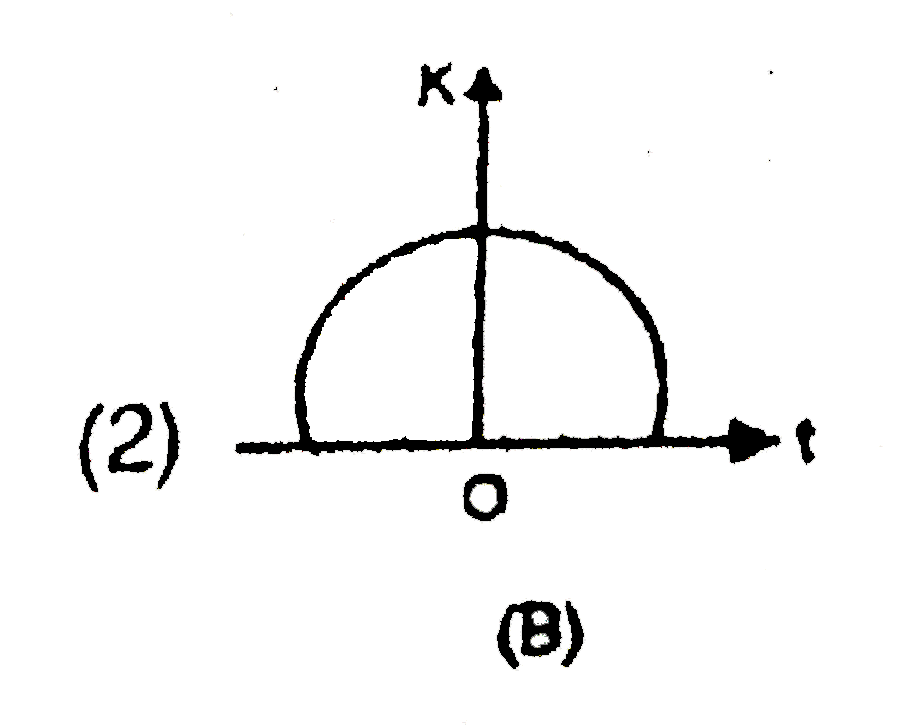 C
C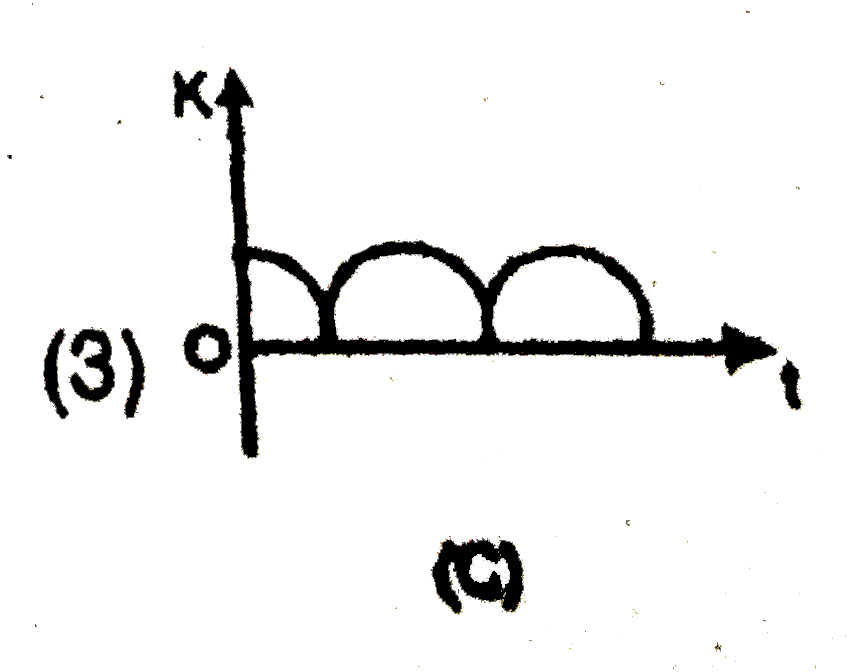 D
D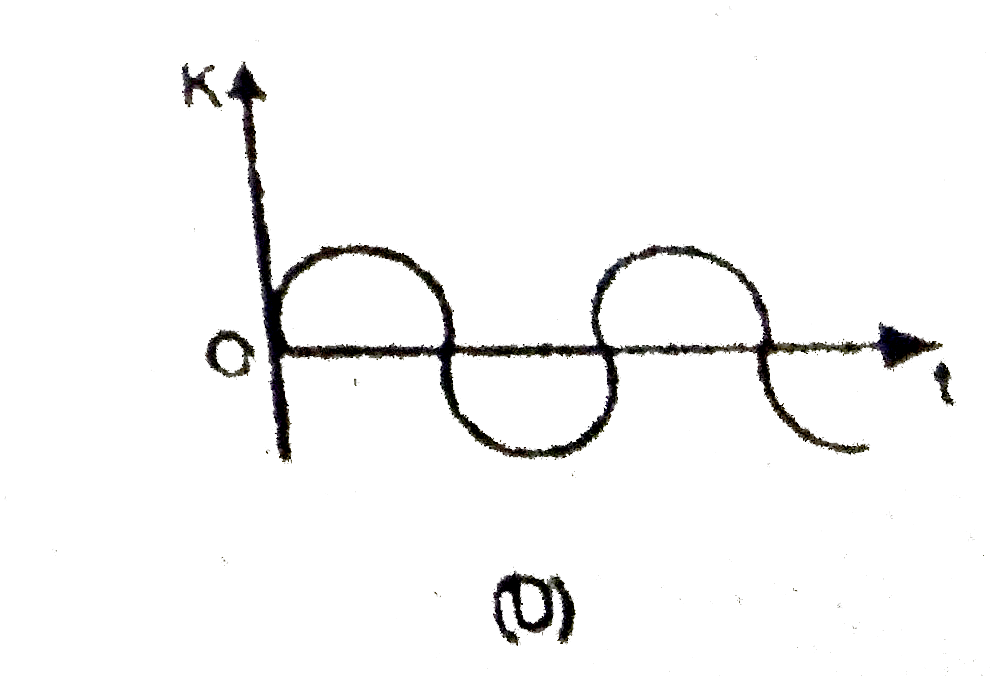
A particle is performing linear S.H.M. If the acceleration and corresponding velocity of the particle are ∝ and v respectively and if we plot v2 on Y axis and ∝2 on X axis, then the graph will be
Aa parabolaBa straight lineCan ellipseDa hyperbola
STATEMENT-1 : A particle is performing simple harmonic motion along X axis with amplitude A. If a graph is plotted between velocity of particle and its X coordinate then graph will be elliptical.
STATEMENT-2 : Velocity of particle in SHM as a fuction of position is given by
v=ω√A2−X2.
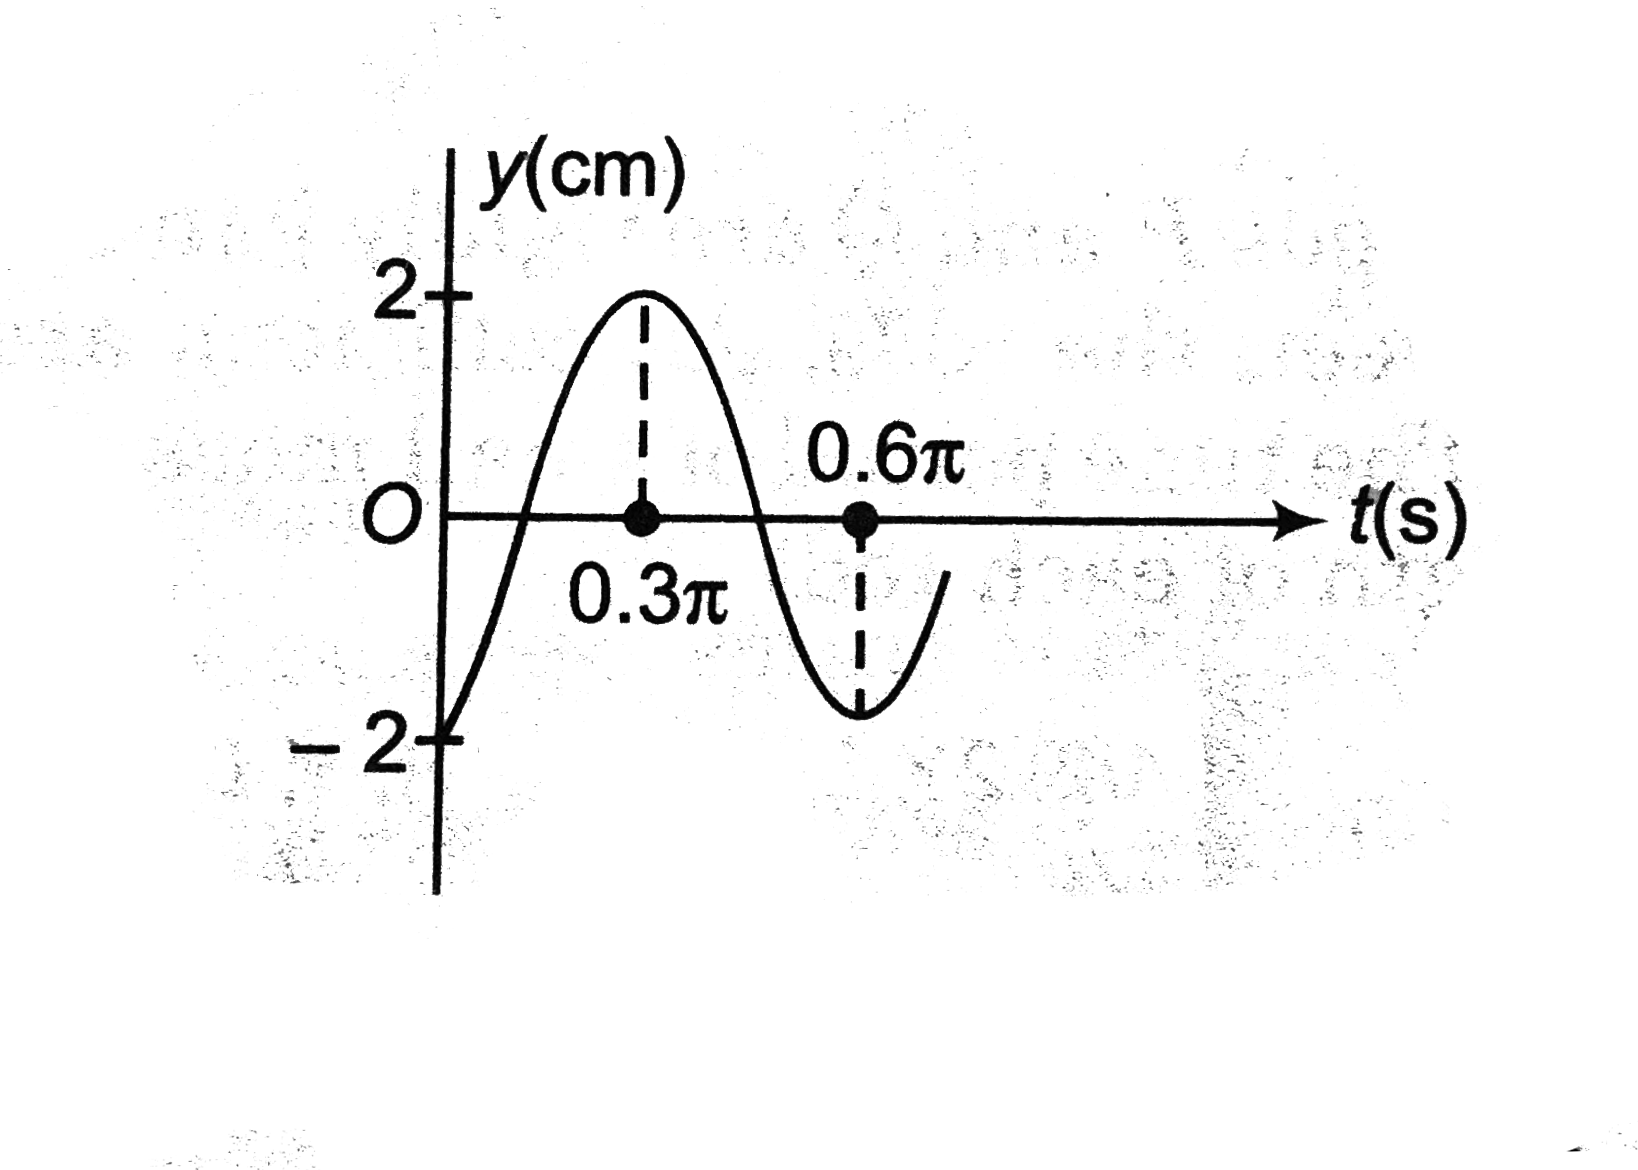
View SolutionPart of SHM is graphed in the figure. Here, y is displacement from mean position. The correct equation describing the SHM is
View SolutionA particle executes SHM. Then the graph of velocity as a function of displacement is
View SolutionIf a graph is plotted between velocity (v) and displacement (y) of a particle executing SHM from mean position, then the nature of the graph is
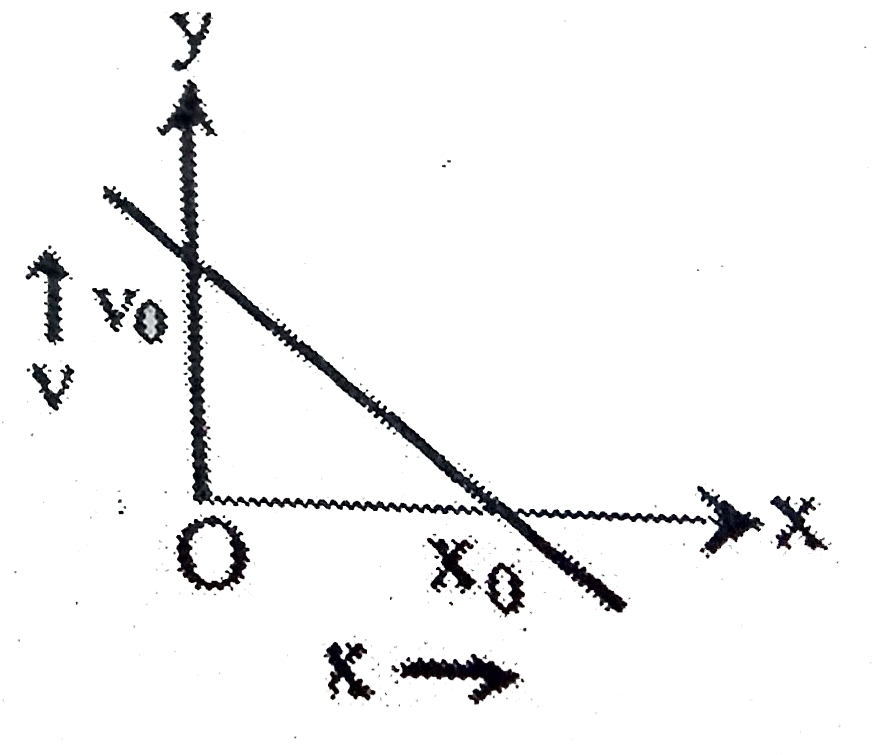
View SolutionDepict the shown v-x graph in a-x graph :
View Solution

