The pyramid graph below shows the ages of the 548 Members of Parliament in the 17th Lok Sabha.
Age distribution of 548 Members of Parliament (MP)
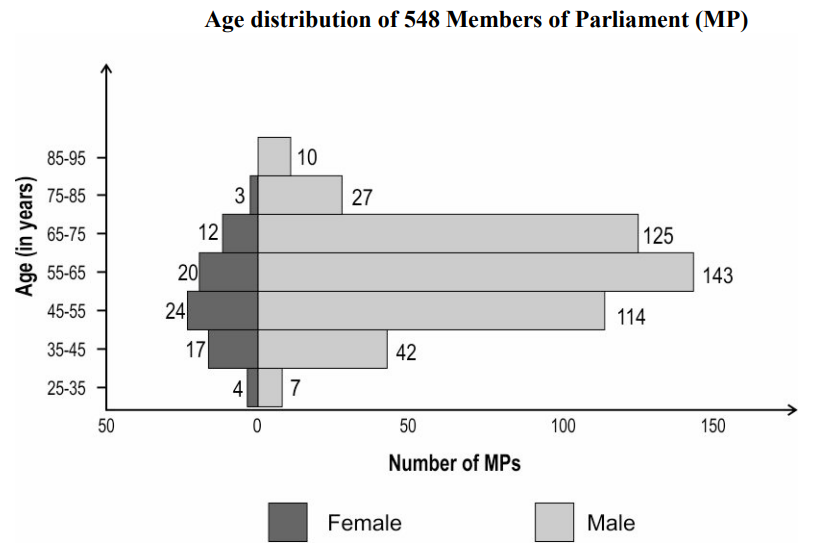
On an average, how much younger is a female MP than a male MP? Round your answer to the nearest whole number and show your work.
Step by step video & image solution for The pyramid graph below shows the ages of the 548 Members of Parliament in the 17th Lok Sabha. <b> Age distribution of 548 Members of Parliament (MP) On an average, how much younger is a female MP than a male MP? Round your answer to the nearest whole number and show your work. by Maths experts to help you in doubts & scoring excellent marks in Class 10 exams.
Updated on:21/07/2023Topper's Solved these Questions
Similar Questions
You are a member of the Parliament. Being in that position suggest any four views in favour of increasing the number of seats in the Lok Sabha. Support your answer with appropriate arguments.
View SolutionThe bar graph shows the total number of male and female lives in four different towns and table shows the number of males and females whose ages are above 40 years. Read the data carefully and answer the questions below:
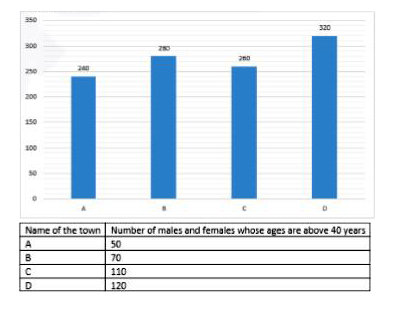
If in another town E, total males and females are 10% more than the total males and females in town A and those males and females whose ages are above 40 years is 20% more than those males and females whose ages are above 40 years in town C. find the number of those males and females in town E whose ages are below and equals to 40 years.
View Solution
Knowledge Check
During the winter session all the women which constitutes 15th strength of the lok sabha left the house (i.e, parliament) due to the rejection of their demand. Actually they were asking for the 50% reservation of seats for the women in the lok sabha thus the average age of the remaning members of the house (i.e, the lok sabha) increase by 14th than it was earlier when all the members(i.e, men and women) were present. if the average age of women be 30 years then the average age of male members in the Lok sabha will be :
A26B34C40Dnone of theseDuring the winter session all the women which constitutes 15th strength of the lok sabha left the house (i.e, parliament) due to the rejection of their demand. Actually they were asking for the 50% reservation of seats for the women in the lok sabha thus the average age of the remaning members of the house (i.e, the lok sabha) increase by 14th than it was earlier when all the members(i.e, men and women) were present. if the average age of women be 30 years then the average age of male members in the Lok sabha will be :
A300 MPsB475 MPsC526 MPSDnone of theseThe bar graph shows the total number of male and female lives in four different towns and table shows the number of males and females whose ages are above 40 years. Read the data carefully and answer the questions below:
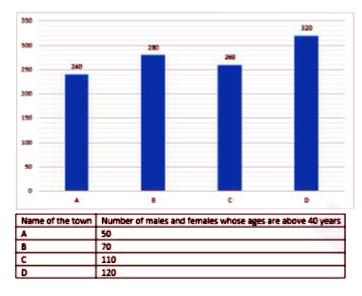
Number of males and females in town A whose ages are below and equals to 40 years is what percent less than those number of males and females in town D whose ages are below and equals to 40 years.A10%B12%C7%D5%
The bar graph shows the total number of male and female lives in four different towns and table shows the number of males and females whose ages are above 40 years. Read the data carefully and answer the questions below:
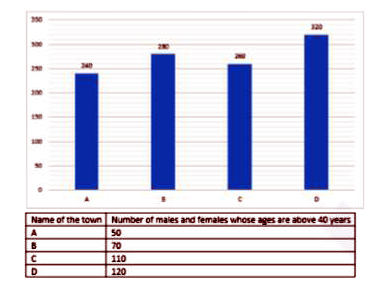
Find the ratio of the those number of males and females whose ages are above 40 years in town A and B to those males and females whose ages are below and equals to 40 years in town D.
View SolutionThe bar graph shows the total number of male and female lives in four different towns and table shows the number of males and females whose ages are above 40 years. Read the data carefully and answer the questions below:
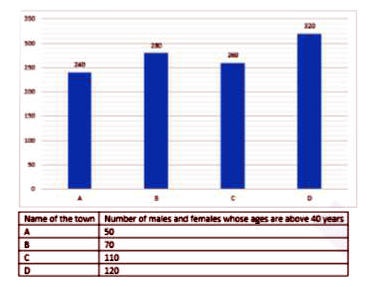
Find the average number of those males and females whose ages are below and equals to 40 years of town A, C and D.
View SolutionThere are two houses in parliament. One is lok sabha and the other one is rajya sabha and the member of parliaments (mps) in both the houses in 300 and 200 respectively. The average age of the member of lok sabha and rajya sabha is 40 years and 50 years respectively. A member of rajay sabha and becomes the members of the lok sabha. thus the average age of both the houses increases which one of the following statements is true/
View SolutionThere are two houses in parliament. One is lok sabha and the other one is rajya sabha and the member of parliaments (mps) in both the houses in 300 and 200 respectively. The average age of the member of lok sabha and rajya sabha is 40 years and 50 years respectively. A member of rajay sabha and becomes the members of the lok sabha. thus the average age of both the houses increases which one of the following statements is true/
View SolutionDuring the winter session all the women which constitutes 15th strength of the lok sabha left the house (i.e, parliament) due to the rejection of their demand. Actually they were asking for the 50% reservation of seats for the women in the lok sabha thus the average age of the remaning members of the house (i.e, the lok sabha) increase by 14th than it was earlier when all the members(i.e, men and women) were present. if the average age of women be 30 years then the average age of male members in the Lok sabha will be :
View Solution
