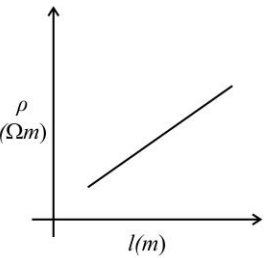
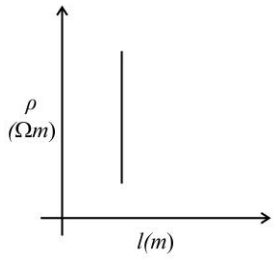
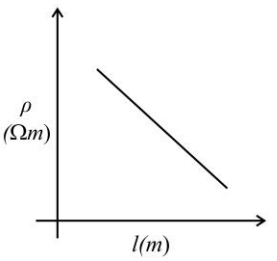
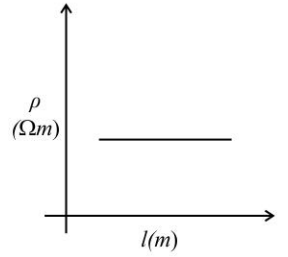
Raman wants to draw a graph to show how the resistivity (ρ) of a wire changes with the length (l) of the wire.
What should his graph look like?


To solve the question of how the resistivity (ρ) of a wire changes with its length (l), we need to understand the relationship between resistivity, resistance, length, and cross-sectional area of the wire.
Step 1: Understand the Concept of Resistivity
Resistivity (ρ) is a material property that does not change with the dimensions of the wire. It is defined as the resistance (R) of a material per unit length and per unit cross-sectional area.
Step 2: Recall the Formula
The formula for resistance is given by:
R=ρ⋅lA
Where:
- R = Resistance
- ρ = Resistivity
- l = Length of the wire
- A = Cross-sectional area of the wire
From this formula, we can see that resistivity (ρ) is independent of the length (l) of the wire and the cross-sectional area (A).
Step 3: Analyze the Relationship
Since resistivity is a constant for a given material at a specific temperature, changing the length of the wire does not affect its resistivity. Therefore, regardless of how long or short the wire is, the resistivity remains the same.
Step 4: Draw the Graph
To represent this relationship graphically:
- On the x-axis, we will plot the length of the wire (l).
- On the y-axis, we will plot the resistivity (ρ).
Since resistivity does not change with length, the graph will be a horizontal line, indicating that resistivity remains constant as the length of the wire changes.
Step 5: Conclusion
The graph that Raman should draw will look like a horizontal line parallel to the x-axis. This indicates that resistivity (ρ) is constant regardless of the length (l) of the wire.
Final Graph Representation
- The graph will show a constant value of resistivity (ρ) for varying lengths (l).
Resistivity (ρ) is a material property that does not change with the dimensions of the wire. It is defined as the resistance (R) of a material per unit length and per unit cross-sectional area.
The formula for resistance is given by:
R=ρ⋅lA
Where:
- R = Resistance
- ρ = Resistivity
- l = Length of the wire
- A = Cross-sectional area of the wire
Since resistivity is a constant for a given material at a specific temperature, changing the length of the wire does not affect its resistivity. Therefore, regardless of how long or short the wire is, the resistivity remains the same.
To represent this relationship graphically:
- On the x-axis, we will plot the length of the wire (l).
- On the y-axis, we will plot the resistivity (ρ).
The graph that Raman should draw will look like a horizontal line parallel to the x-axis. This indicates that resistivity (ρ) is constant regardless of the length (l) of the wire.
- The graph will show a constant value of resistivity (ρ) for varying lengths (l).
Topper's Solved these Questions
Similar Questions
Knowledge Check
The graph between applied force and change in the length of wire within elastic limit is a
Astraight line with positive slopeBstraight line with negative slopeCcurve with positive slopeDcurve with negative slopeThe graph between applied force and change in the length of wire within elastic limit is a
Astraight line with positive slopeBstraight line with negative slopeCcurve with positive slopeDcurve with negative slopeThe resistivity of a wire is ρ, its volume is 3m3 and resistance is 3Ω, then its length will be
A3ρB3√ρC√3ρDρ√3
Draw a schematic graph showing how the rate of first order reaction changes with change in concentration of reactants.
View SolutionIn a potentiometer experiment, if the area of cross-section of the wire increases uniformly from one end to another, draw a graph showing how potential gradient would vary as the length of the wire increases from one end.
View SolutionA wire of resistivity ρ is stretched to twice its length. What will be its new resistivity ?
View SolutionA wire of resistivity ρ is stretched to double its length. What is its new resistivity ?
View SolutionIf a wire of resistivity ρ is stretched to double its length then its new resistivity will
View Solution
