The graph below shows the observed standard electrode potential of some transition elements.
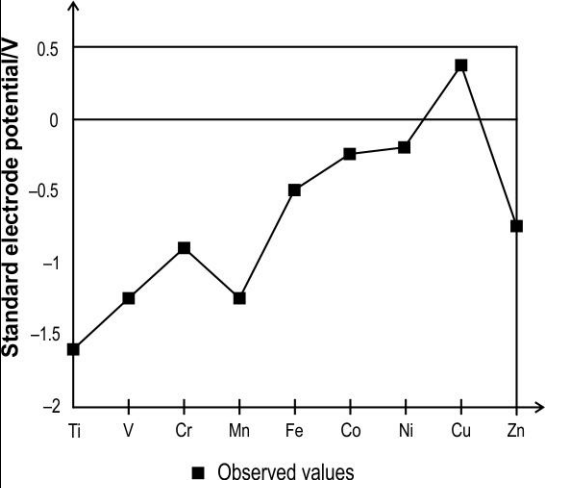
Which of the following reactions can be predicted based on the graph above?
Cu+2H2SO4→CuSO4+SO2+2H2O
Cu+2HNO3→Cu(NO3)2+H2
CuO+2HCl→CuCl2+H2O
Cu2++2NaOH→Cu(OH)2+2Na+
Step by step video & image solution for The graph below shows the observed standard electrode potential of some transition elements. Which of the following reactions can be predicted based on the graph above? by Chemistry experts to help you in doubts & scoring excellent marks in Class 12 exams.
Updated on:21/07/2023Topper's Solved these Questions
Similar Questions
Knowledge Check
The perimeter of two similar triangles are 30cm and 20cm respectively. If one side of the first triangle is 9 cm. Determine the corresponding side of the second triangle.
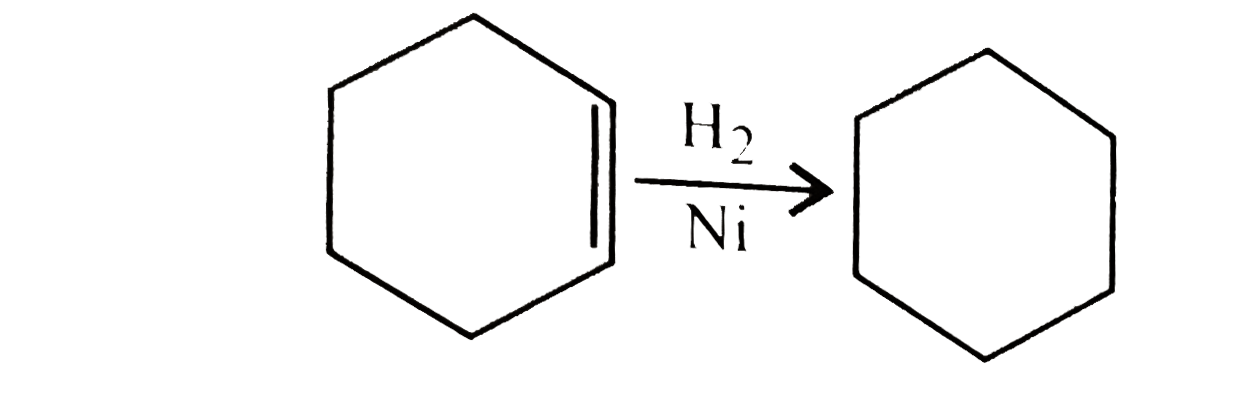
A13.5B6C15D5Which of the following is correct graph for the reaction?
 A
A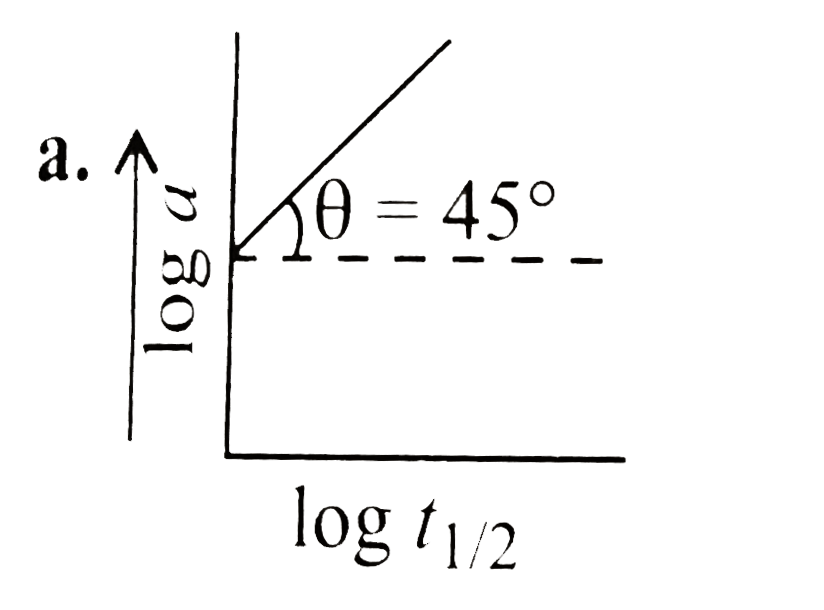 B
B C
C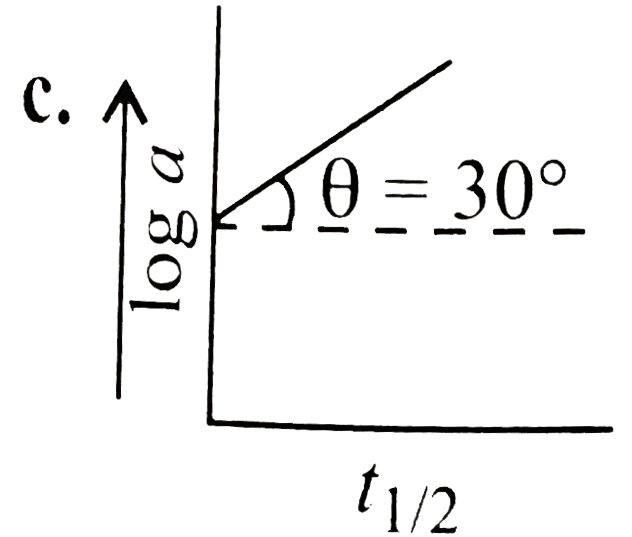 D
D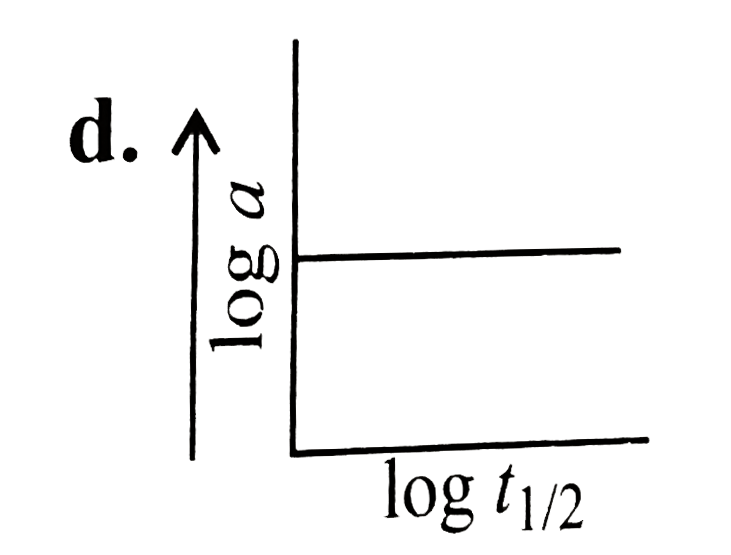
Which of the following configuration show transition element :-
A[Rn]6d27s2B[Xe]4t75d16s2C[Xe]5d16s2D[Rn]5f76d17s2
The following graph show that the reaction is:
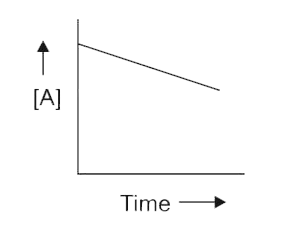
View SolutionFigure below shows the velocity-time graph of a one dimensional motion. Which of the following characteristic of the particle is represented by the shaded area?
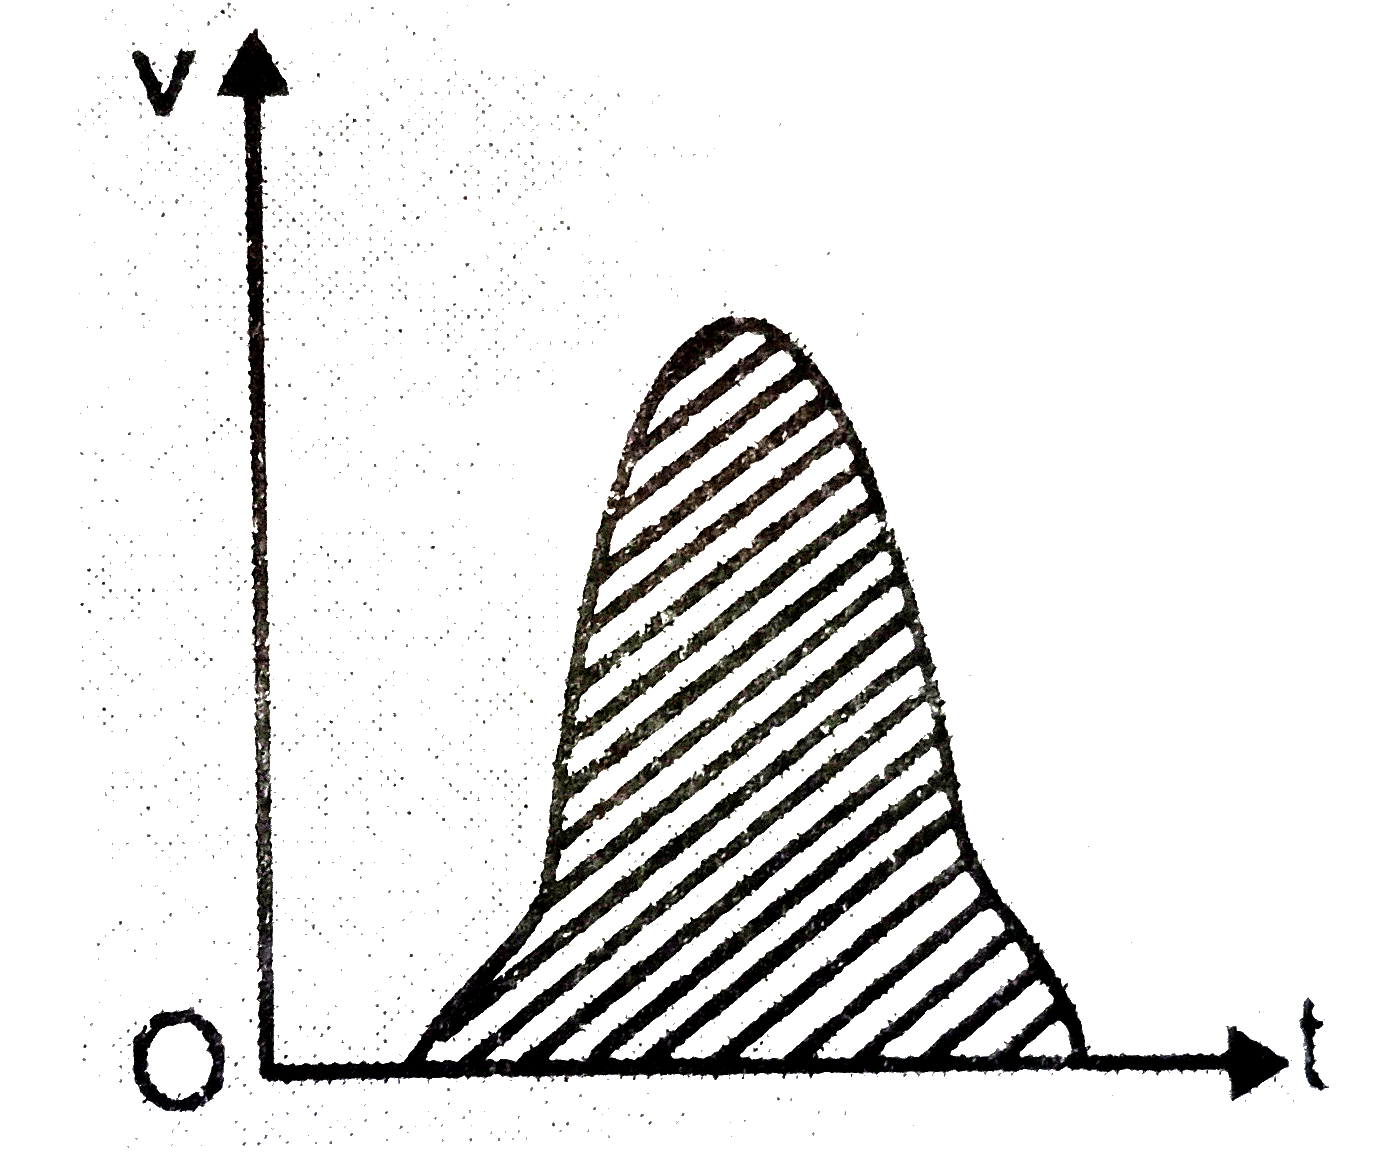
View SolutionWhich of the following graphs show the v−t graph of a ball thrown upwards ?
View Solution
With refernce to above graph, which of the following is/are incorrect ?
View SolutionMetallic radii of some transition elements are given below.

Which of these elements will have highest density ?
View Solution

