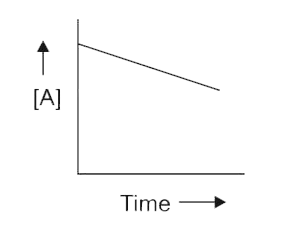
The following graph show that the reaction is:
A
zero order
B
first order
C
second order
D
fractional order
Video Solution
Text Solution
The correct Answer is:A
|
Answer
Step by step video, text & image solution for The following graph show that the reaction is: by Chemistry experts to help you in doubts & scoring excellent marks in Class 12 exams.
Updated on:21/07/2023
Topper's Solved these Questions
- BOOK - CBSE COMPLEMENTARY MATERIALCHAPTER - CHEMICAL KINETICSEXERCISE - VERY SHORT ANSWER TYPE QUESTIONS24videos
CHEMICAL KINETICS
- BOOK - CBSE COMPLEMENTARY MATERIALCHAPTER - CHEMICAL KINETICSEXERCISE - SHORT ANSWER-I TYPE QUESTIONS26videos
CHEMICAL KINETICS
- BOOK - CBSE COMPLEMENTARY MATERIALCHAPTER - BIOMOLECULESEXERCISE - SHORT ANSWER-II TYPE QUESTION13videos
BIOMOLECULES
- BOOK - CBSE COMPLEMENTARY MATERIALCHAPTER - CHEMISTRY IN EVERYDAY LIFEEXERCISE - LONG ANSWER TYPE QUESTIONS2videos
CHEMISTRY IN EVERYDAY LIFE
Similar Questions
Knowledge Check
- Question 1 - Select One
The following graph shows the
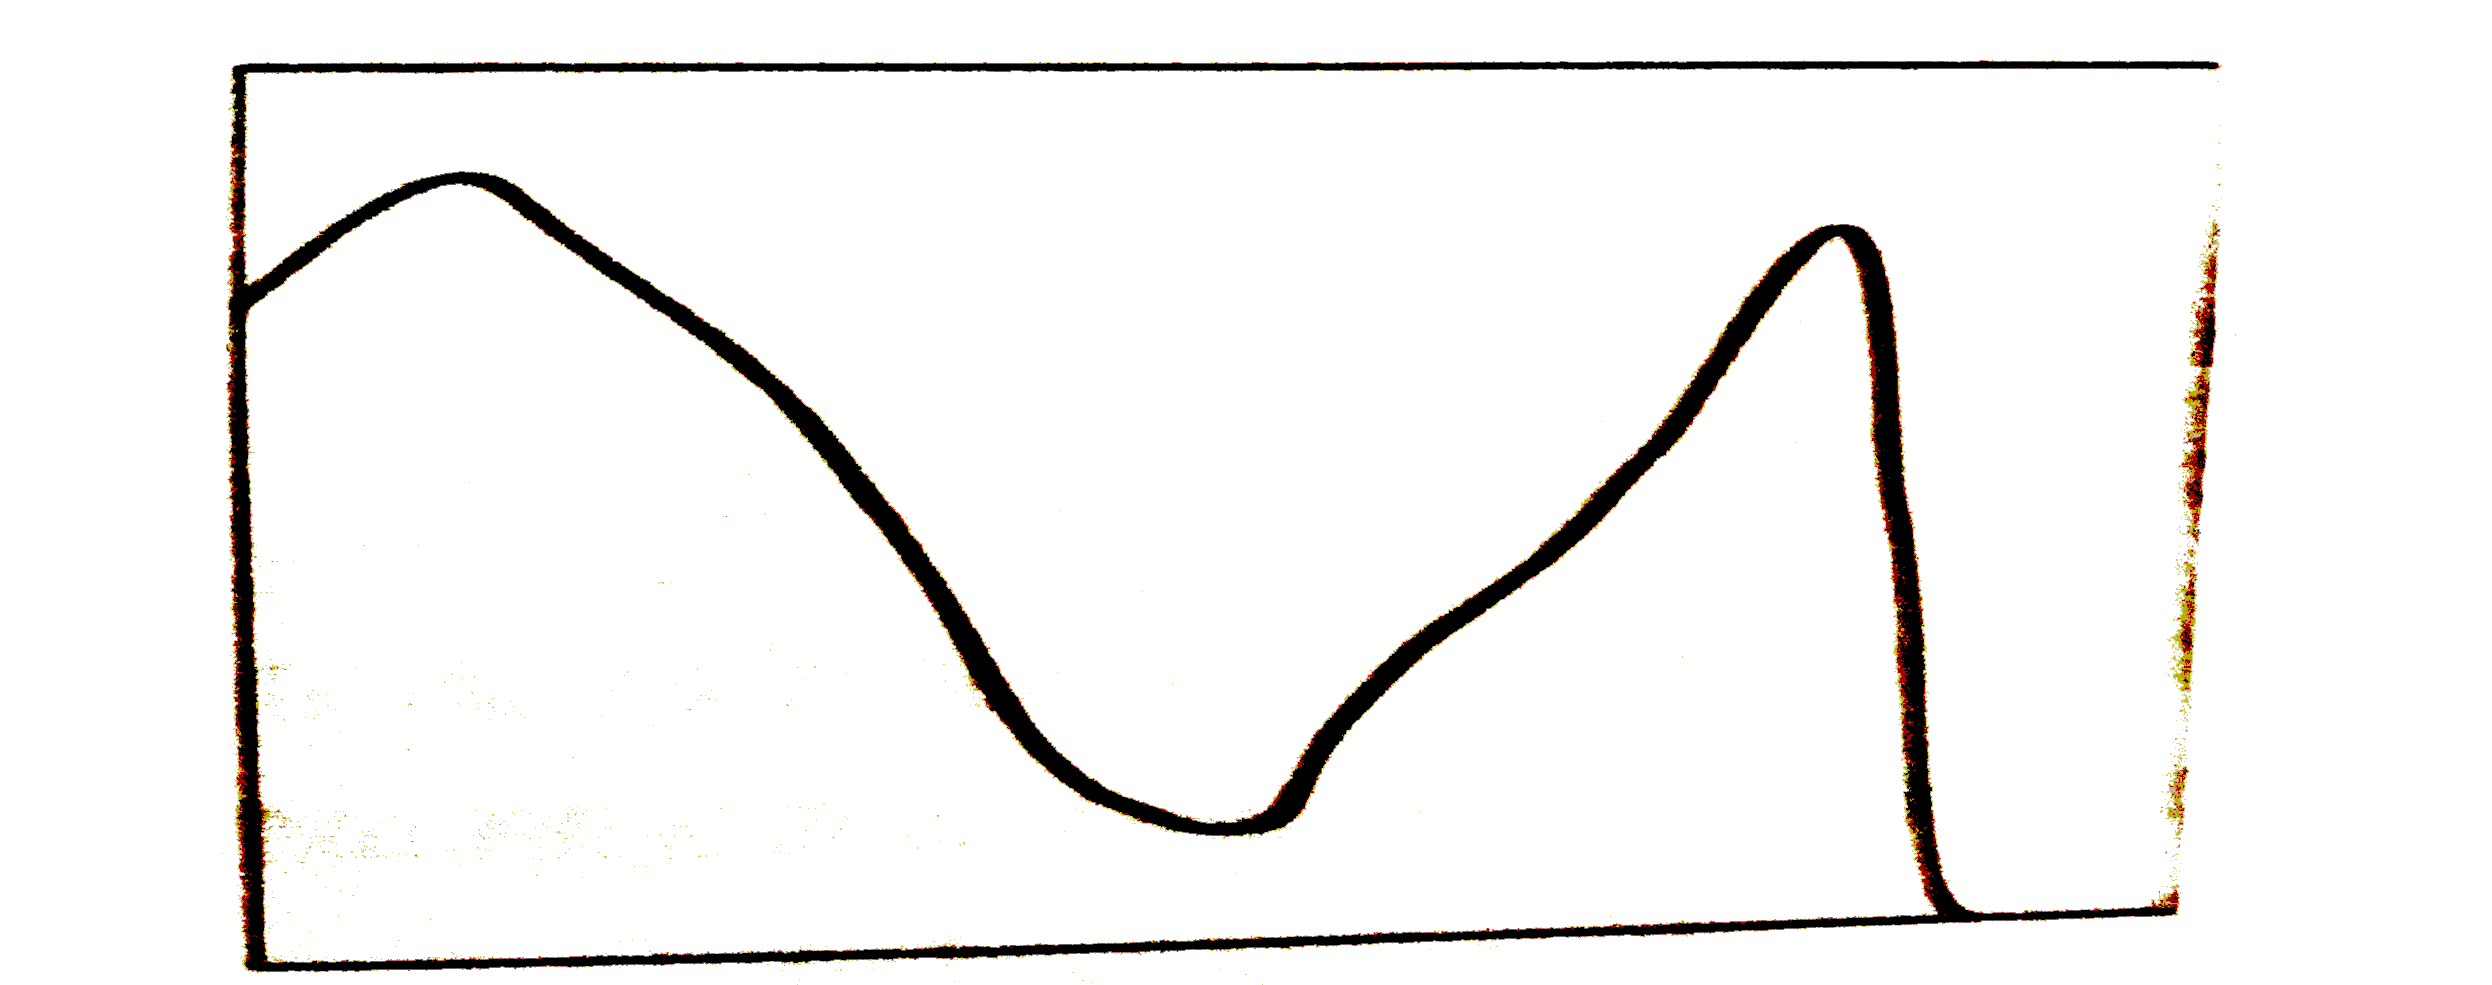 AAbsorption spectrum of chlorophyll aBAbsorption spectrum of chlorophyll bCAction spectrum of photosynthesisDBoth A and B
 - Question 2 - Select One
Which of the following graph shows the variationi of density of water increase in temperature ?
A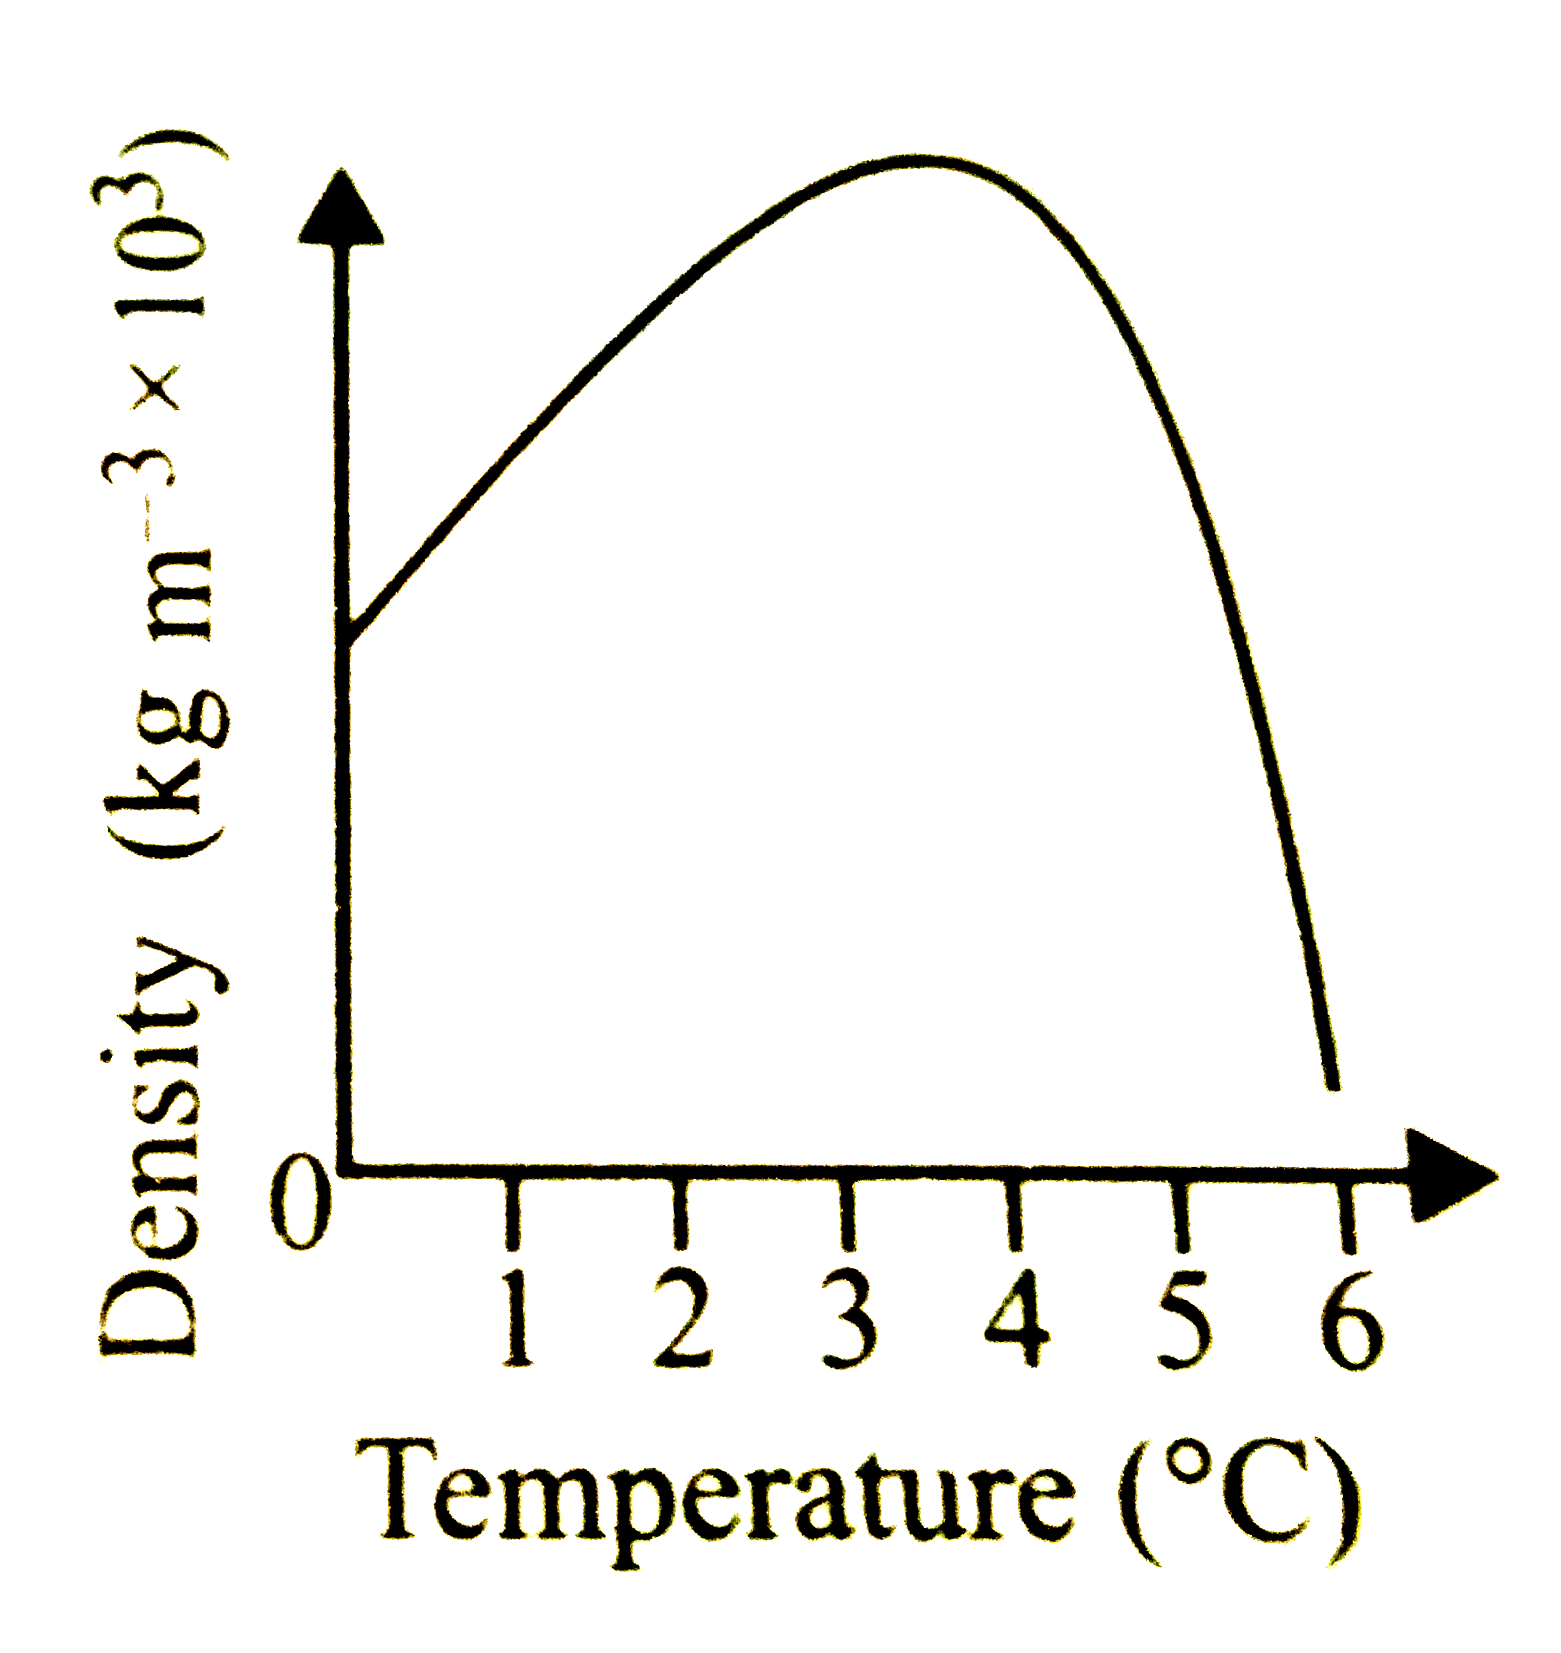 B
B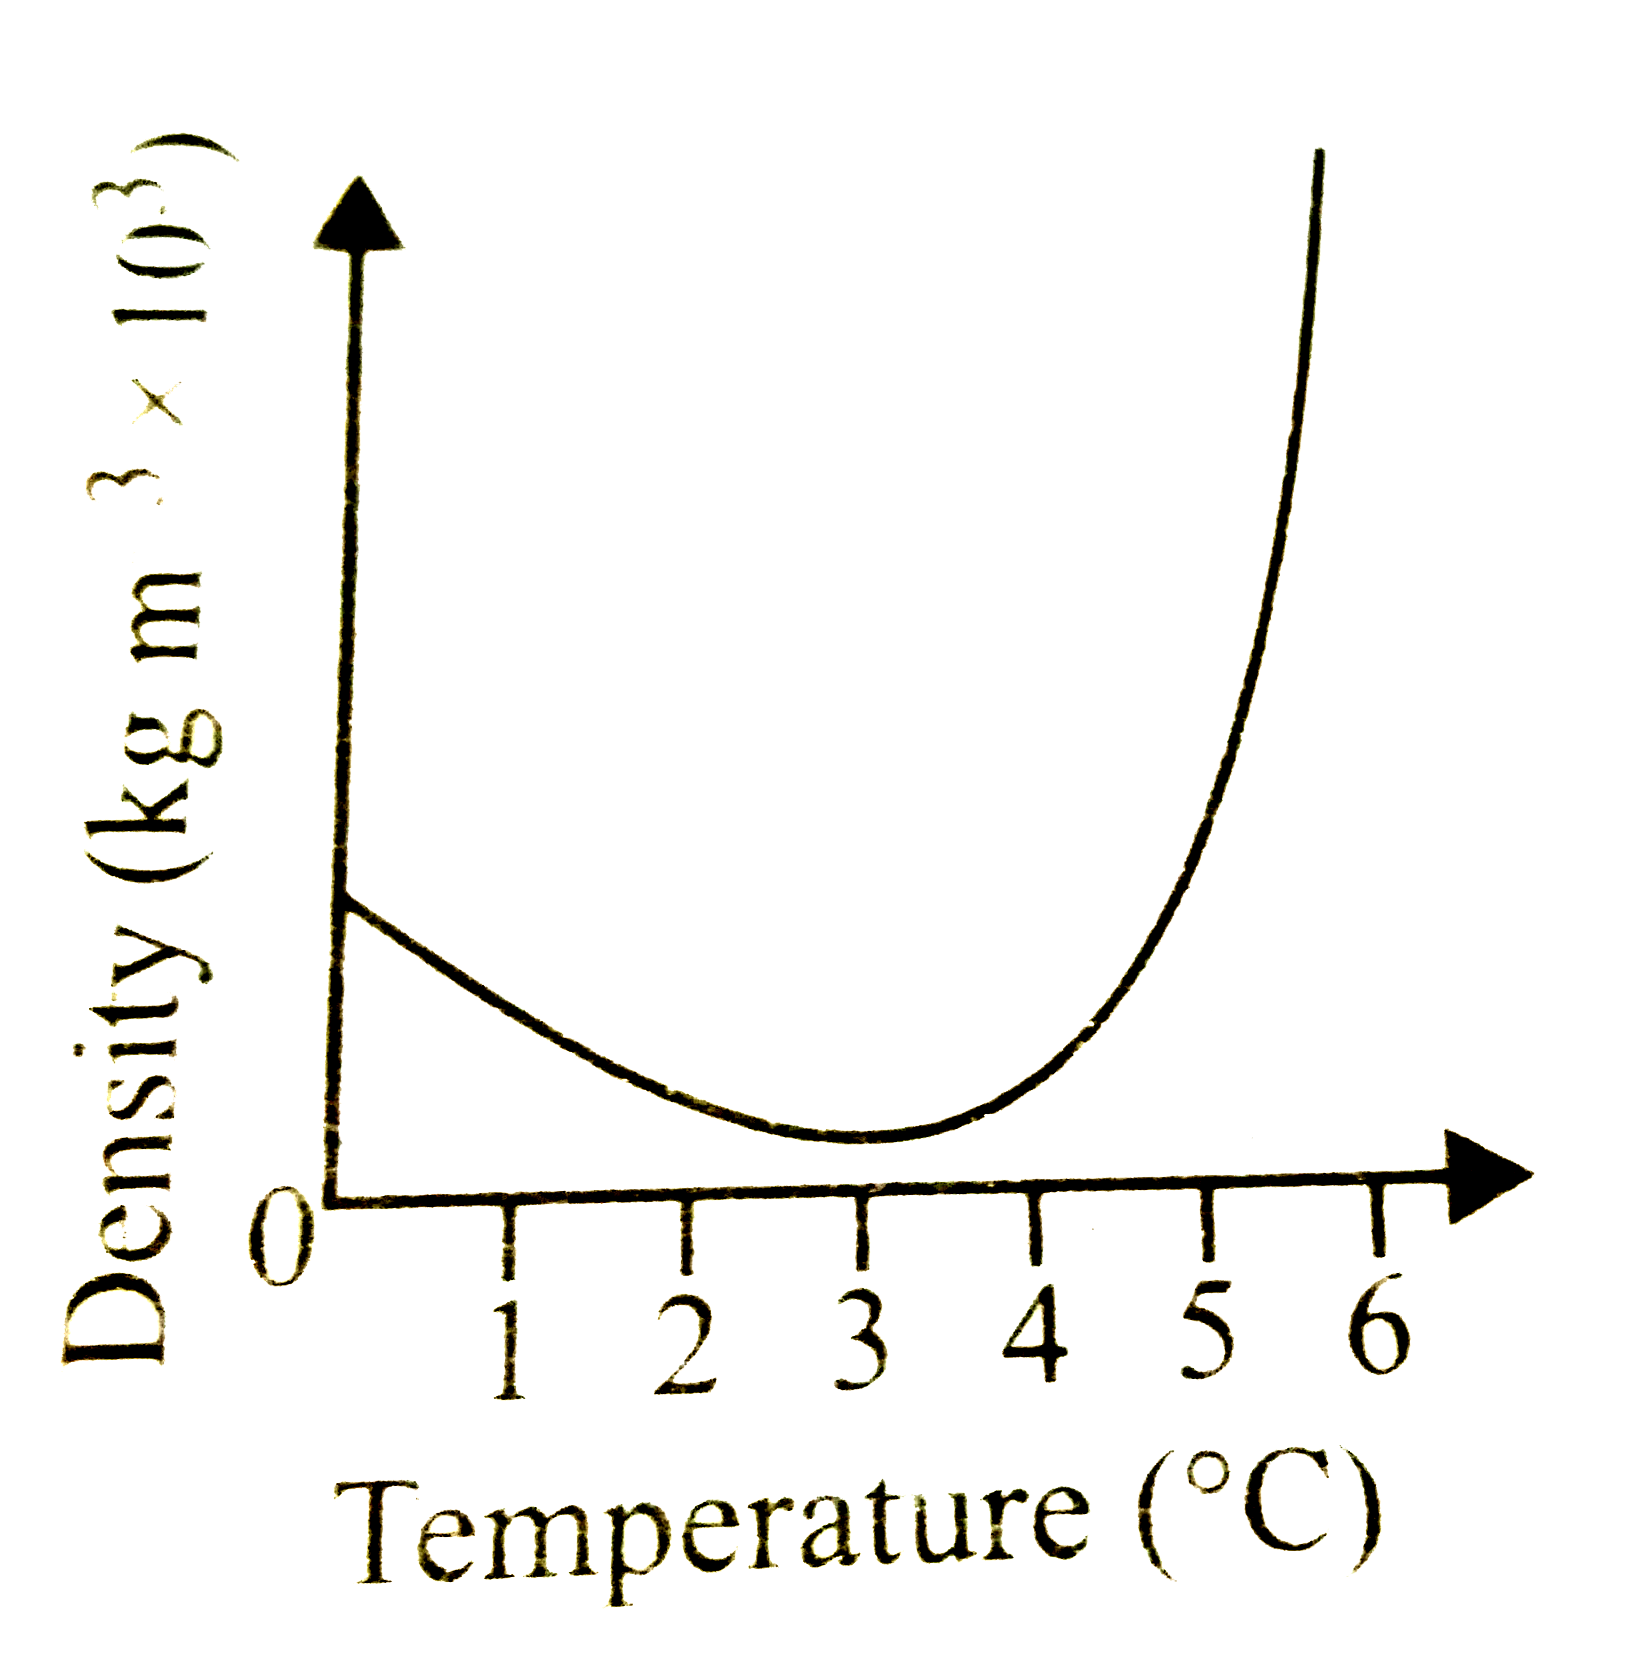 C
C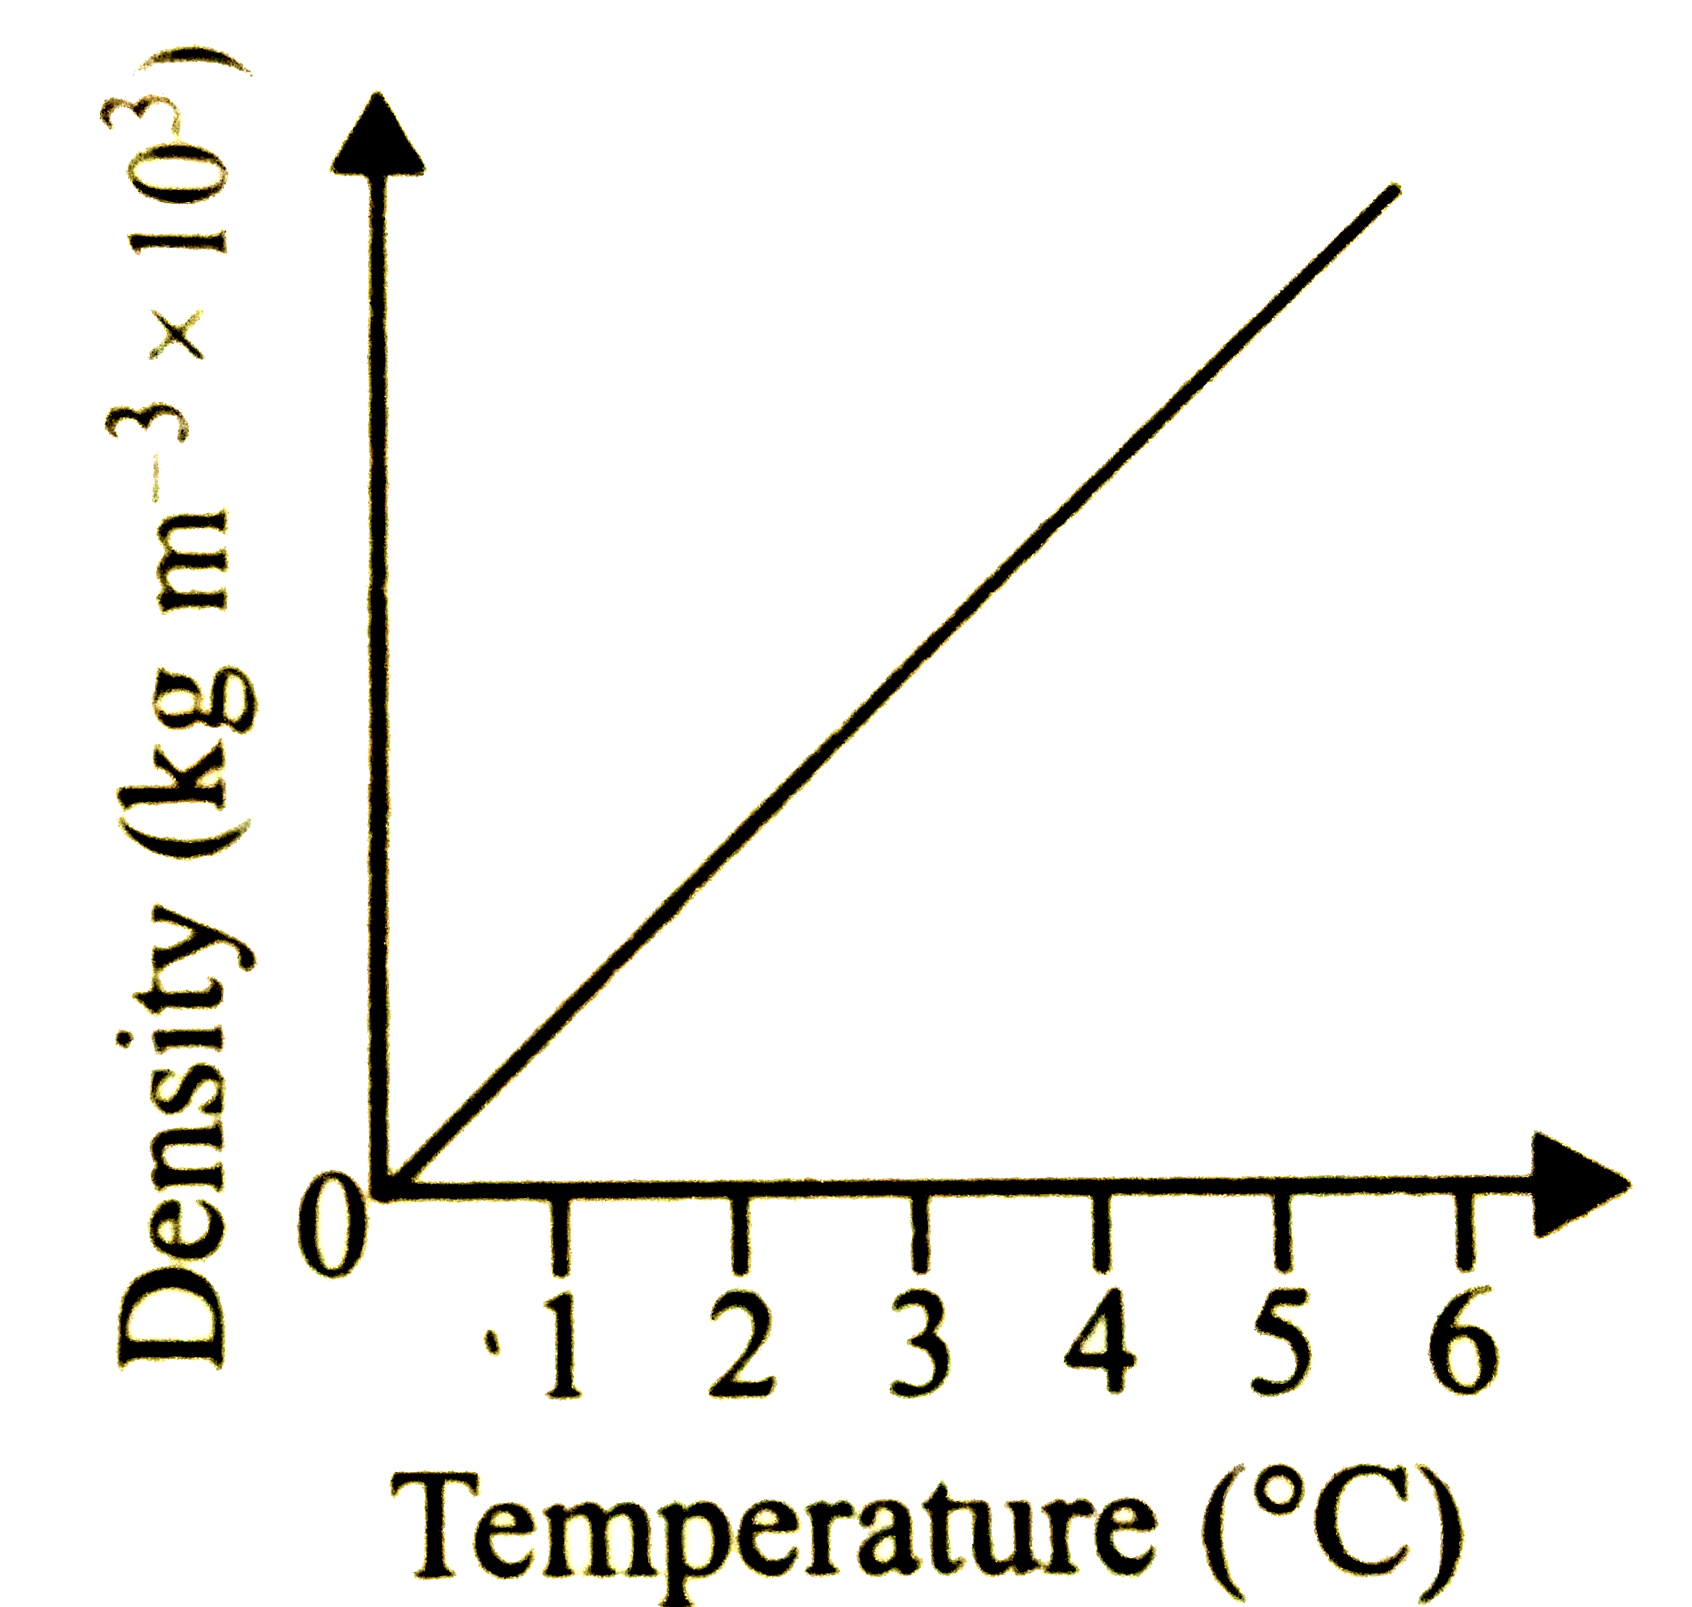 D
D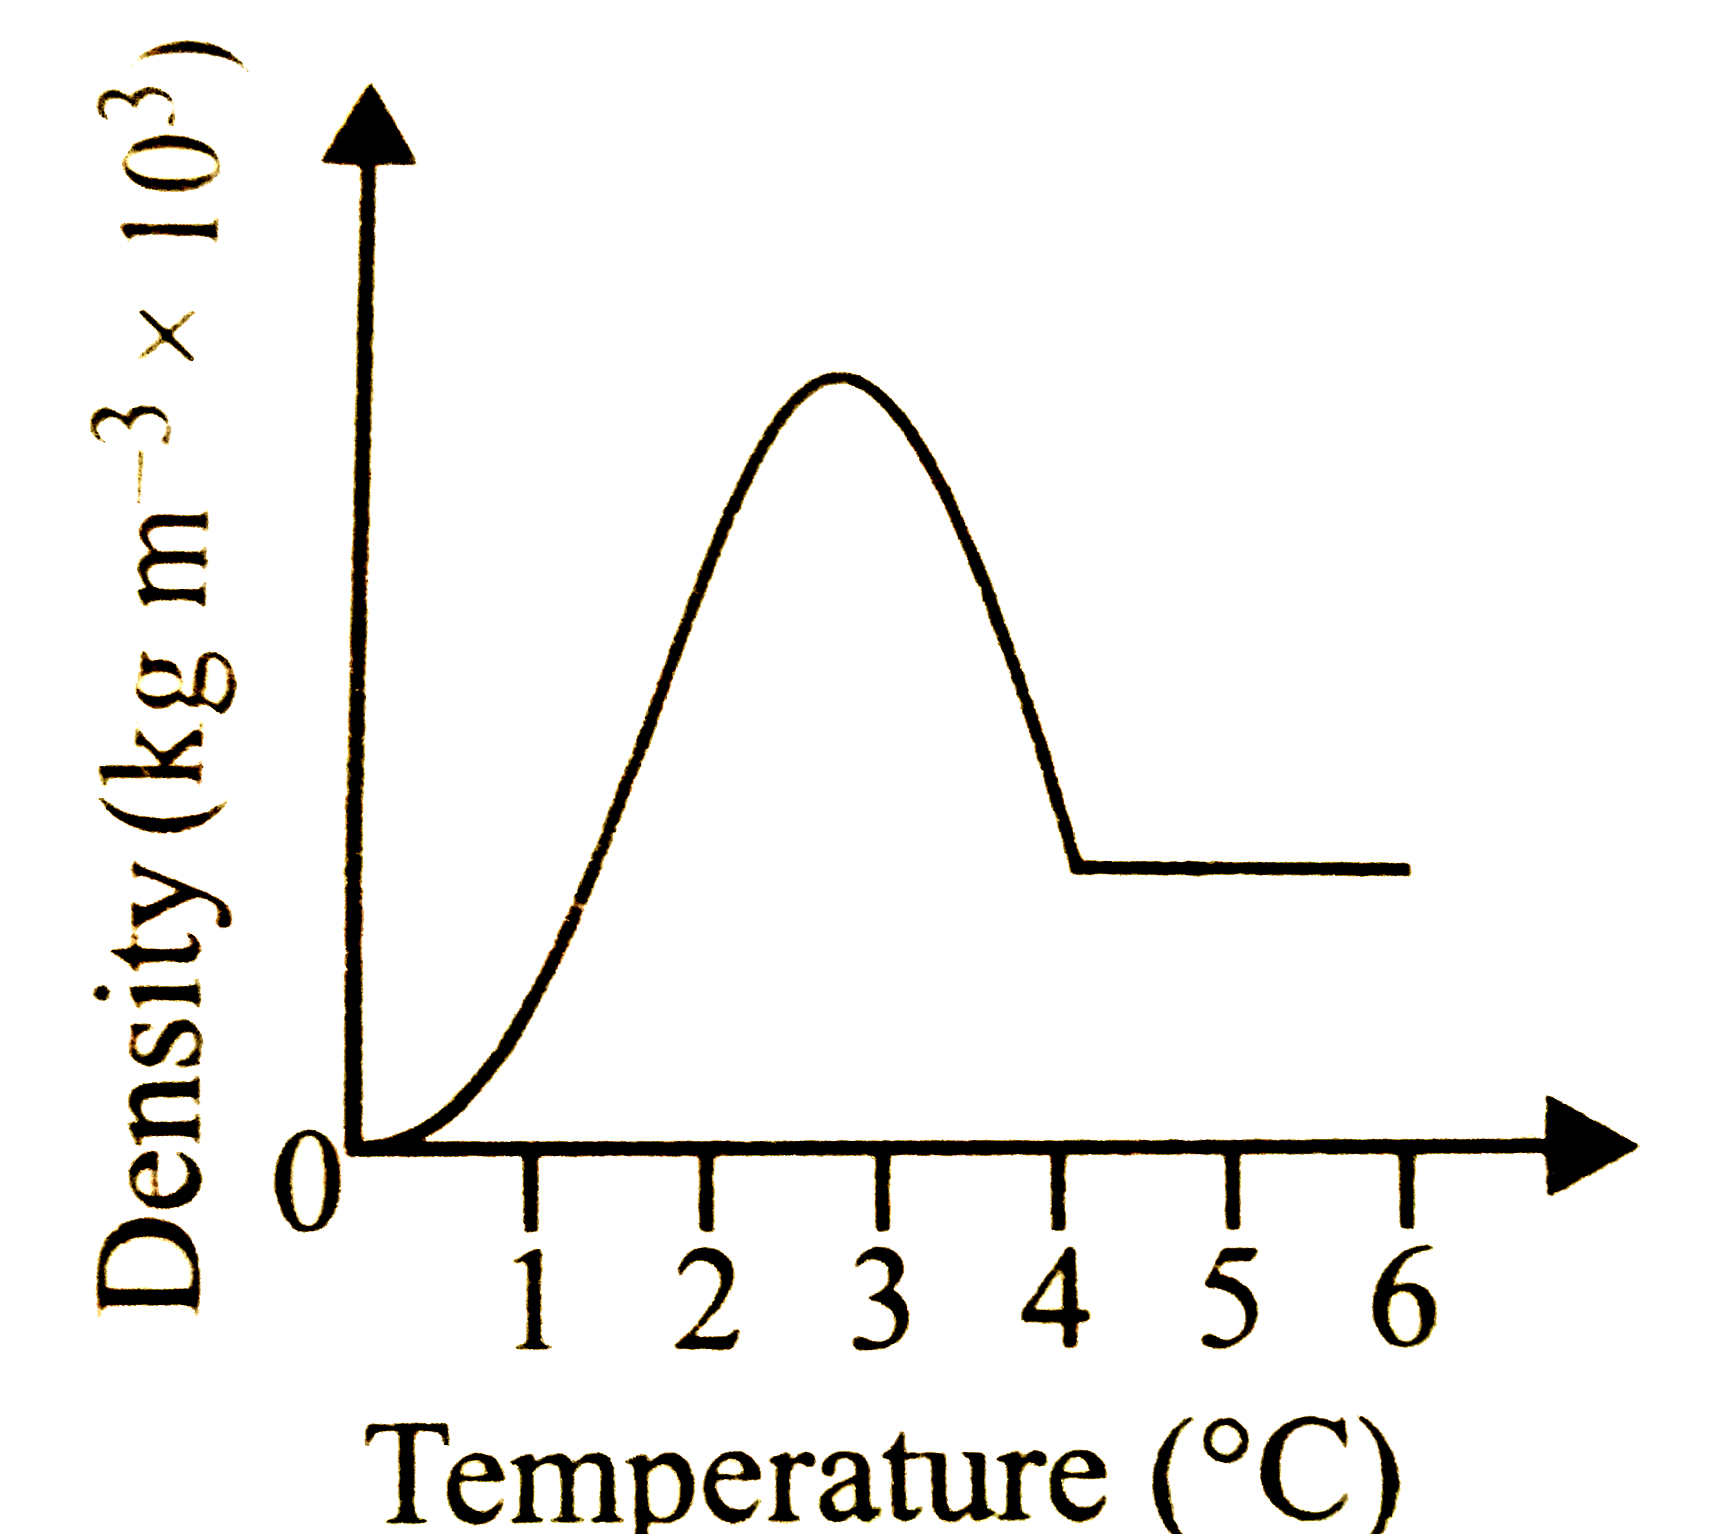
- Question 3 - Select One
The graph between the current and the time for an inductance coil is shown below. Which of the following graph show the voltage-time variation-
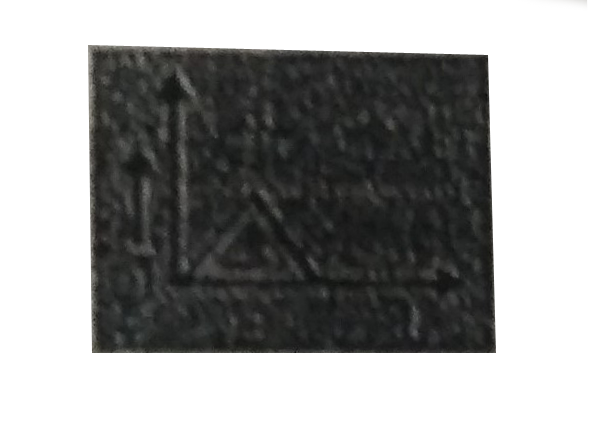 A
A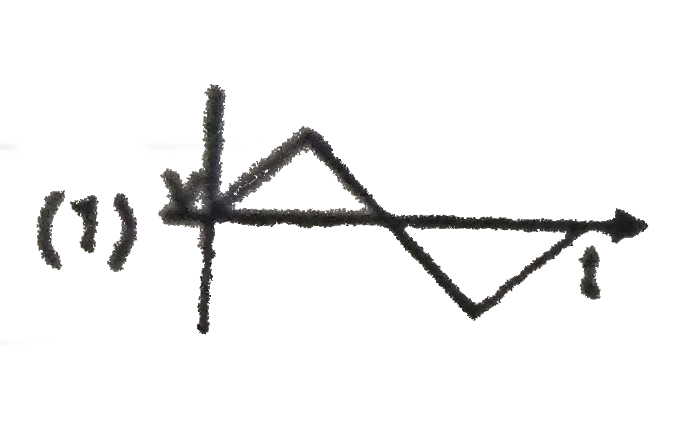 B
B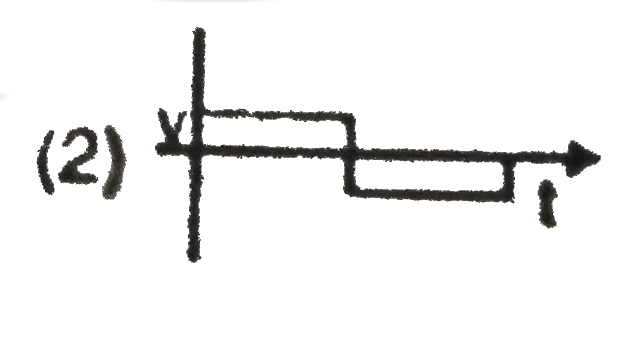 C
C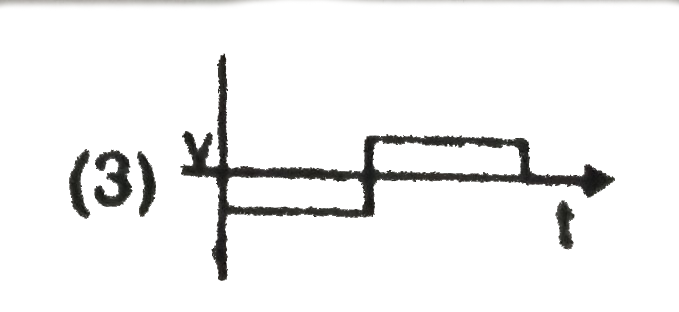 D
D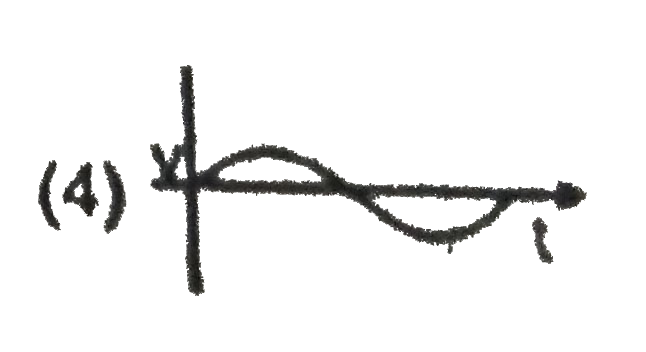
Which of the following graphs shows the correct description of effect of pH on enzyme activity?
View SolutionWhich of the following graphs show the v−t graph of a ball thrown upwards ?
View SolutionThe following graph shows the speed ofabody which is :
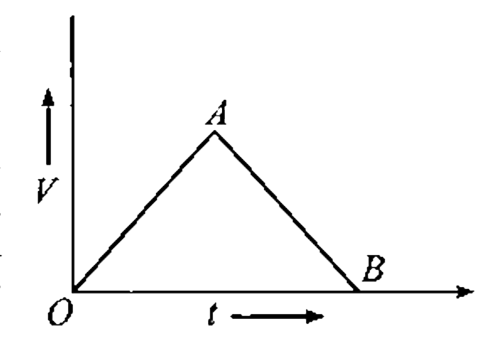 View Solution
Which of the following graphs is the characteristic of a zero order reaction ?
View SolutionWhich of the following is correct graph for the reaction?
 View Solution

