For three low density gases A, B, C pressure versus temperature graphs are plotted while keeping them at constant volume, as shown in the figure.
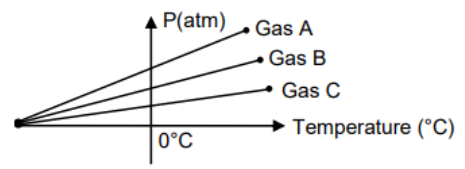
The temperature corresponding to the point K is :
The correct Answer is:D
Step by step video solution for For three low density gases A, B, C pressure versus temperature graphs are plotted while keeping them at constant volume, as shown in the figure.The temperature corresponding to the point K is : by Physics experts to help you in doubts & scoring excellent marks in Class 12 exams.
Updated on:21/07/2023Topper's Solved these Questions
Similar Questions
Knowledge Check
A thermodynamic process is shown in the figure. The pressure and volumes corresponding to some points in the figure are
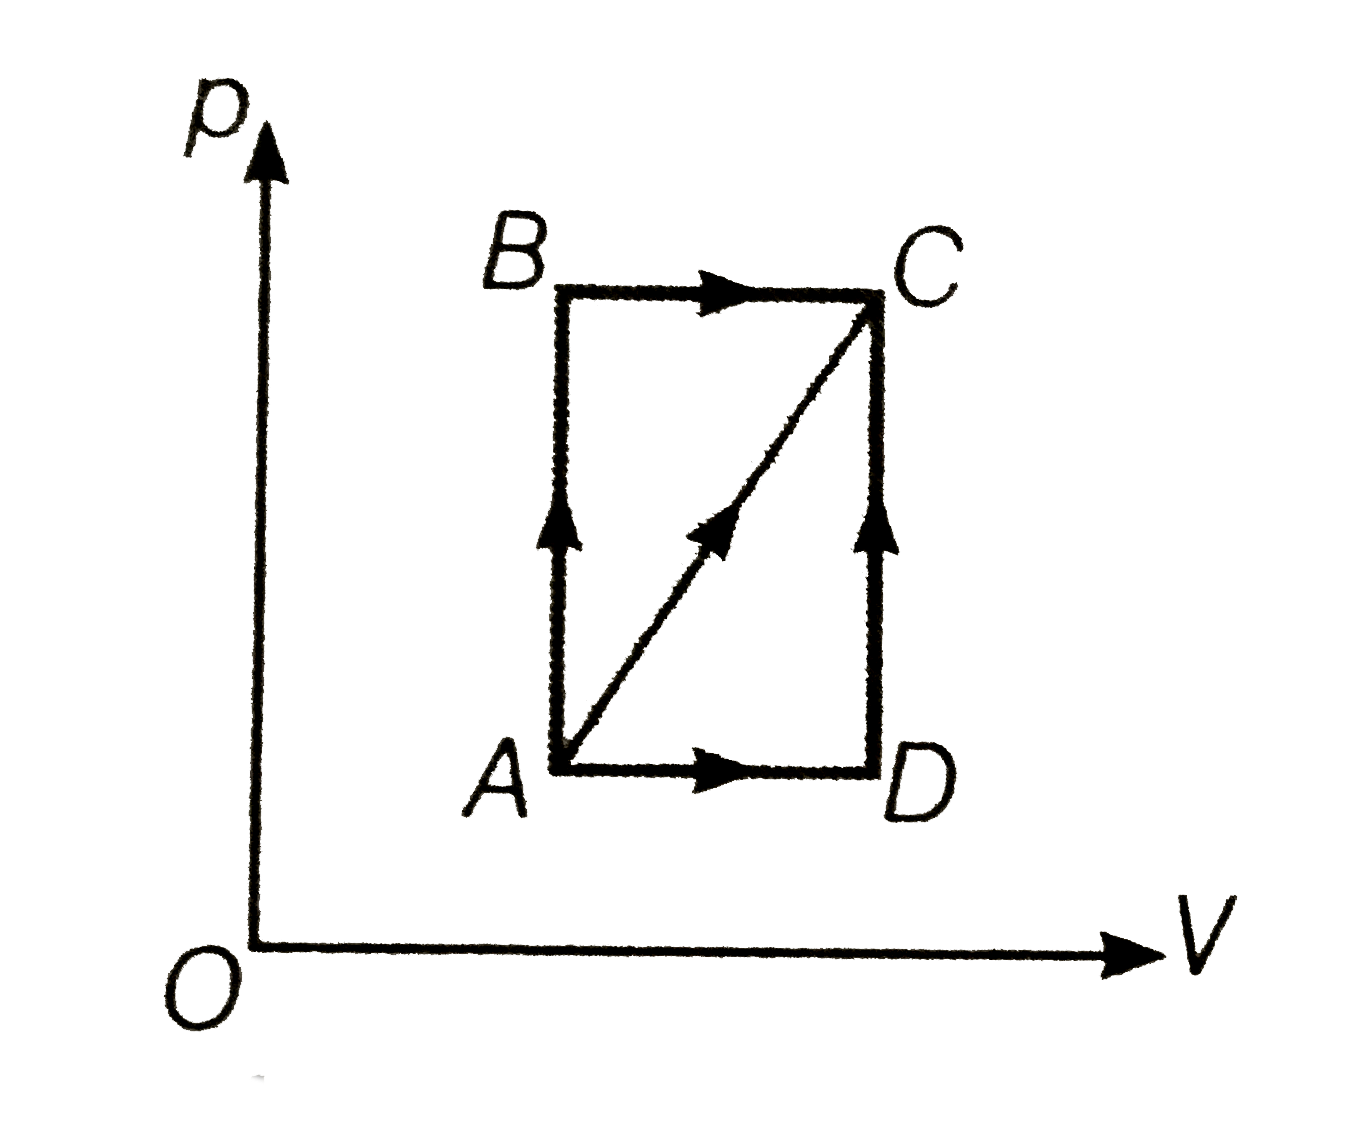 APA=3×10⁴ pa,BVA=2×10⁻³m3CPB=8×10⁴pa,DVB=5×10⁻³m3
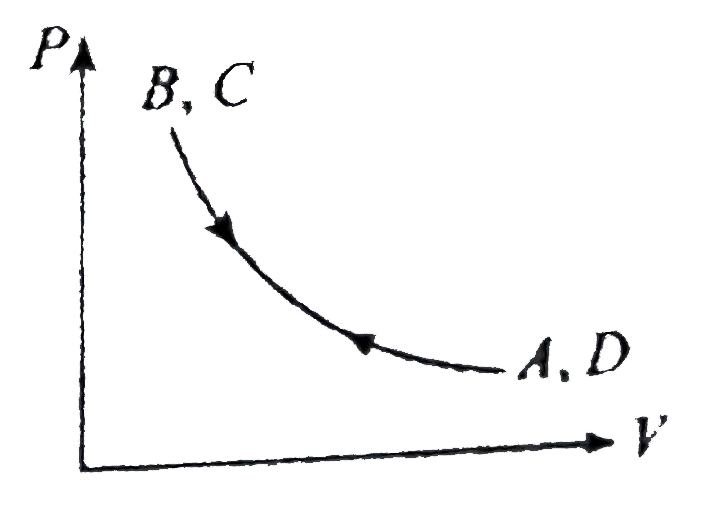
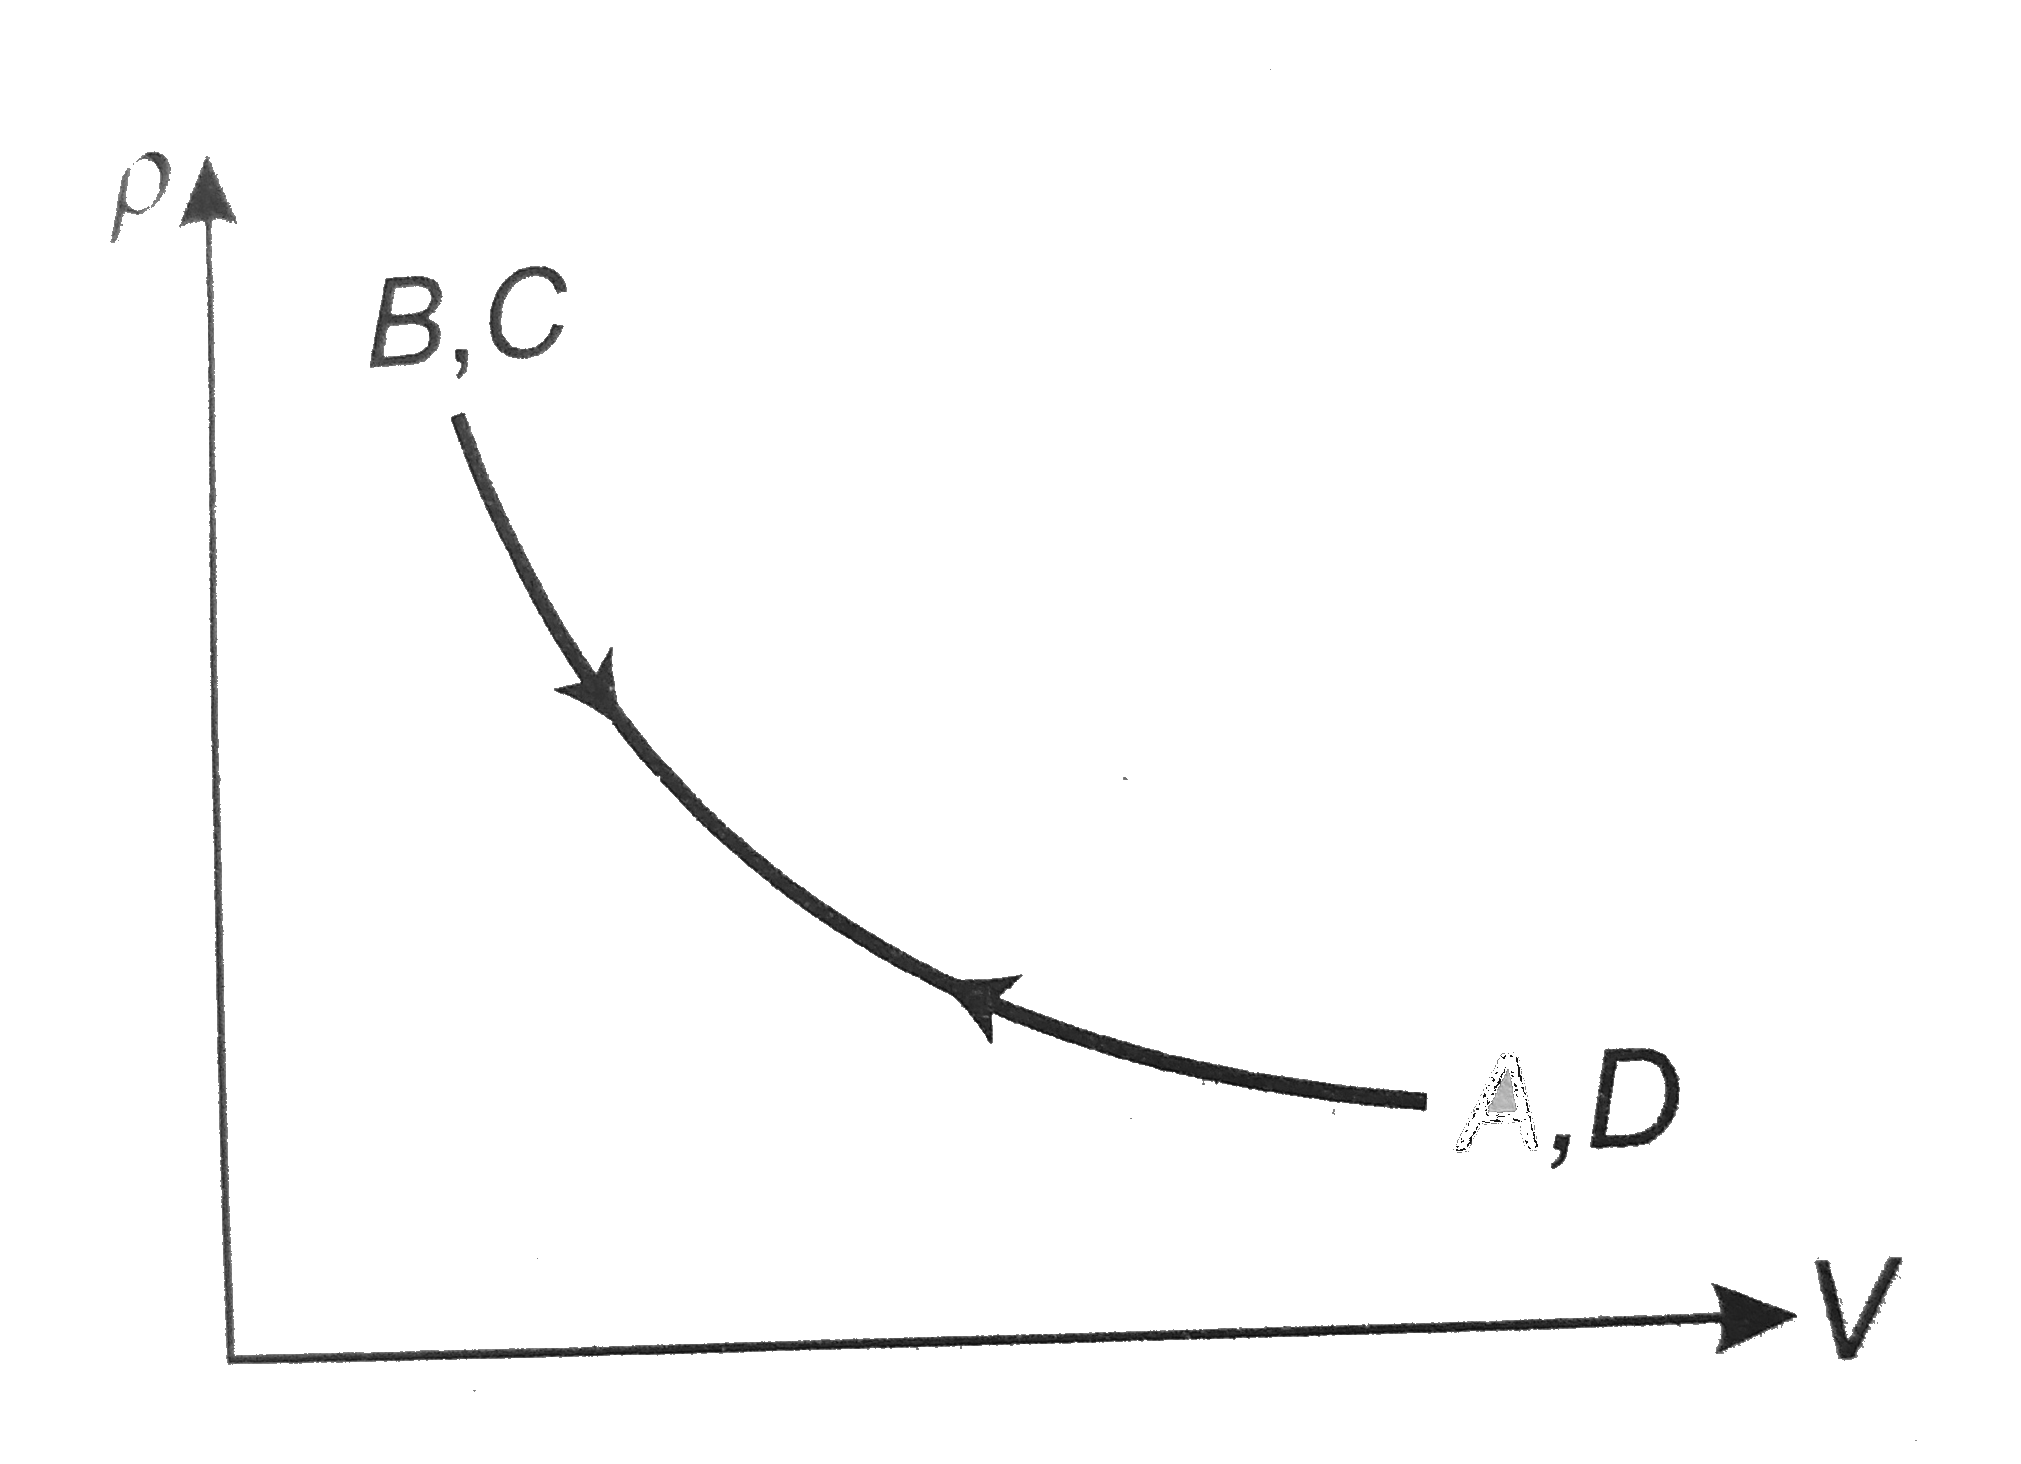
Density vs volume graph is shown in the figure . Find corresponding pressure vs temperature graph :
 A
A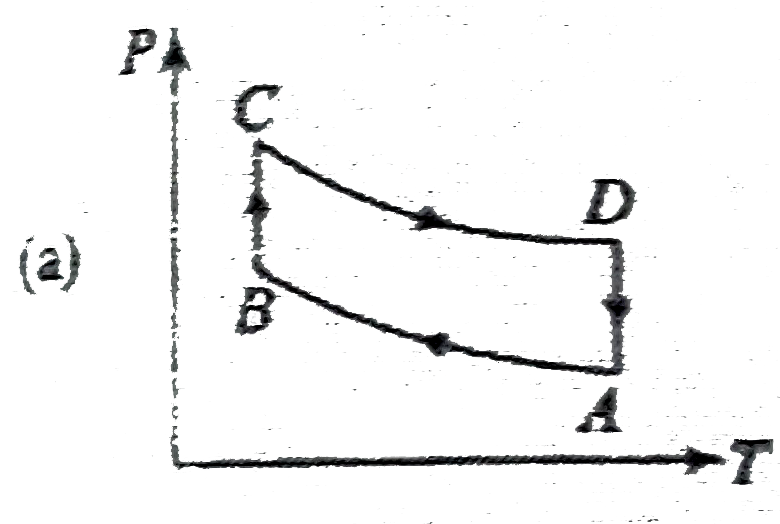 B
B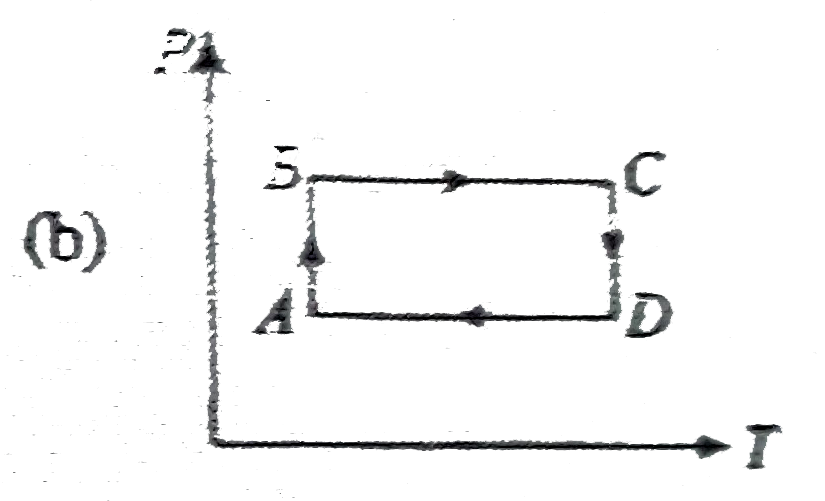 C
C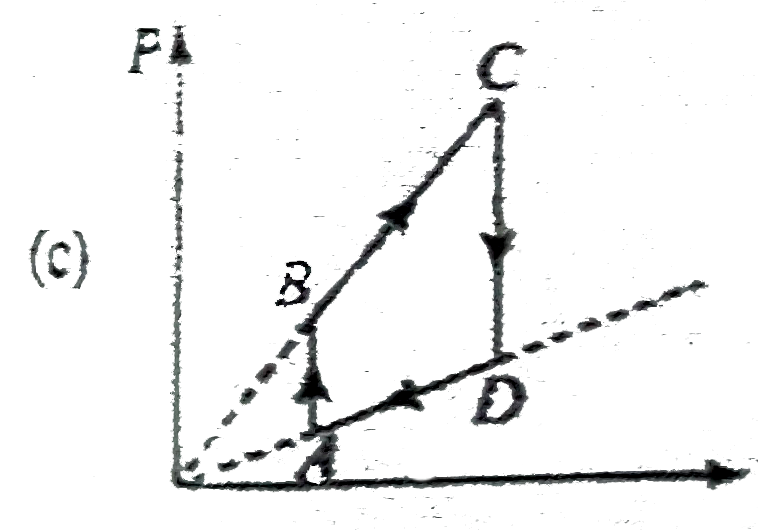 D
D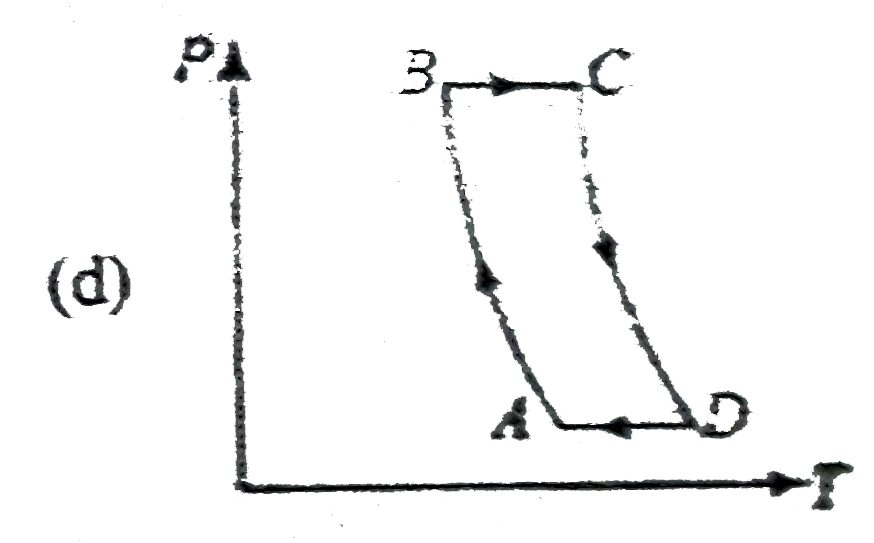
Density vs volume graph is shown in the figure. Find corresponding pressure vs temperature graph
 A
A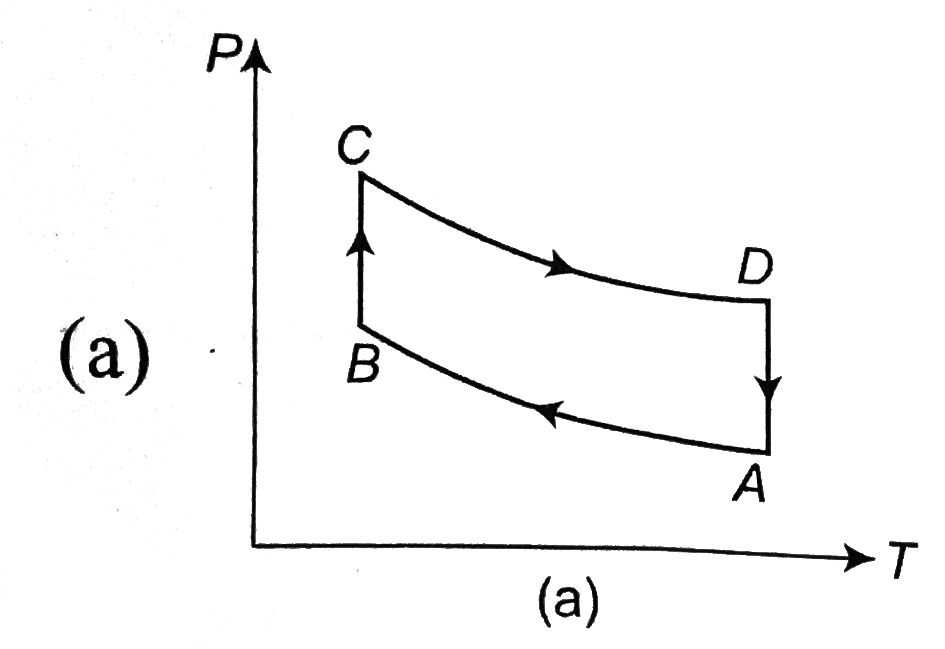 B
B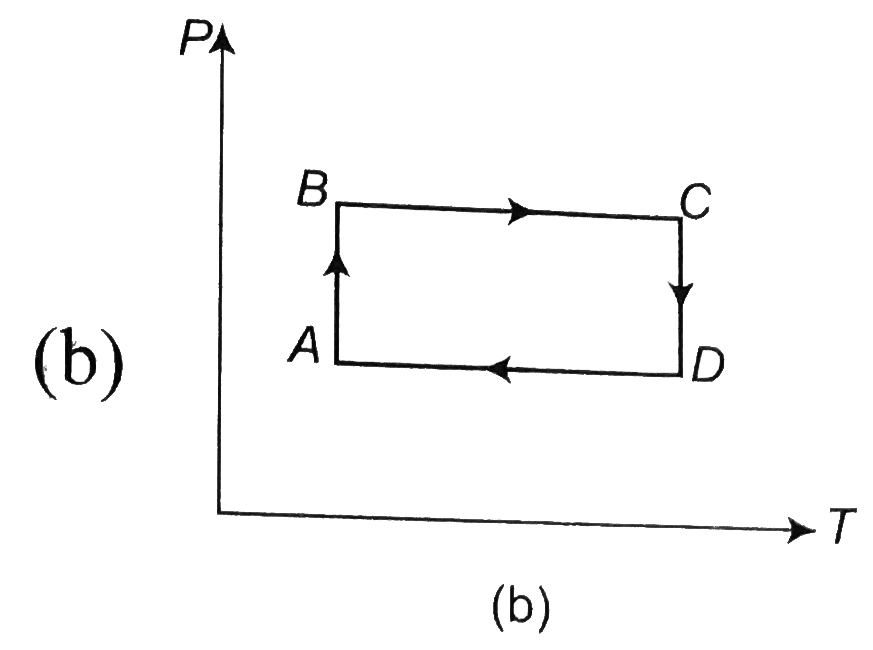 C
C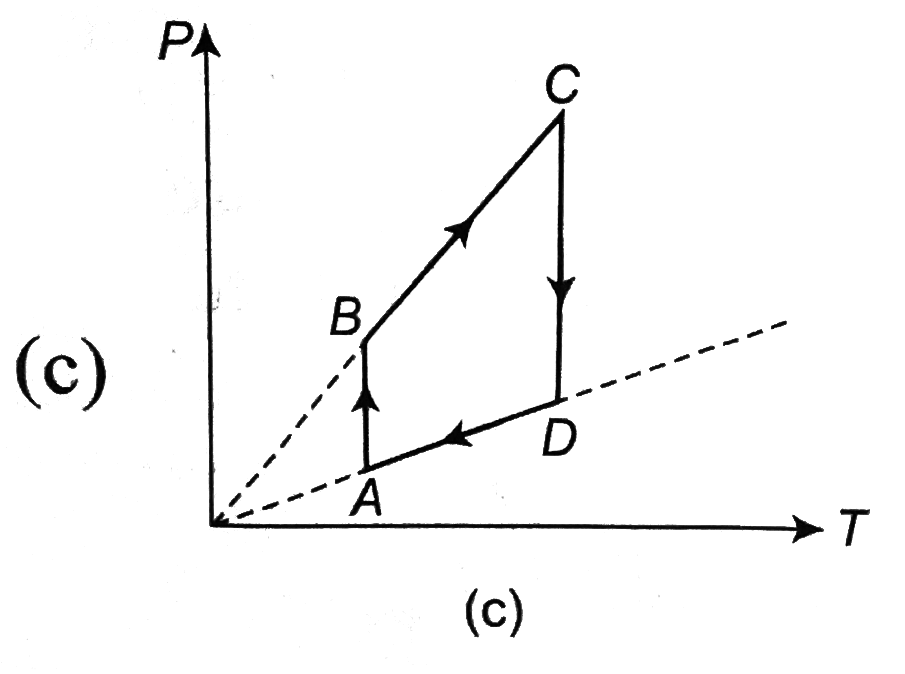 D
D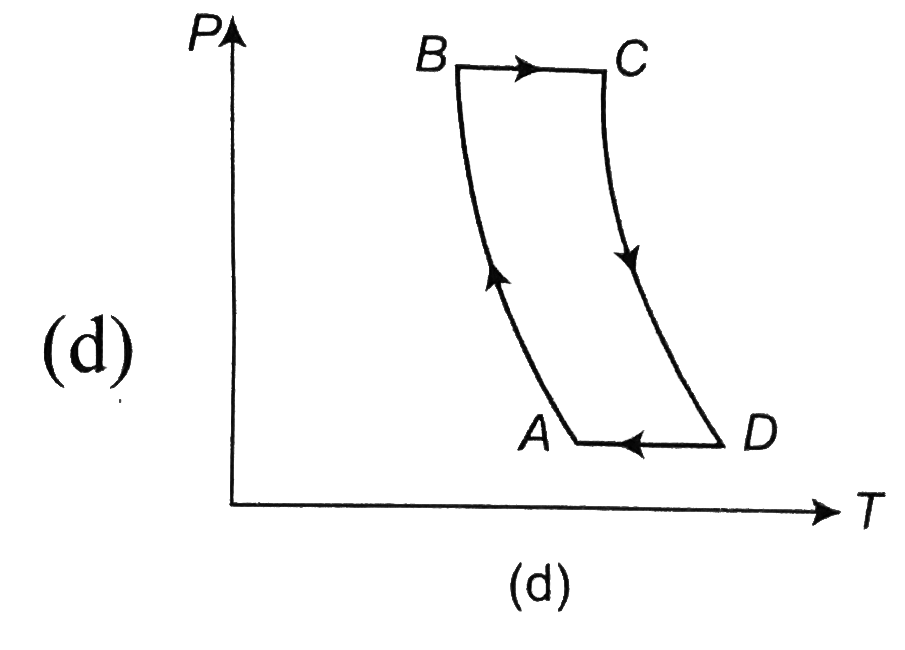
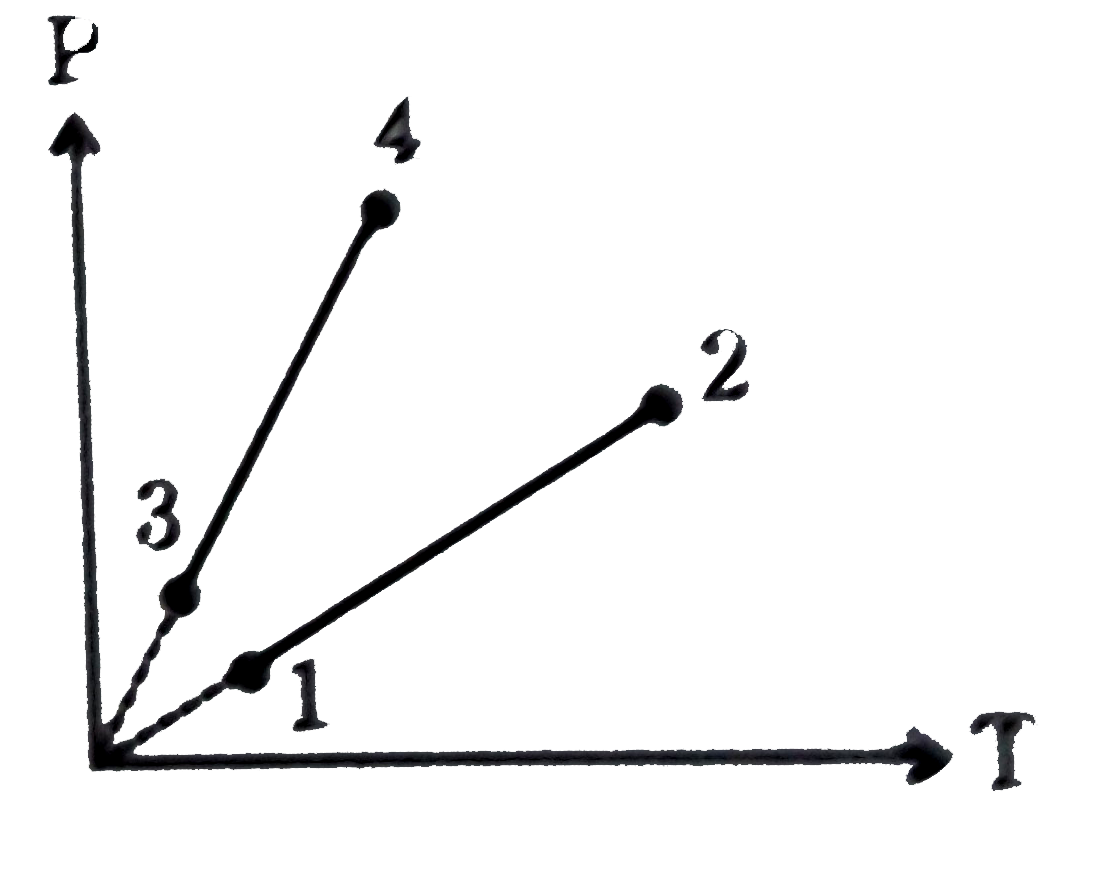
Pressure versus temperature graph of an ideal gas of equal number of moles of different volumes is plotted as shown in figure. Choose the correct alternatives.
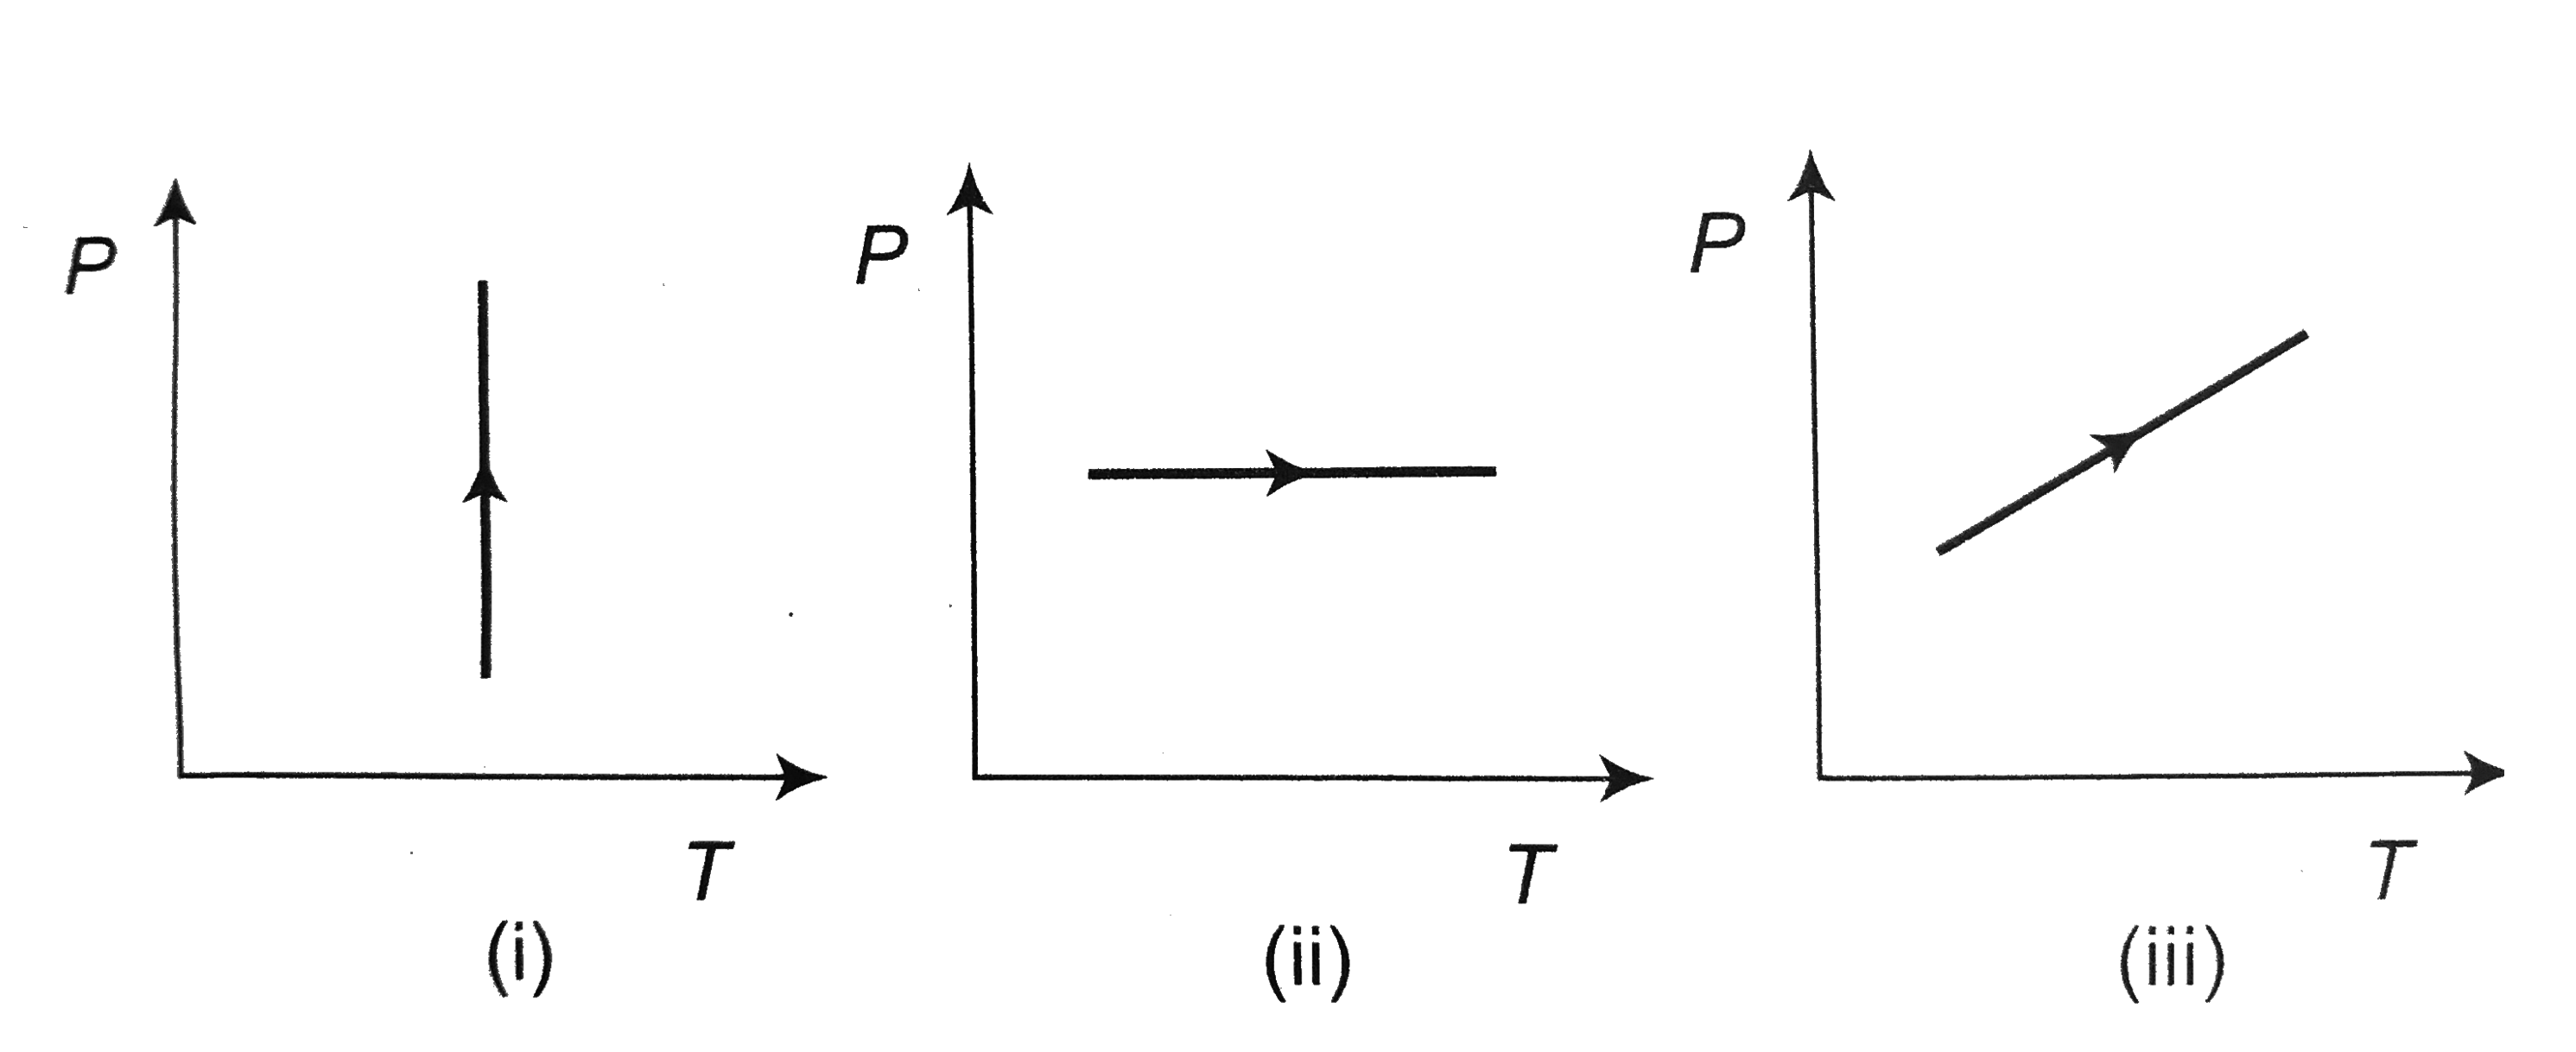
View SolutionPressure versus temperature graphs of an ideal gas are as shown in figure. Choose the wrong statement
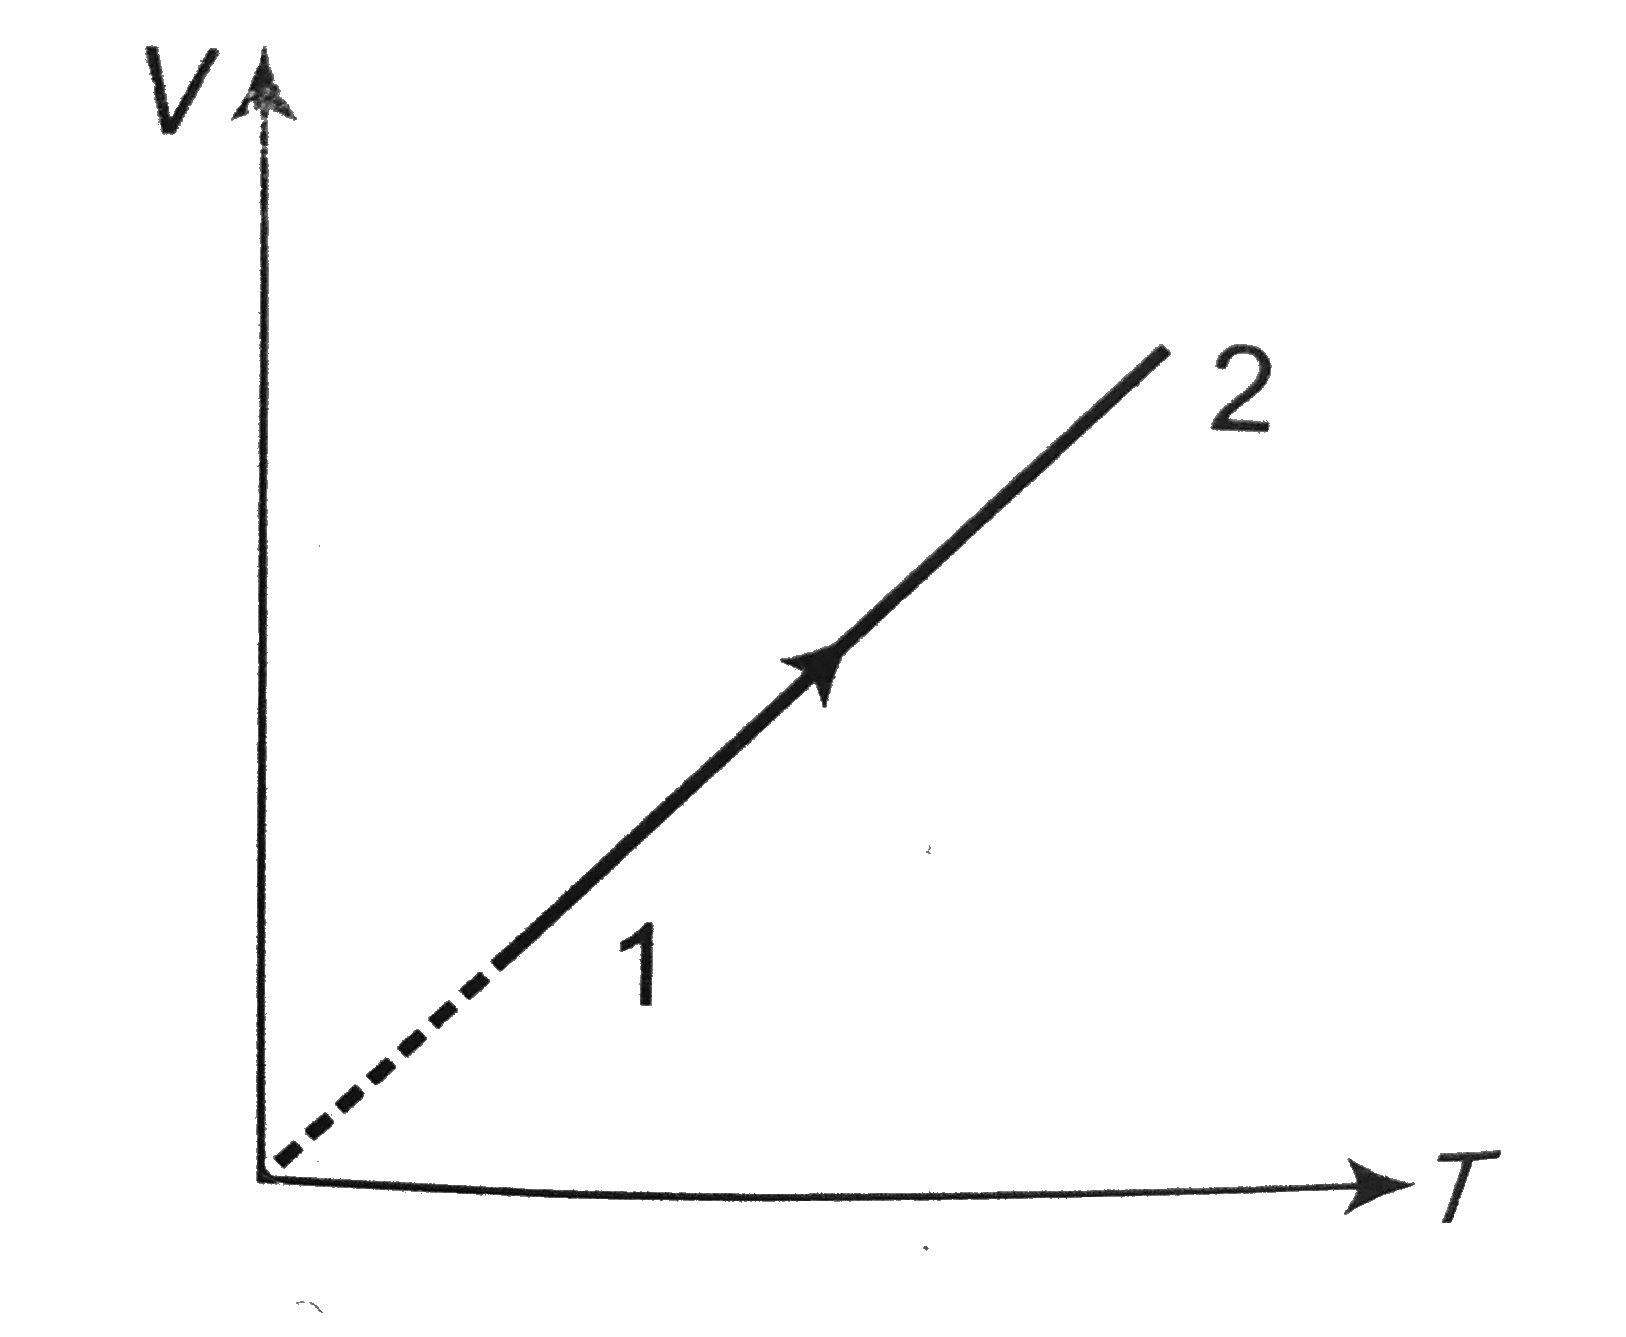
View SolutionVolume versus temperature graph of two moles of helium gas is as shown in figure. The ratio of heat absorbed and the work done by the gas in process 1−2 is
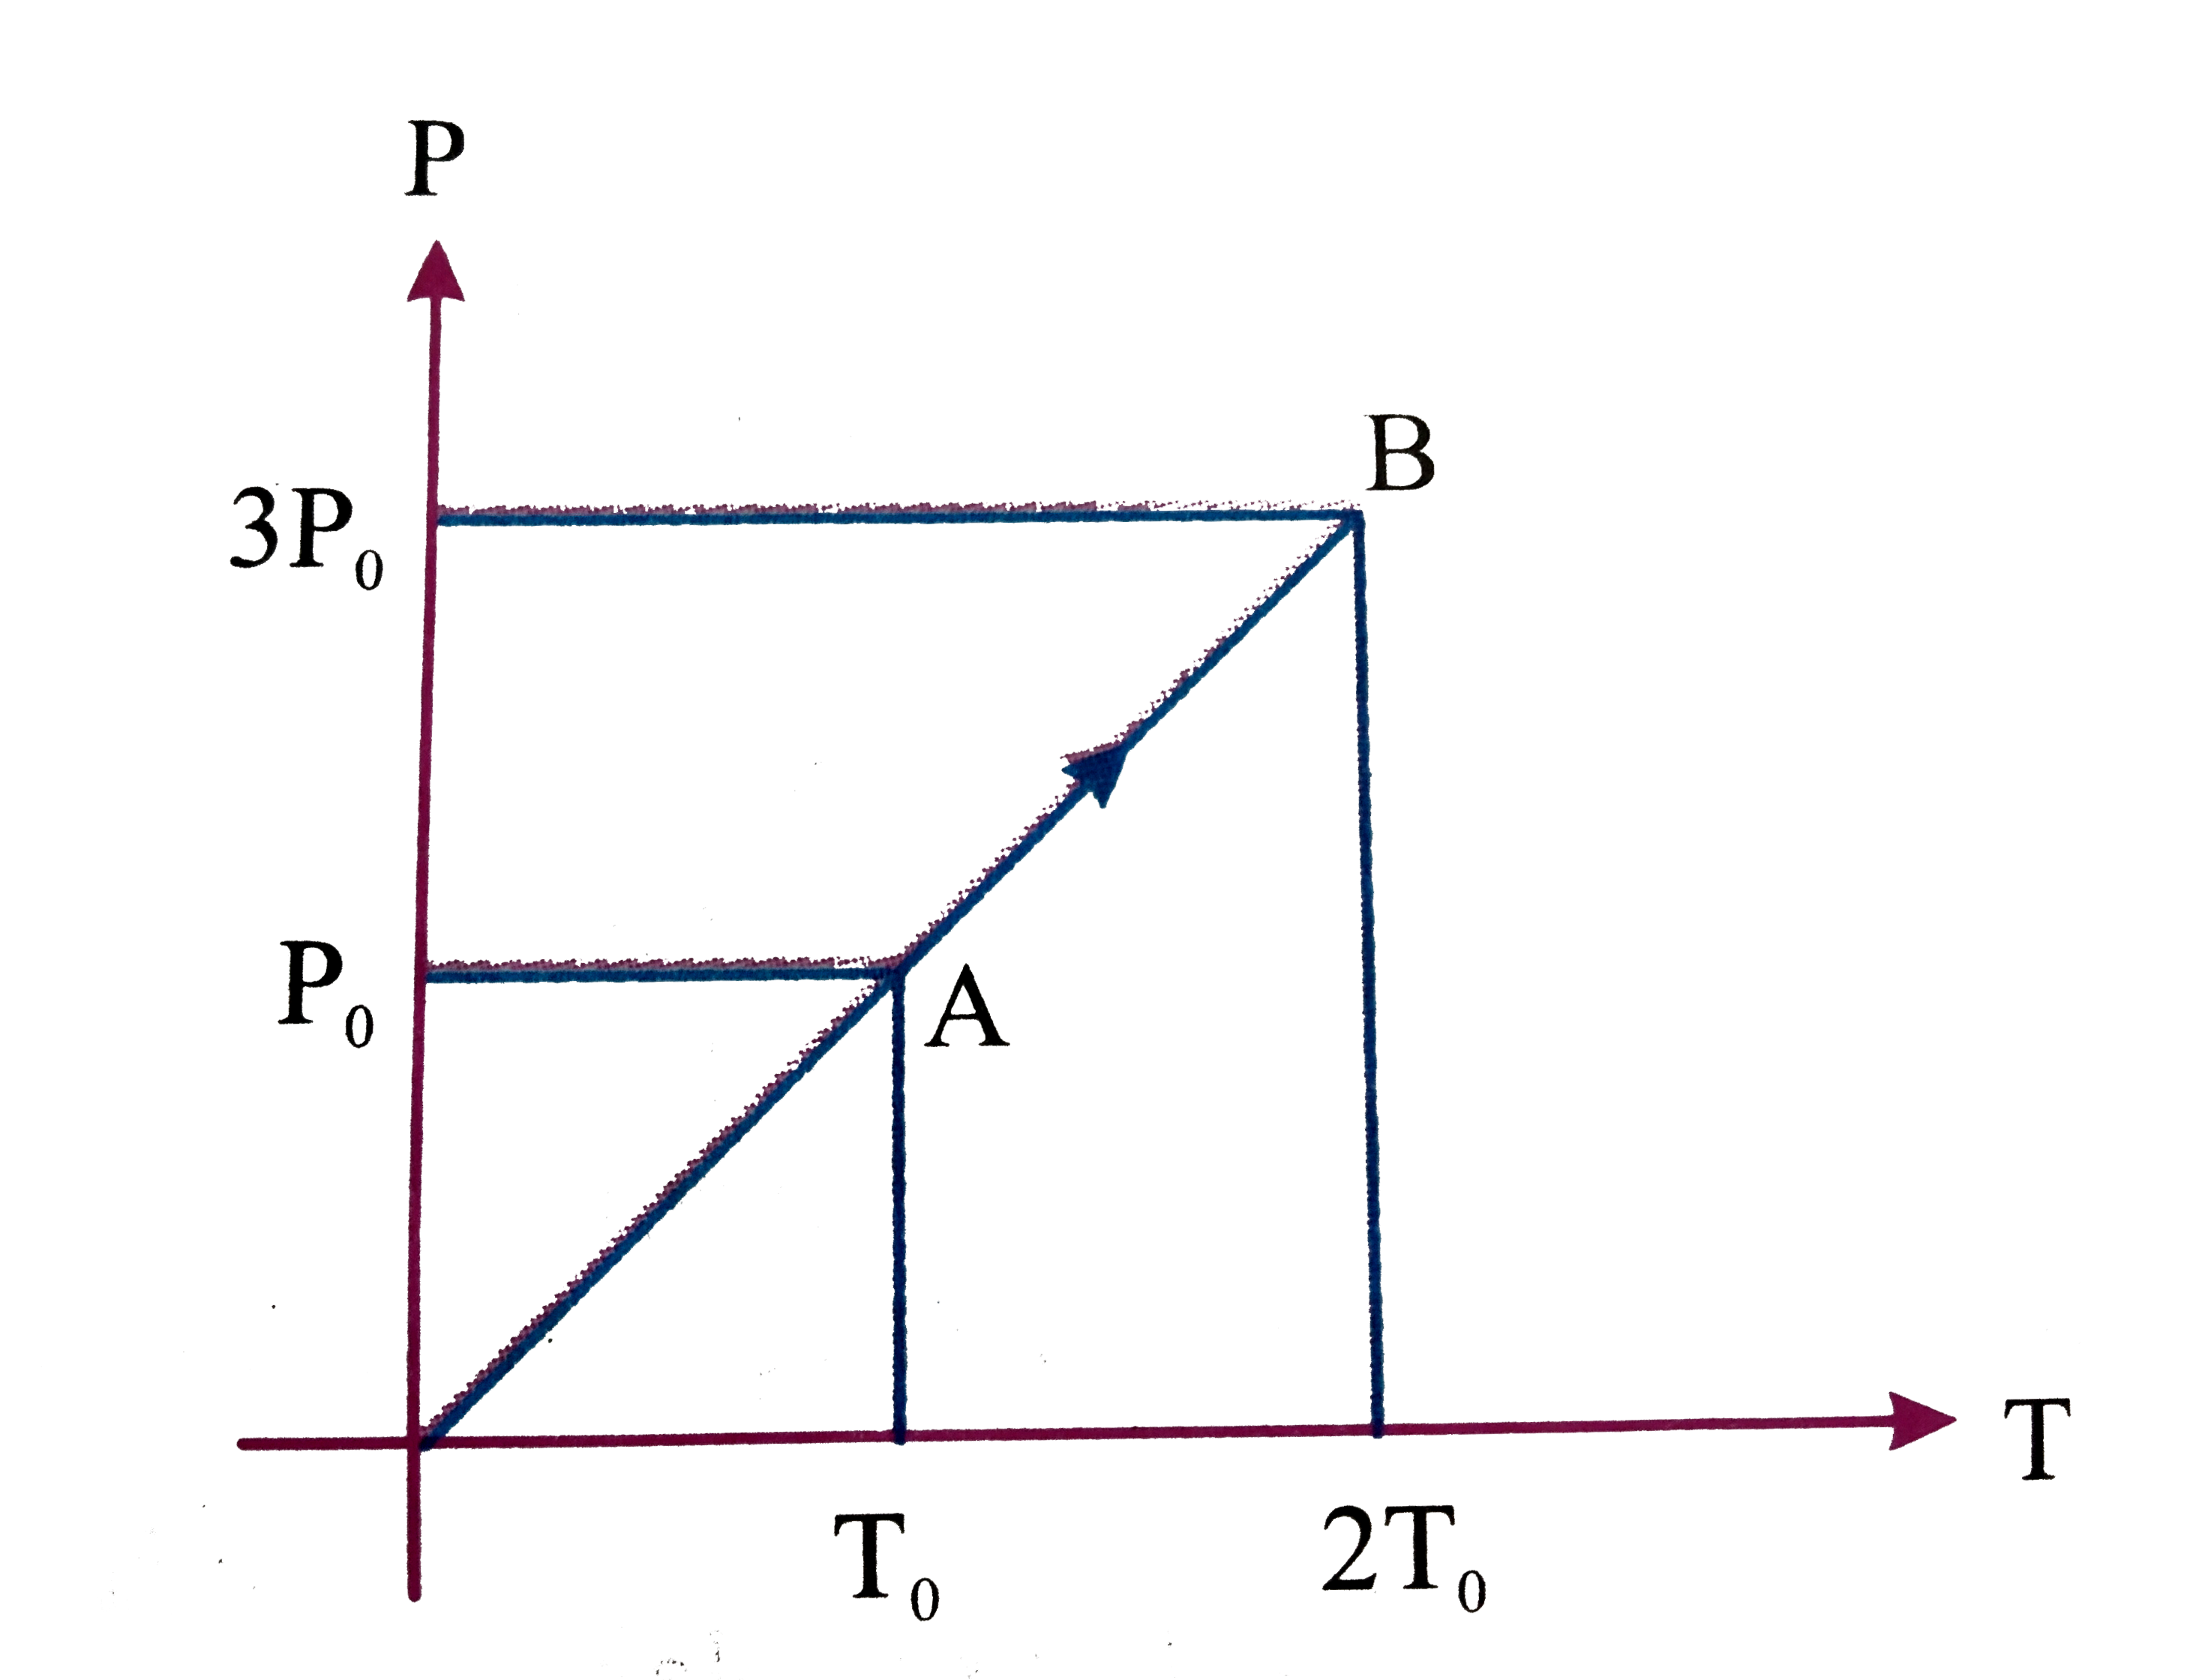
View SolutionPressure versus temperature graph of an ideal gas is shown in figure. Density of the gas at point A is ρ0. Density at B will be
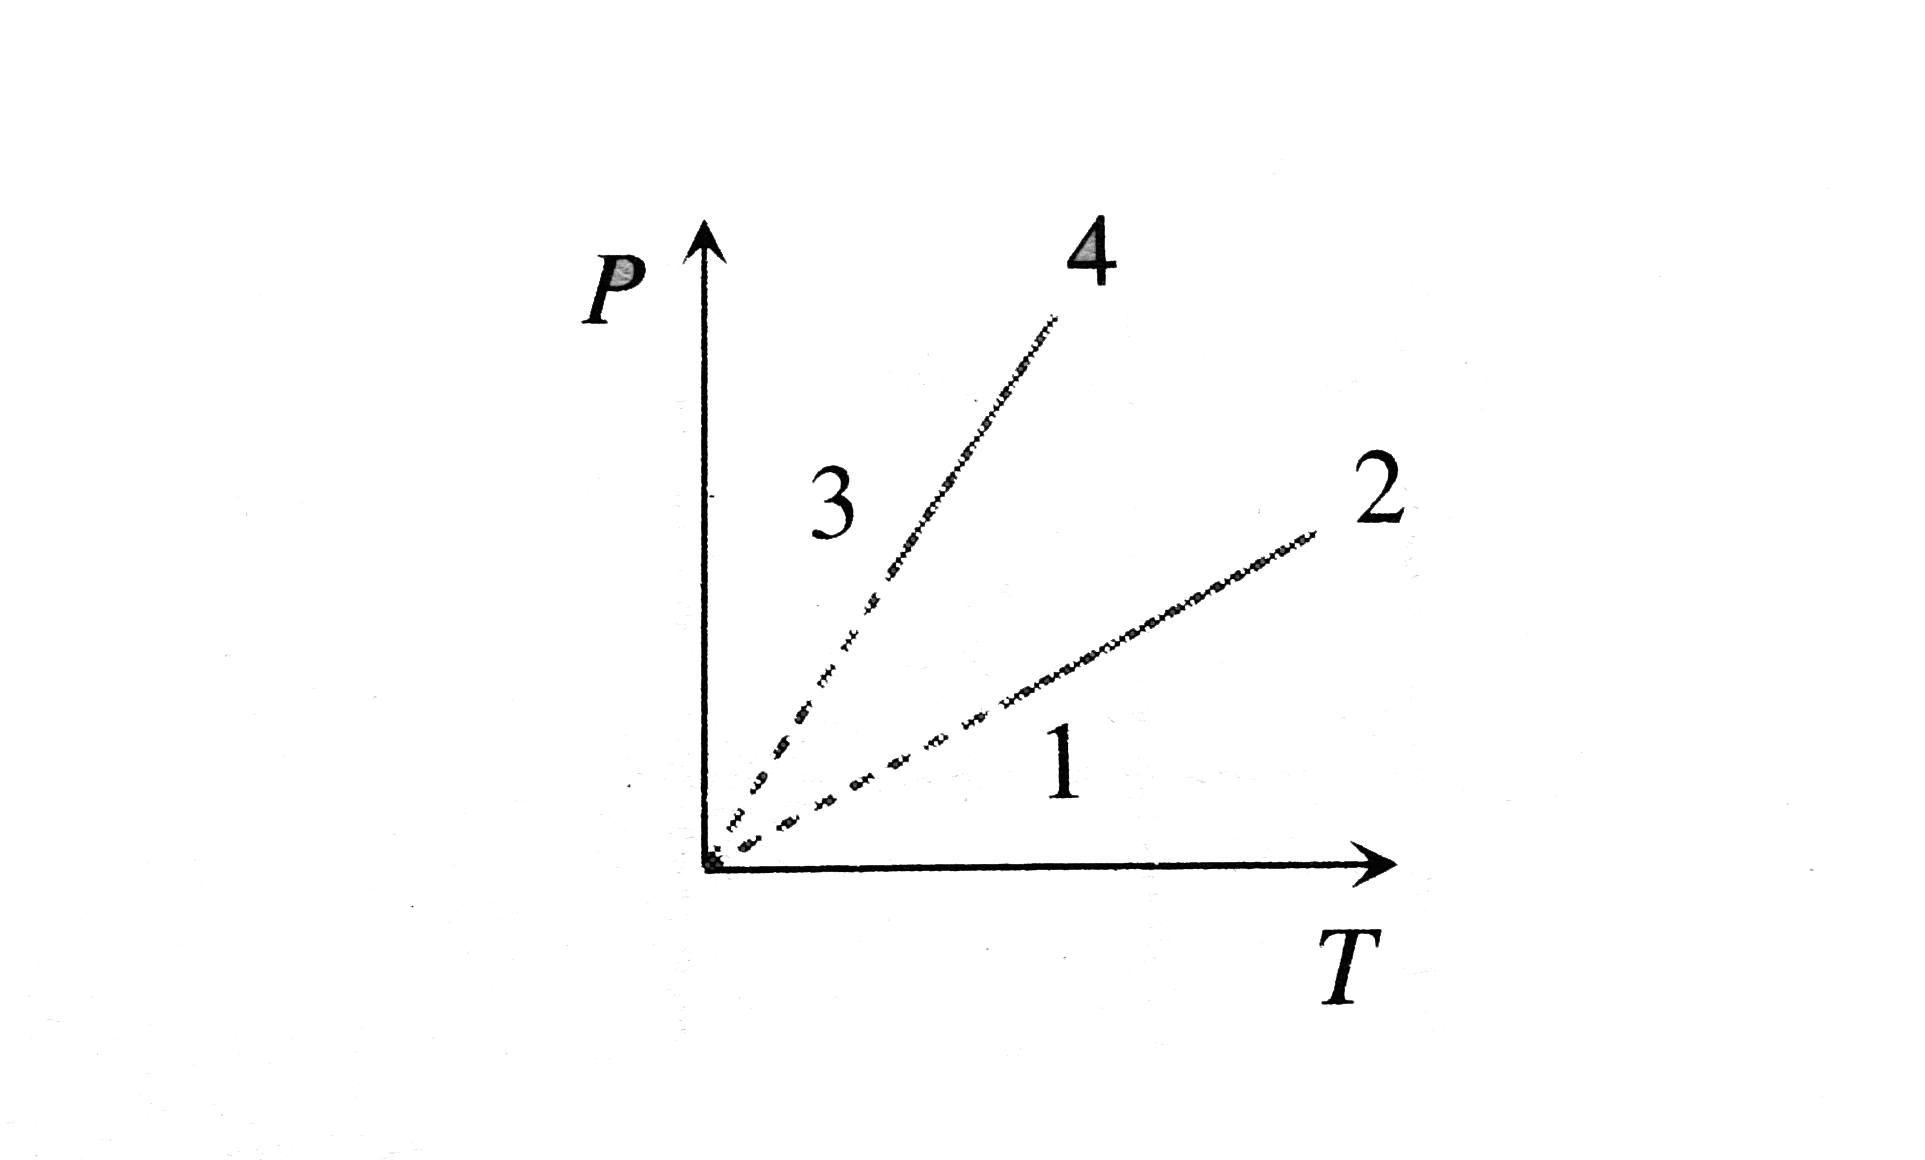
View SolutionPressure versus temperature graph of an ideal gas of equal number of moles of different volumes is plotted as shown in Fig. Choose the correct alternative.
View Solution

