Entropy of diamond is less than that of graphite.What conclusion do you draw from this ?
Video Solution
Text Solution
Less entropy of diamond meansless disorder,i.e., allthe C-atoms are linked to form a network structure. Greater entropy of graphite implies some disorder which is due to presence of free electrons and slipping of layers over each other.
|
Updated on:21/07/2023
Topper's Solved these Questions
- BOOK - PRADEEPCHAPTER - THERMODYNAMICSEXERCISE - SHORT ANSWER QUESTIONS65videos
THERMODYNAMICS
- BOOK - PRADEEPCHAPTER - THERMODYNAMICSEXERCISE - COMPETITION FOCUS (JEE ( main andAdvanced ) /Medical Entrance Special)131videos
THERMODYNAMICS
- BOOK - PRADEEPCHAPTER - THERMODYNAMICSEXERCISE - LONG ANSWER QUESTIONS21videos
THERMODYNAMICS
- BOOK - PRADEEPCHAPTER - STRUCTURE OF ATOMEXERCISE - Competition Focus (JEE (Main and Advanced)/Medical Entrance (IX. Assertion And Reason Type Questions (Type II))12videos
STRUCTURE OF ATOM
Similar Questions
Knowledge Check
- Question 1 - Select One
Diamond is harder than graphite because
AGraphite is planarBDiamond has free electronCGraphite is sp3 hybridisedDNone of these - Question 2 - Select One
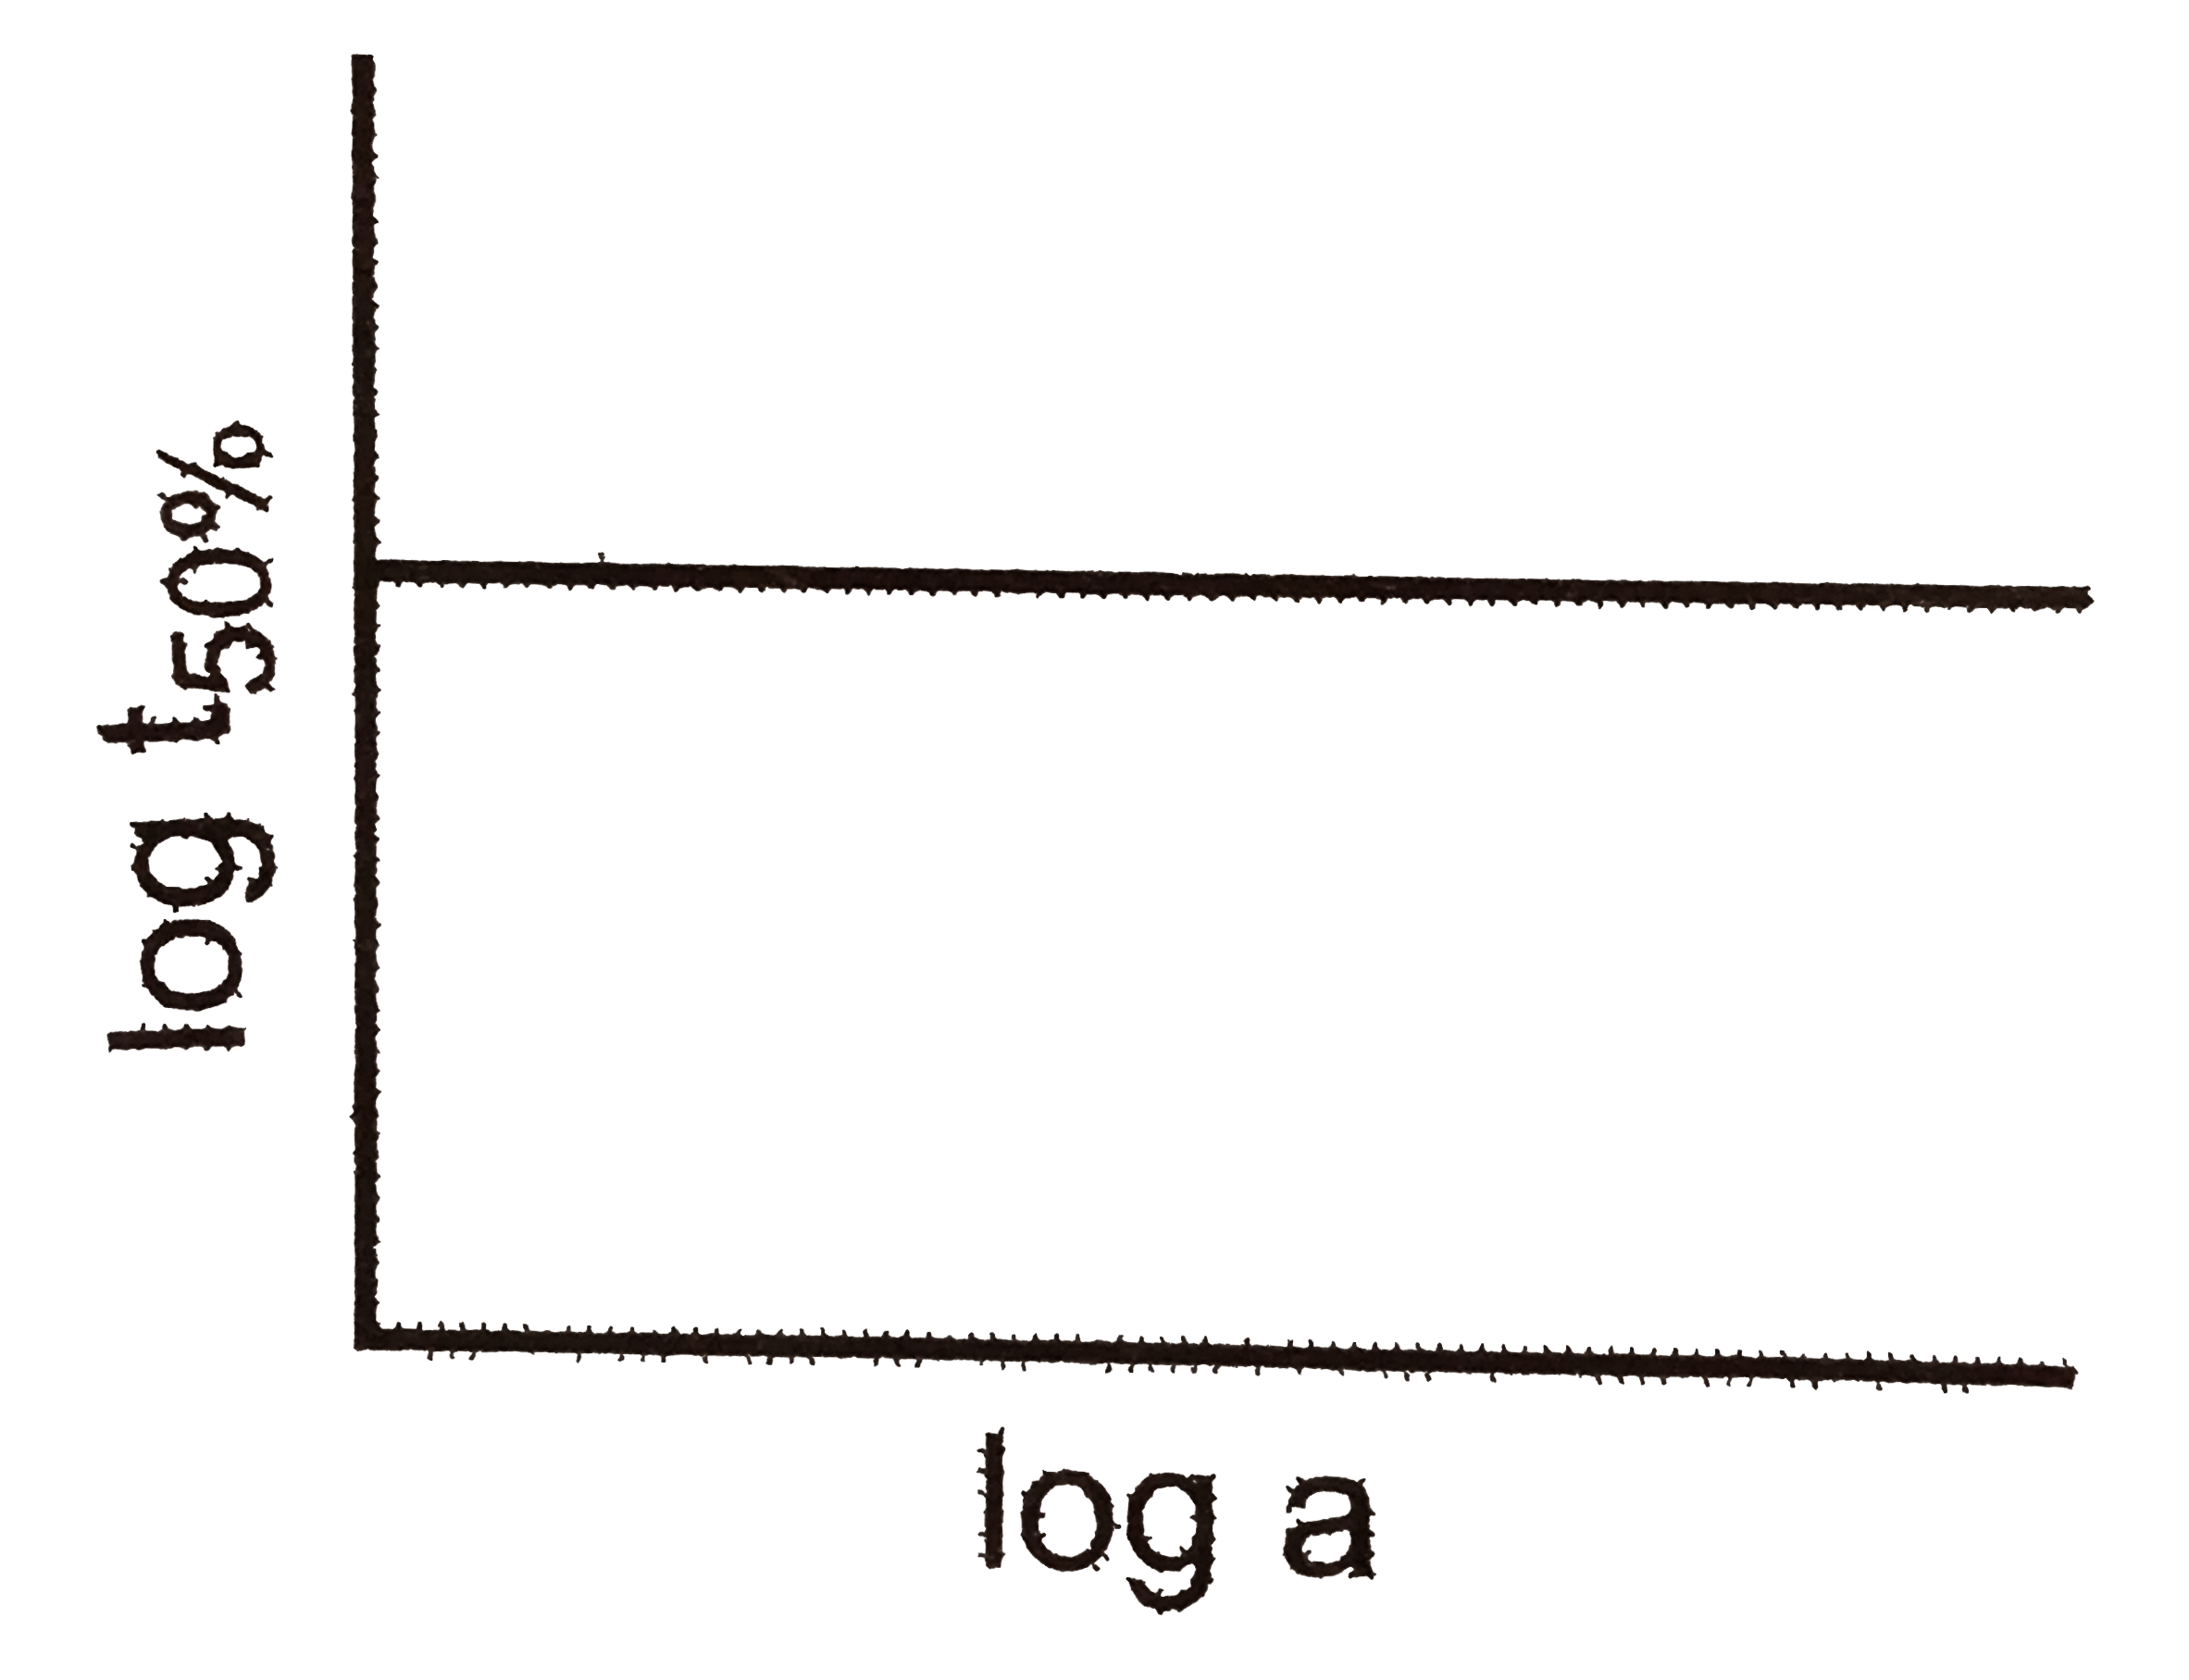
A graph plotted between log t50% vs log concentration is a straight line. What conclusion can you draw from this graph?
 An=1:t1/2=1x×aBn=2:t1/2=1aCn=1:t1/2=0.693kDNone of these
 - Question 3 - Select One
A graph plotted between log t50% vs log concentration is a straight line. What conclusion can you draw from this graph?
 Aa=1:t1/2∝aBa=2,t1/2∝1/aCa=1:t1/2=(0.693/k)DNone of these
What inference do you draw from above result ?
View SolutionWhat Interence do you draw from above result?
View SolutionA graph plotted between log t50% vs log concentration is a straight line. What conclusion can you draw from this graph?
 View Solution
When an object is touched with the metal top of an electroscope, its aluminium leaves diverge. What conclusion do you get from this observation ?
View SolutionA graph plotted between logt50% vs log concentration in a straight line. What conclusion can you draw from this graph?
 View Solution

