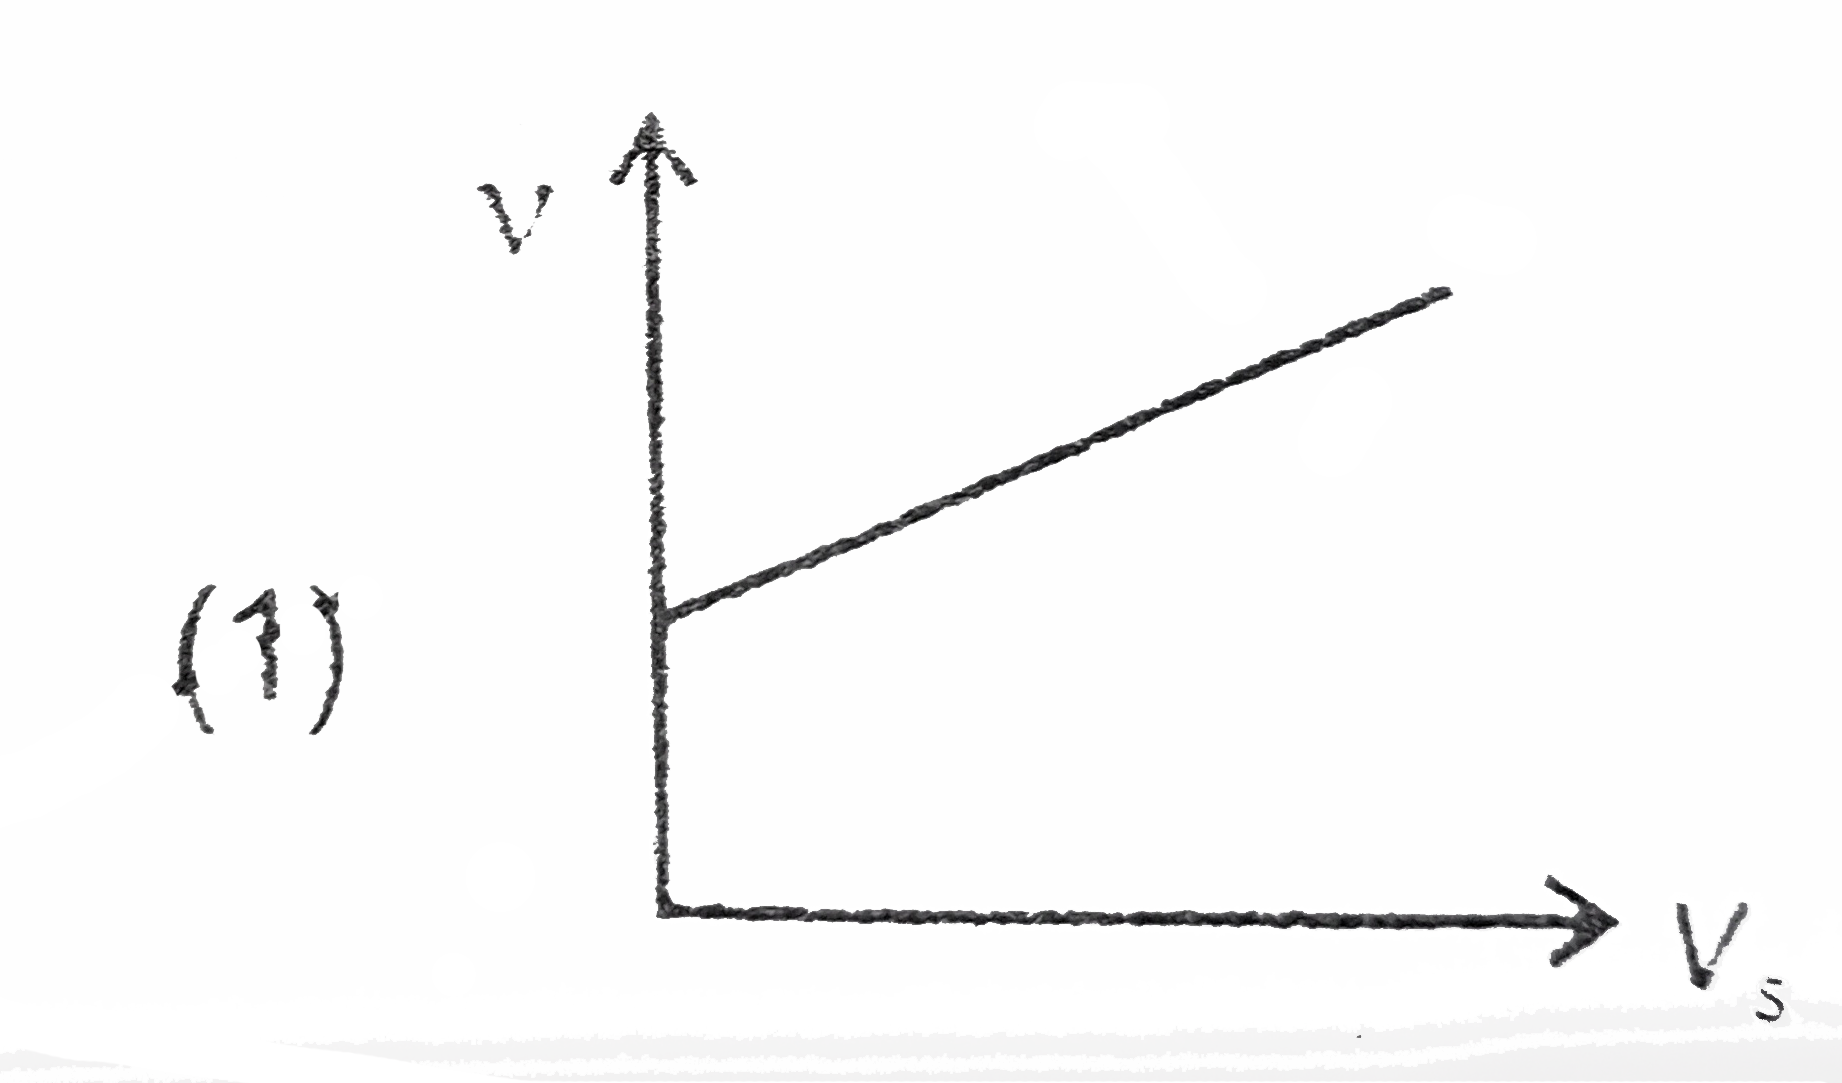
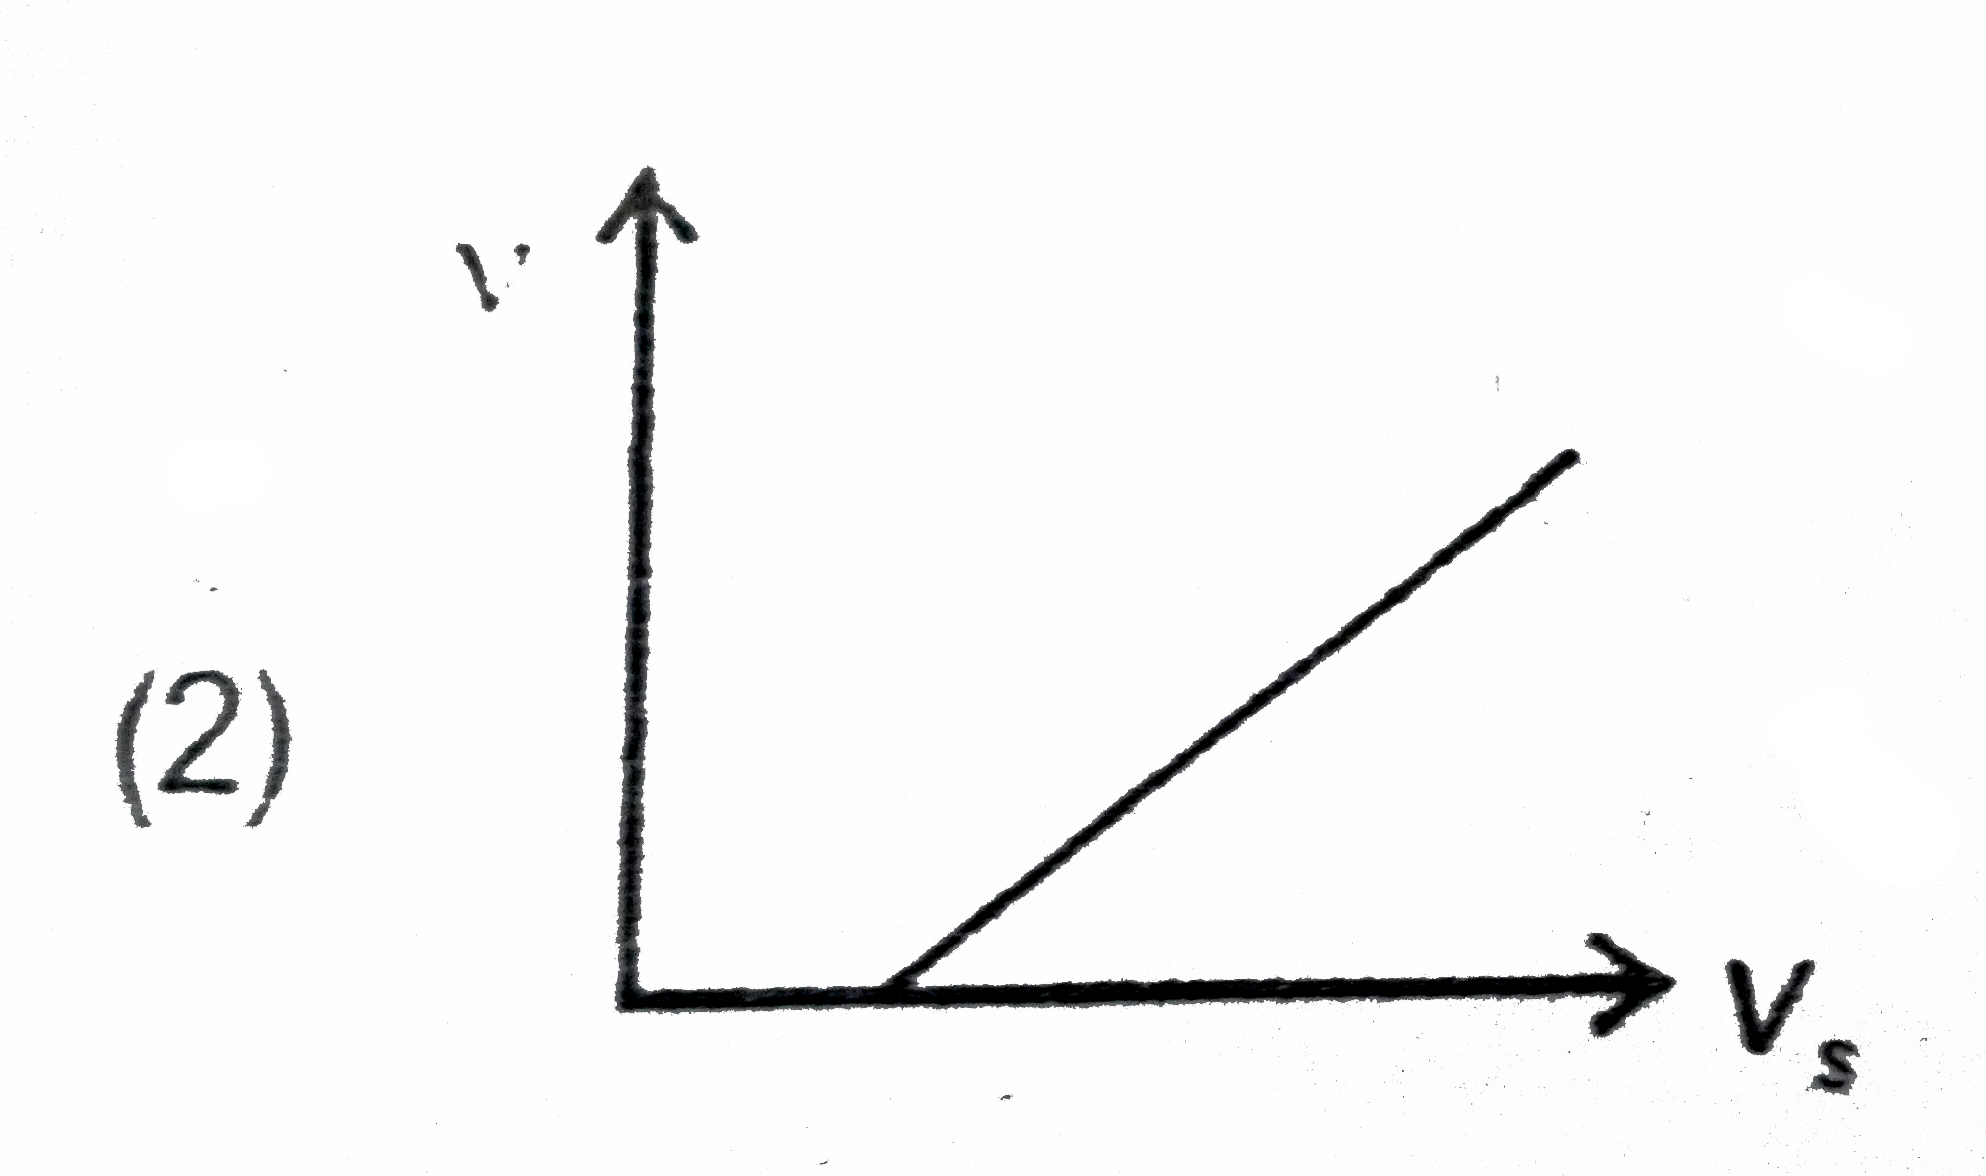
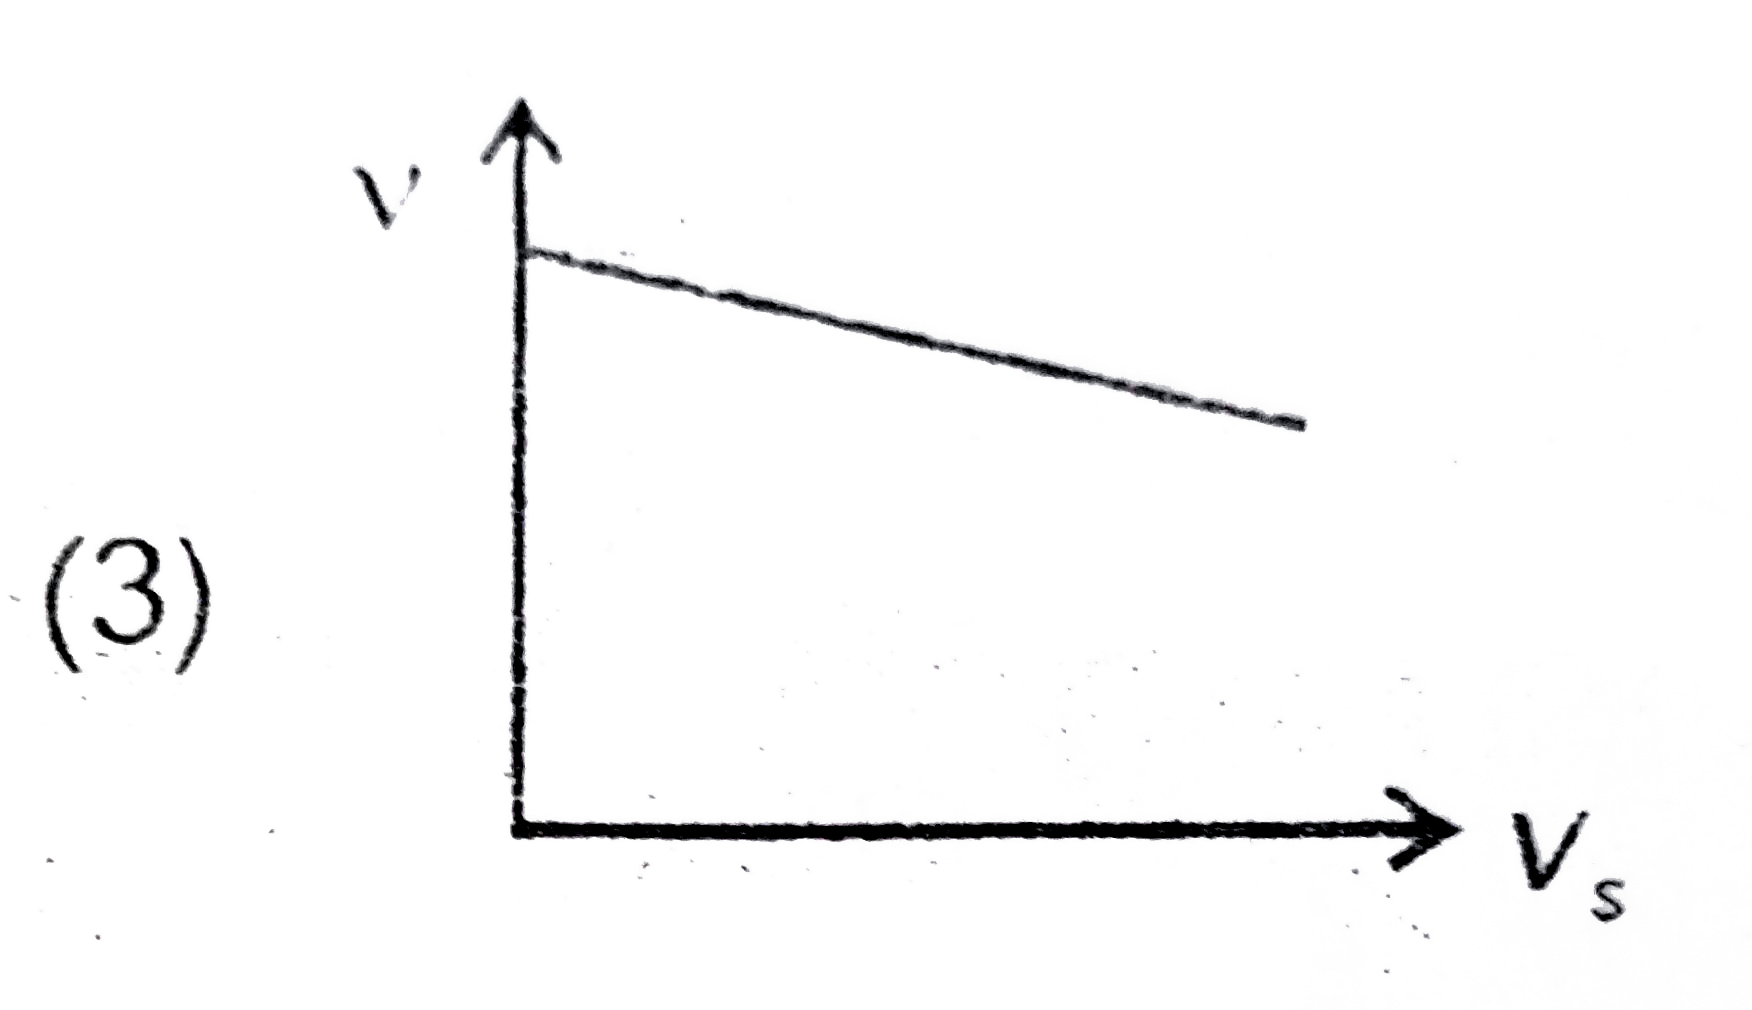
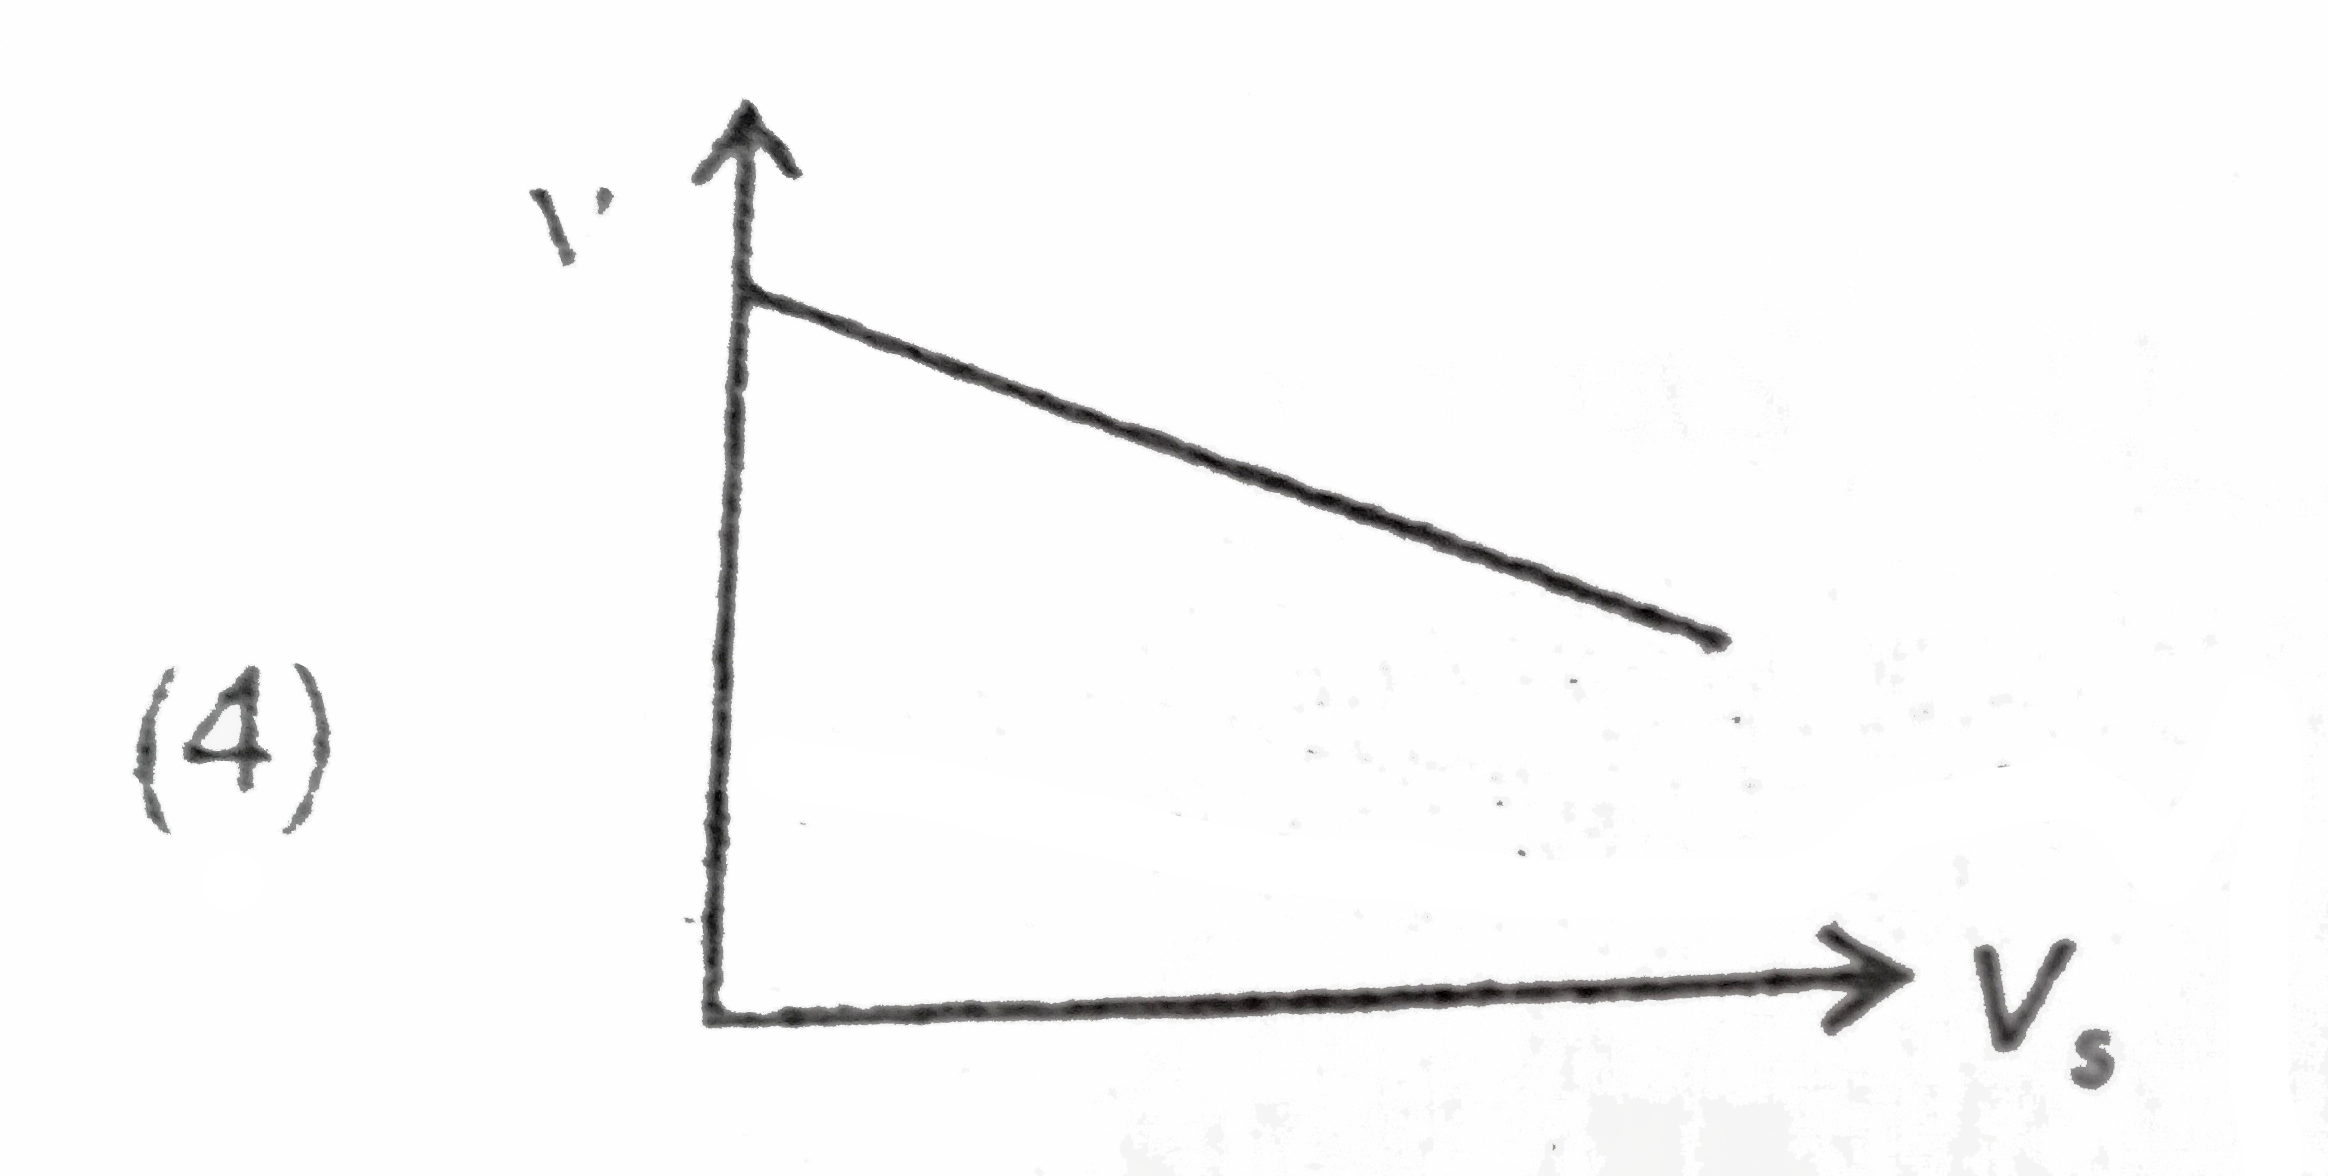
Graph of incident freuency with stopping potential in photoelectric effect is


The correct Answer is:1
To understand the relationship between incident frequency and stopping potential in the photoelectric effect, we can break down the solution into the following steps:
Step 1: Understand the Photoelectric Effect
The photoelectric effect occurs when light (photons) hits a metal surface and causes the ejection of electrons. The energy of the incident photons is related to their frequency.
Step 2: Define Key Terms
- Incident Frequency (ν): The frequency of the incoming light.
- Stopping Potential (V₀): The potential required to stop the emitted electrons from reaching the anode in a photoelectric experiment.
- Threshold Frequency (ν₀): The minimum frequency required to eject electrons from the metal surface.
Step 3: Relationship Between Frequency and Stopping Potential
According to Einstein's photoelectric equation:
E=hν=eV₀
Where:
- E is the energy of the photon,
- h is Planck's constant,
- e is the charge of the electron,
- V₀ is the stopping potential.
From this equation, we can derive:
V₀=hνe
This shows that the stopping potential is directly proportional to the frequency of the incident light.
Step 4: Graphing the Relationship
1. X-axis: Incident Frequency (ν)
2. Y-axis: Stopping Potential (V₀)
- At the threshold frequency (ν₀), the stopping potential (V₀) is zero because the energy of the photons is just enough to eject the electrons.
- As the frequency increases beyond the threshold frequency, the stopping potential increases linearly.
Step 5: Conclusion
The graph of incident frequency (ν) versus stopping potential (V₀) will be a straight line starting from the point (ν₀, 0) and rising linearly as frequency increases. This indicates that as the frequency increases, the stopping potential also increases.
Final Graph Representation
The graph will look like this:
- A straight line starting from the point (ν₀, 0) and moving upwards to the right.
The photoelectric effect occurs when light (photons) hits a metal surface and causes the ejection of electrons. The energy of the incident photons is related to their frequency.
- Incident Frequency (ν): The frequency of the incoming light.
- Stopping Potential (V₀): The potential required to stop the emitted electrons from reaching the anode in a photoelectric experiment.
- Threshold Frequency (ν₀): The minimum frequency required to eject electrons from the metal surface.
According to Einstein's photoelectric equation:
E=hν=eV₀
Where:
- E is the energy of the photon,
- h is Planck's constant,
- e is the charge of the electron,
- V₀ is the stopping potential.
V₀=hνe
This shows that the stopping potential is directly proportional to the frequency of the incident light.
1. X-axis: Incident Frequency (ν)
2. Y-axis: Stopping Potential (V₀)
- As the frequency increases beyond the threshold frequency, the stopping potential increases linearly.
The graph of incident frequency (ν) versus stopping potential (V₀) will be a straight line starting from the point (ν₀, 0) and rising linearly as frequency increases. This indicates that as the frequency increases, the stopping potential also increases.
The graph will look like this:
- A straight line starting from the point (ν₀, 0) and moving upwards to the right.
Topper's Solved these Questions
- STRUCTURE OF ATOM BOOK - AAKASH INSTITUTECHAPTER - STRUCTURE OF ATOM EXERCISE - ASSIGNMENT ( SECTION -C) Objective Type Questions (More than one options are correct)
15 Videos
- STRUCTURE OF ATOM BOOK - AAKASH INSTITUTECHAPTER - STRUCTURE OF ATOM EXERCISE - ASSIGNMENT ( SECTION -D) Linked Comprehension Type Questions)
9 Videos
- STRUCTURE OF ATOM BOOK - AAKASH INSTITUTECHAPTER - STRUCTURE OF ATOM EXERCISE - ASSIGNMENT ( SECTION -A) Objective Type Questions (One option is correct)
47 Videos
- STRUCTURE OF ATOMBOOK - AAKASH INSTITUTECHAPTER - STRUCTURE OF ATOMEXERCISE - ASSIGNMENT (SECTION -D) Assertion-Reason Type Questions
15 Videos
- SURFACE CHEMISTRY BOOK - AAKASH INSTITUTECHAPTER - SURFACE CHEMISTRY EXERCISE - Assignment Section - C (Assertion - Reason type questions)
10 Videos
Similar Questions
Knowledge Check
The magnitude of stopping potential for the photoelectric effect is
Adirectly proportional to the intensity of incident light.Binversely proportional to the intensity of incident light.Cdirectly proportional to the frequency of incident light.Dinversely proportional to the frequency of incident light.The stopping potential of a given photoelectric device is depended on
AintensityBfrequencyCvelocity of photonDwork functionThe graph between stopping potential and intensity of light in photoelectric effect is
A B
B C
C D
D
Define the term 'stopping potential' in relation to photoelectric effect.
View SolutionDefine the term 'stopping potential' in relation to photoelectric effect.
View SolutionThe slope of the stopping potential versus frequency graph for photoelectric effect is equal to:
View SolutionWhen monochromatic light of wavelength λ is incident on a metallic surface the stopping potential for photoelectric current is 3V0 when same surface is illuminated with light of waelength 2λ the stopping potential is V0
The threshold wavelength for this surface when photoelectric effect takes place is
View Solution
