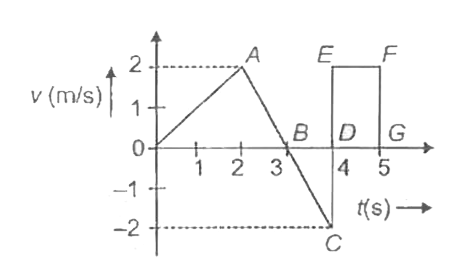
The velocity versus time graph of two particles moving along x-axis varies are shown in the following two plots. Then
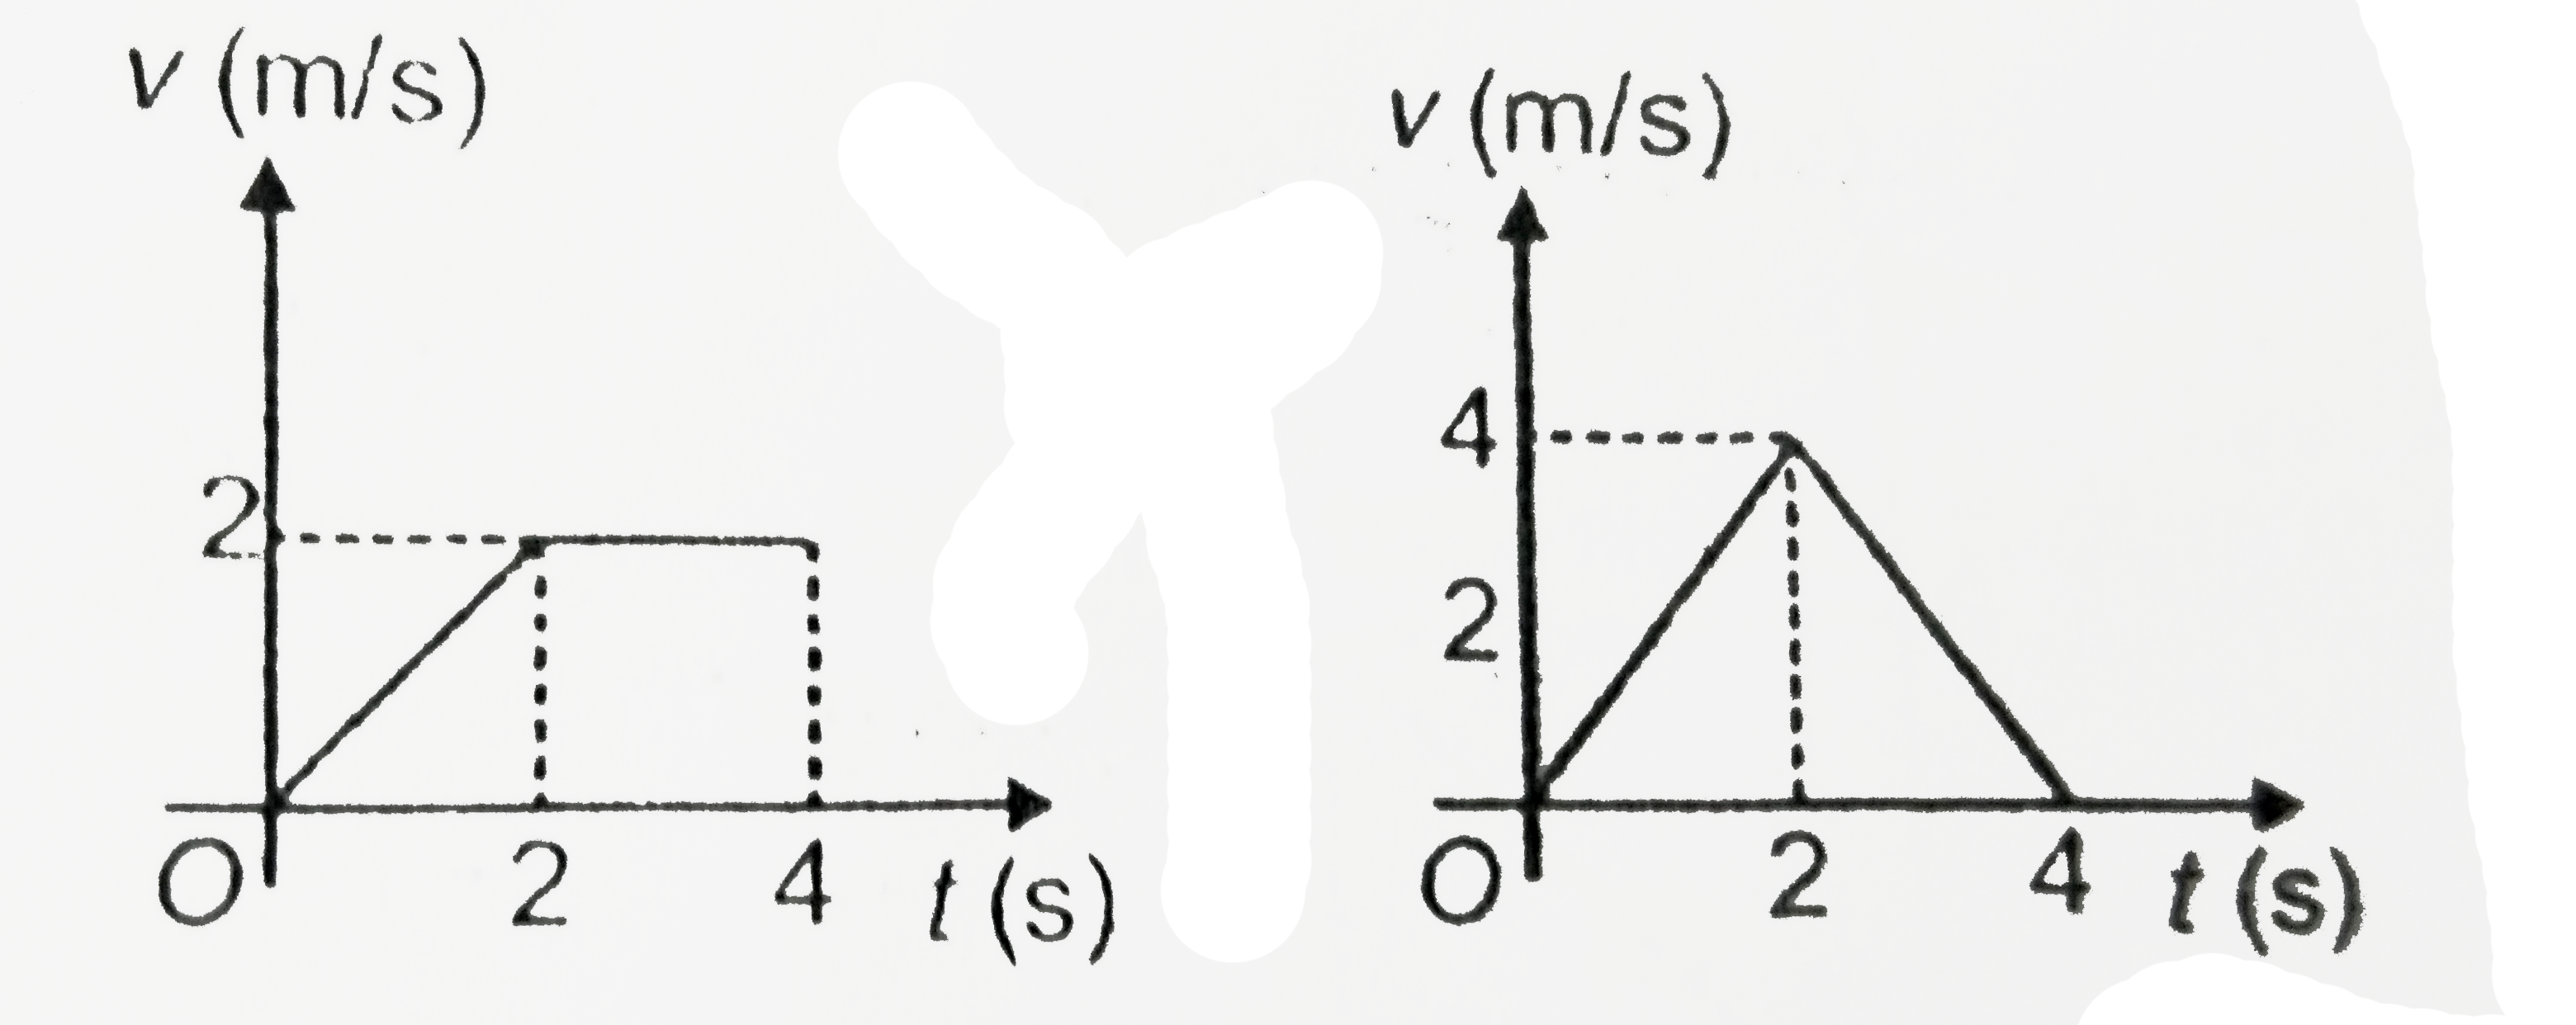
Maximum separation between two particles is 2 m
Maximum separation between two particles is 3 m
Maximum separation between occurs after at t = 2 s
Maximum separation between occurs after at t = 3 s.
The correct Answer is:B, D
Step by step video & image solution for The velocity versus time graph of two particles moving along x-axis varies are shown in the following two plots. Then by Physics experts to help you in doubts & scoring excellent marks in Class 12 exams.
Updated on:21/07/2023Topper's Solved these Questions
- MOTION IN STRAIGHT LINEBOOK - AAKASH INSTITUTECHAPTER - MOTION IN STRAIGHT LINEEXERCISE - Assignment (SECTION - D)
24 Videos
- MOTION IN STRAIGHT LINEBOOK - AAKASH INSTITUTECHAPTER - MOTION IN STRAIGHT LINEEXERCISE - Assignment (SECTION - E)
8 Videos
- MOTION IN STRAIGHT LINEBOOK - AAKASH INSTITUTECHAPTER - MOTION IN STRAIGHT LINEEXERCISE - Assignment (SECTION - B)
19 Videos
- MOTION IN A STRAIGHT LINEBOOK - AAKASH INSTITUTECHAPTER - MOTION IN A STRAIGHT LINEEXERCISE - ASSIGNMENT (SECTION - D)
15 Videos
- MOVING CHARGE AND MAGNESIUMBOOK - AAKASH INSTITUTECHAPTER - MOVING CHARGE AND MAGNESIUMEXERCISE - SECTION D
16 Videos
Similar Questions
Knowledge Check
The velocity versus time of two particles moving along x-axis varies as shown in the following two plots. Then
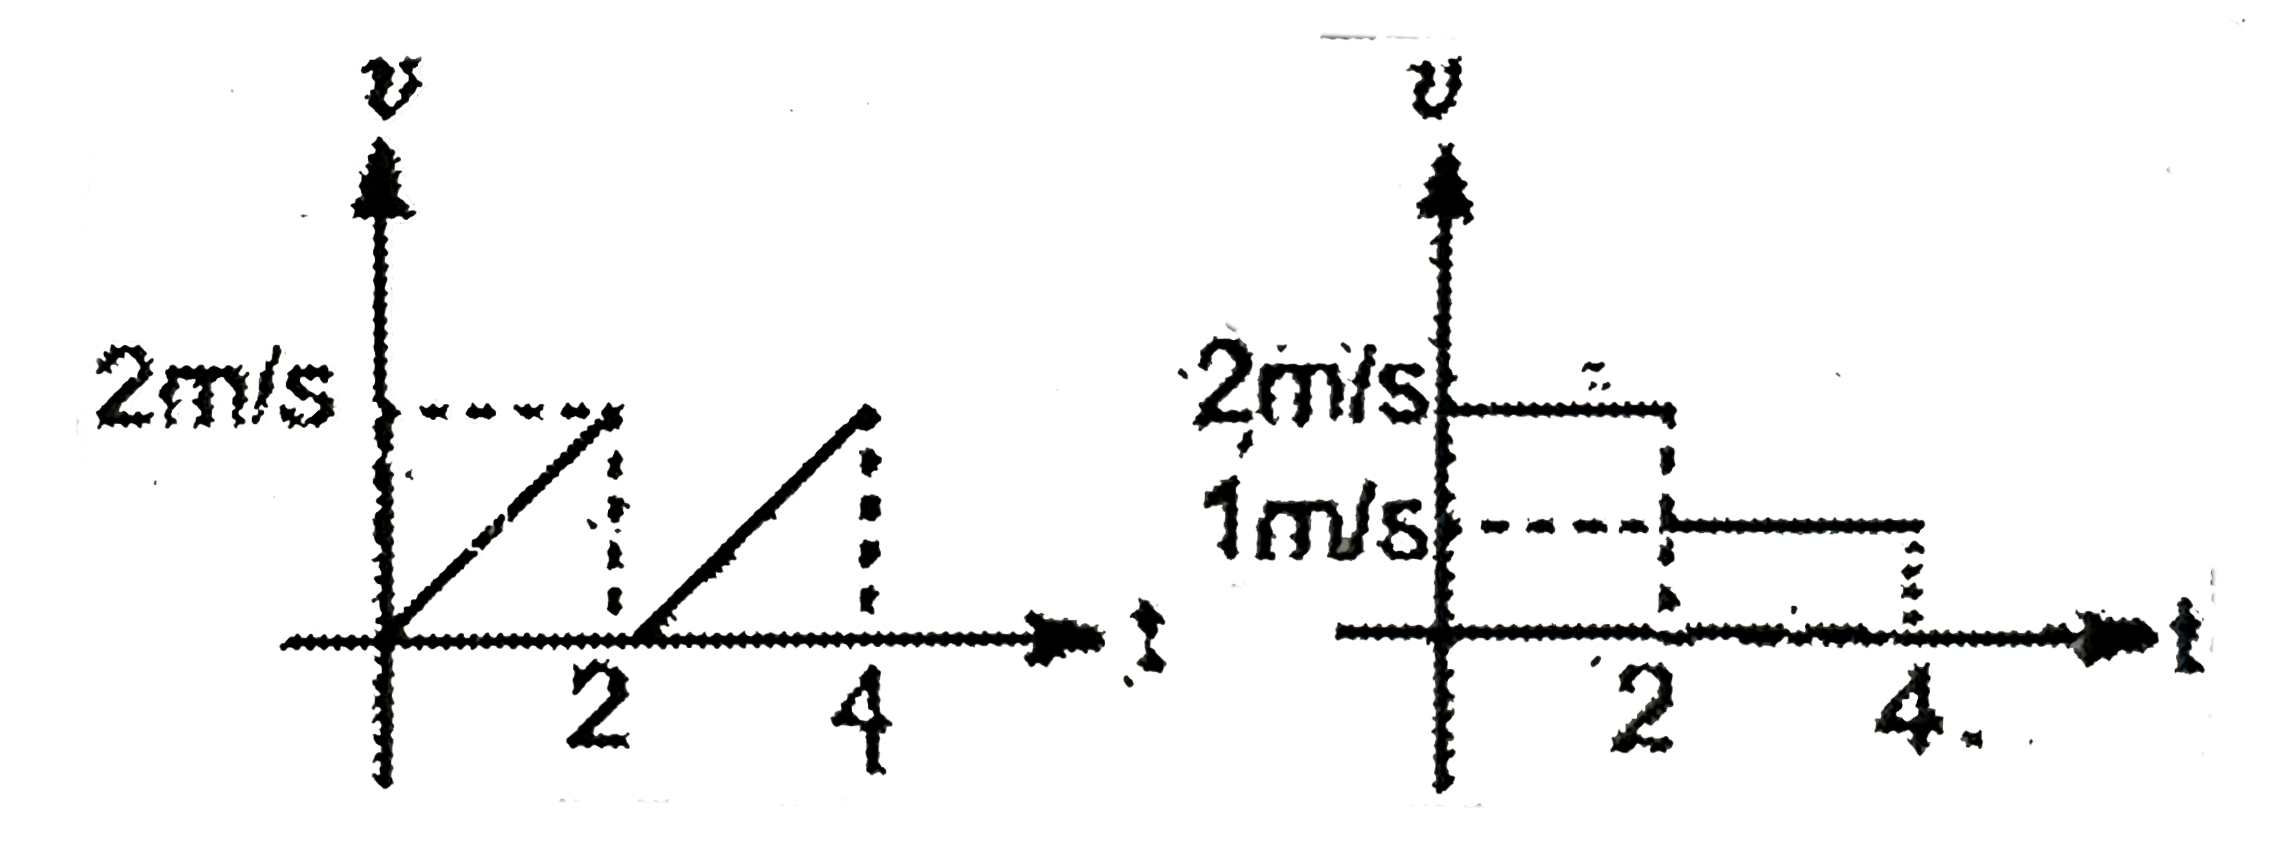 Amaximum separation between the two particles is 2mBmaximum separation between the two particles is 2.5 mCmaximum separation between occurs after time · t=2secDmaximum separation between occurs after time t=3sec
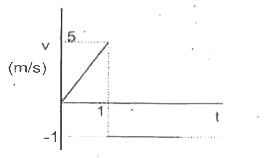
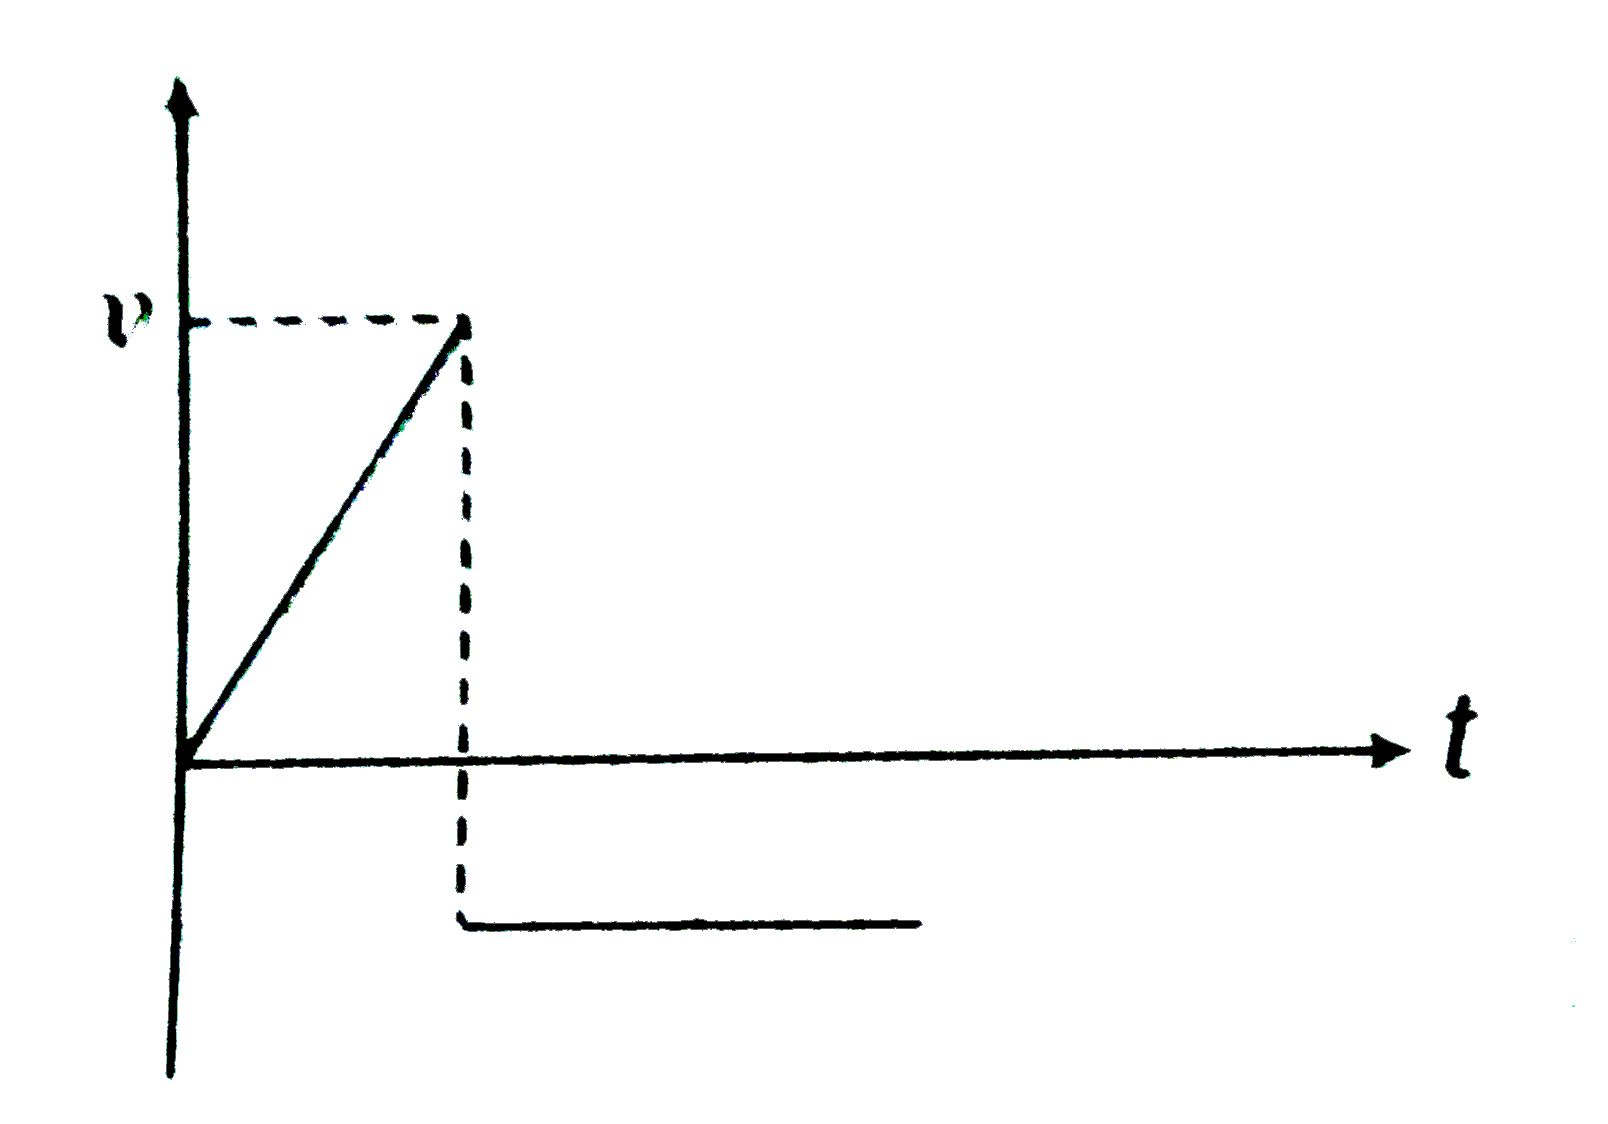
The velocity time graph for a particle moving along X-axis is shown in the figure. The corresponding displacement time graph is correctly shown by
 A
A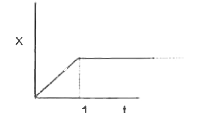 B
B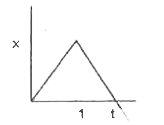 C
C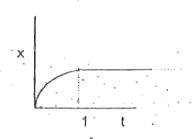 D
D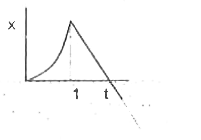
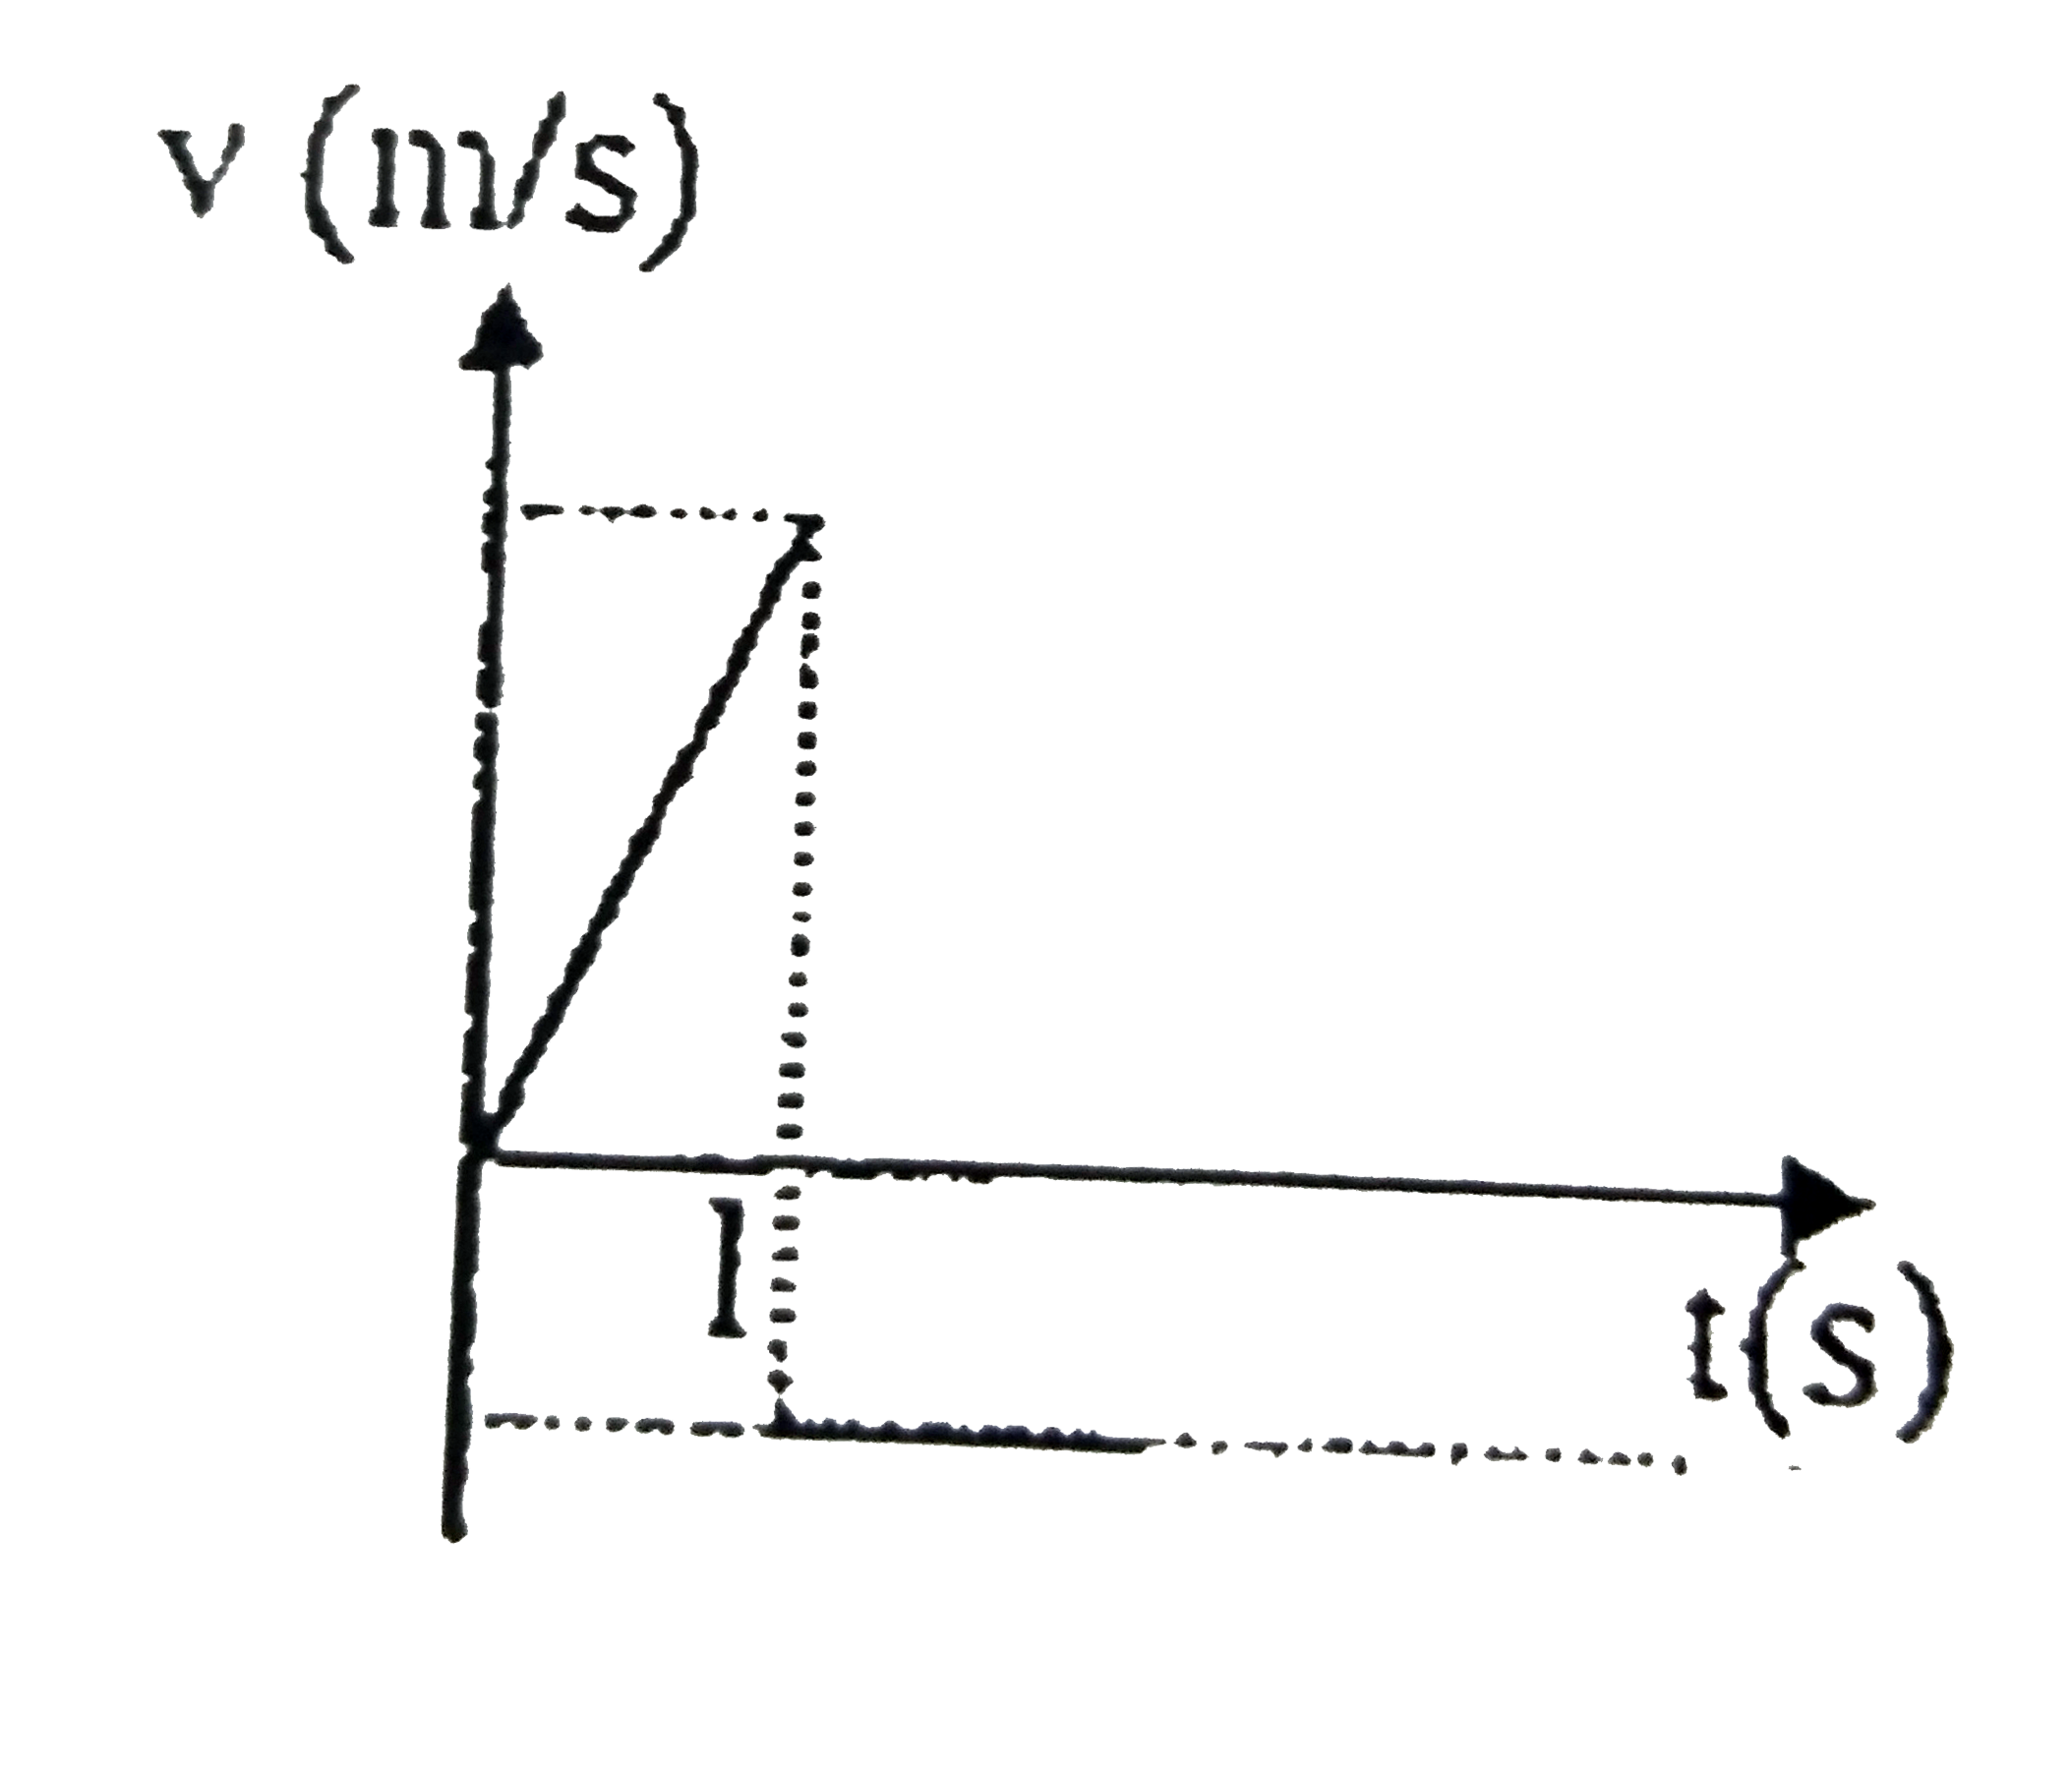
The velocity time graph for a particle moving along x-axis is shown in the figure. The corresponding displacement time graph is correctly shown by
 A
A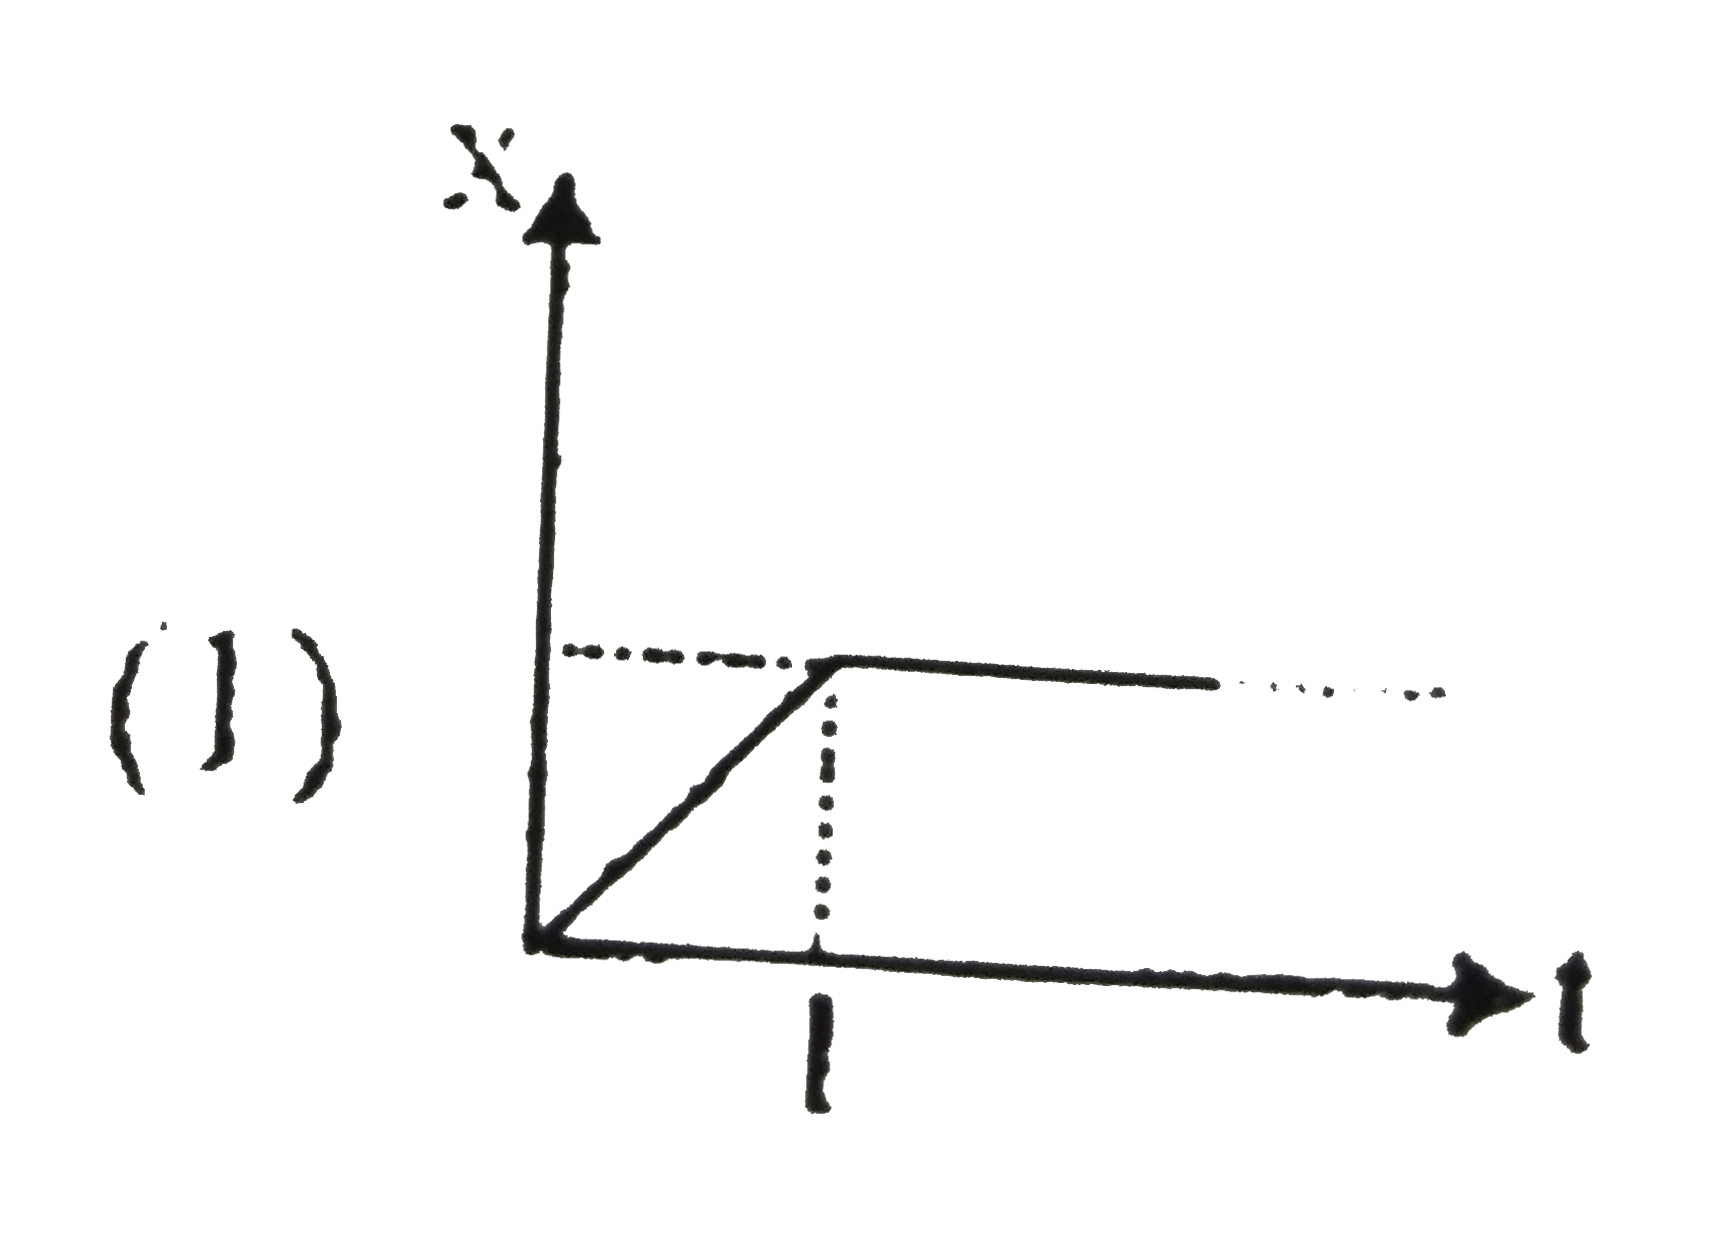 B
B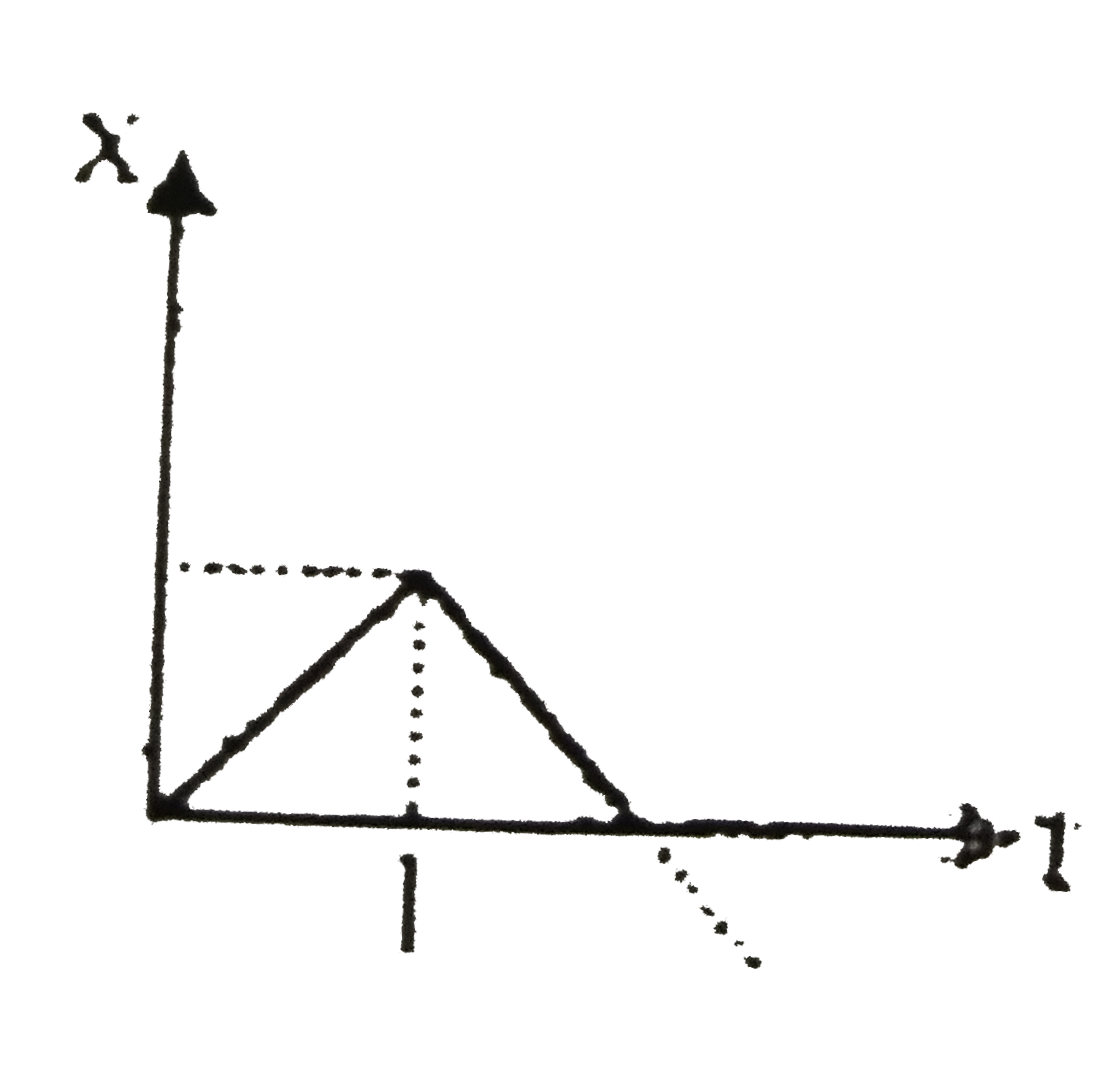 C
C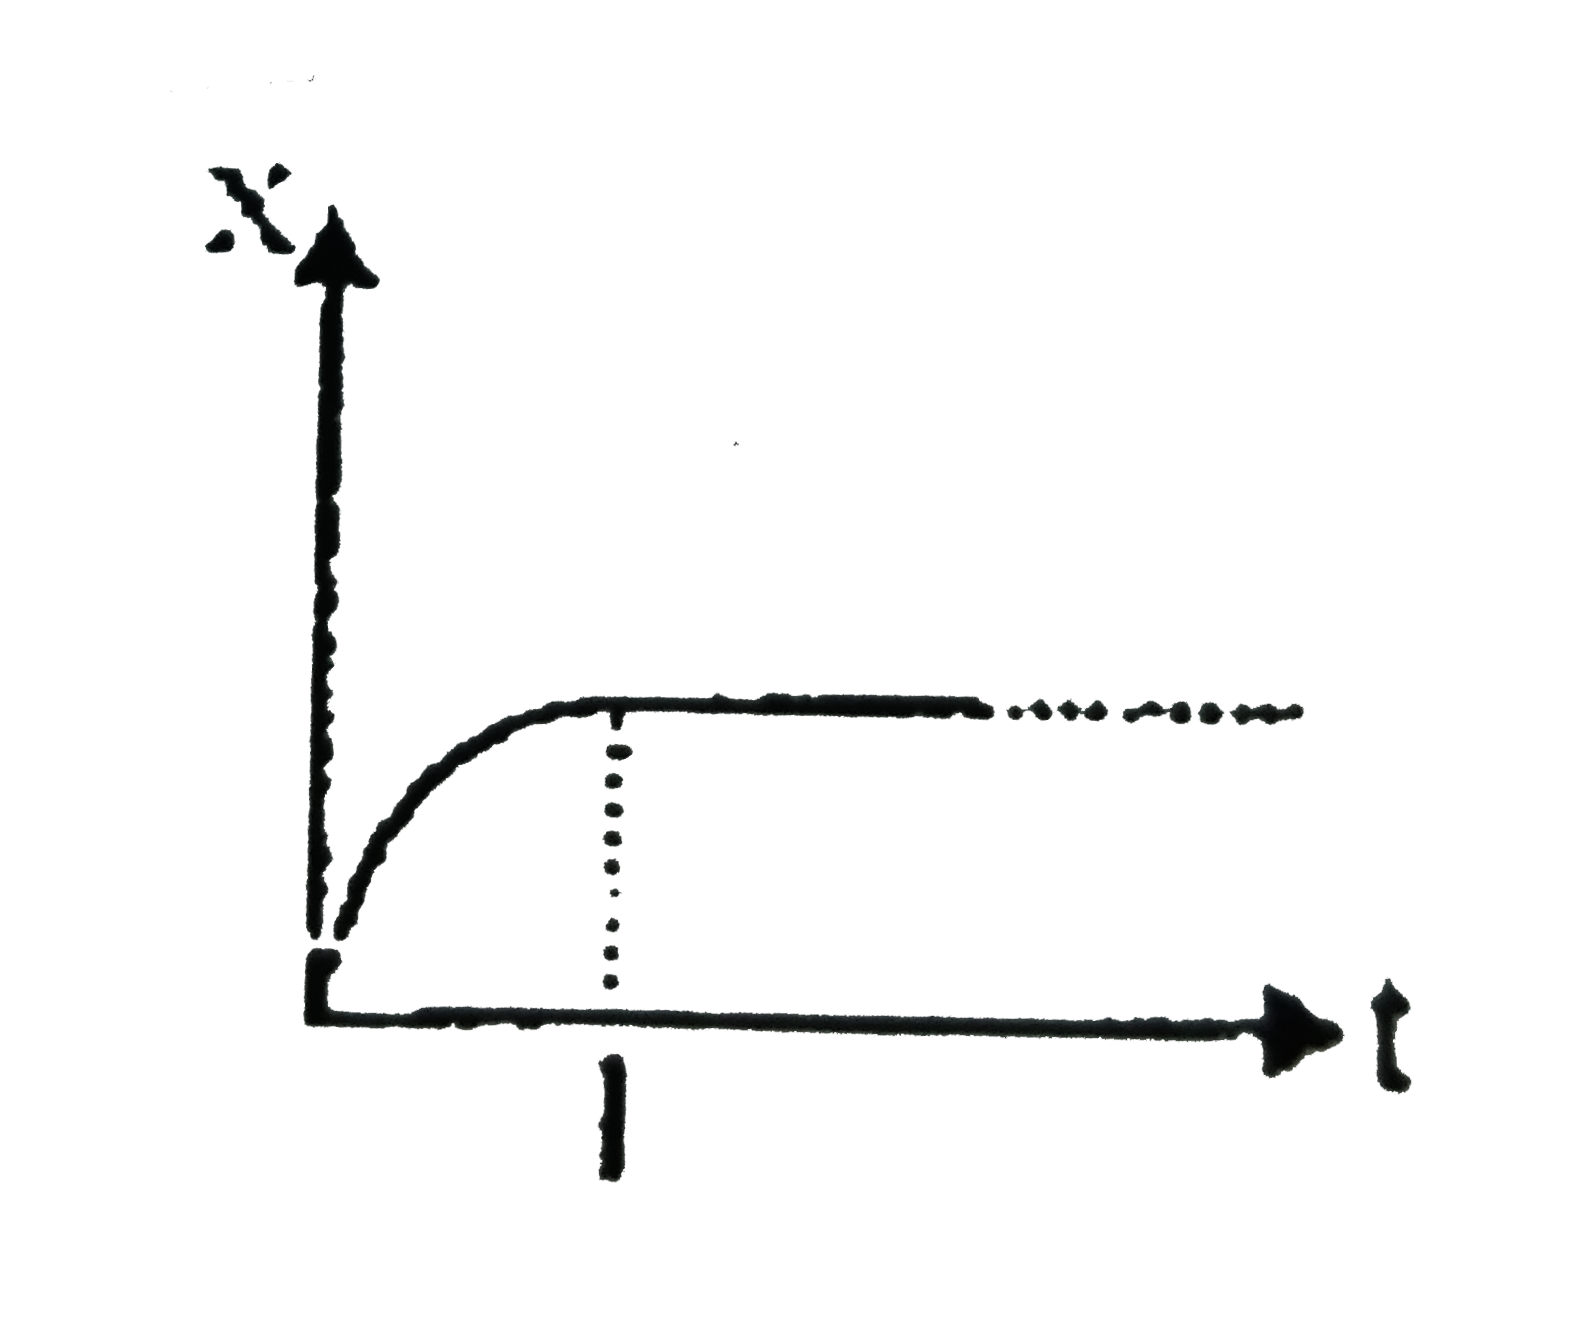 D
D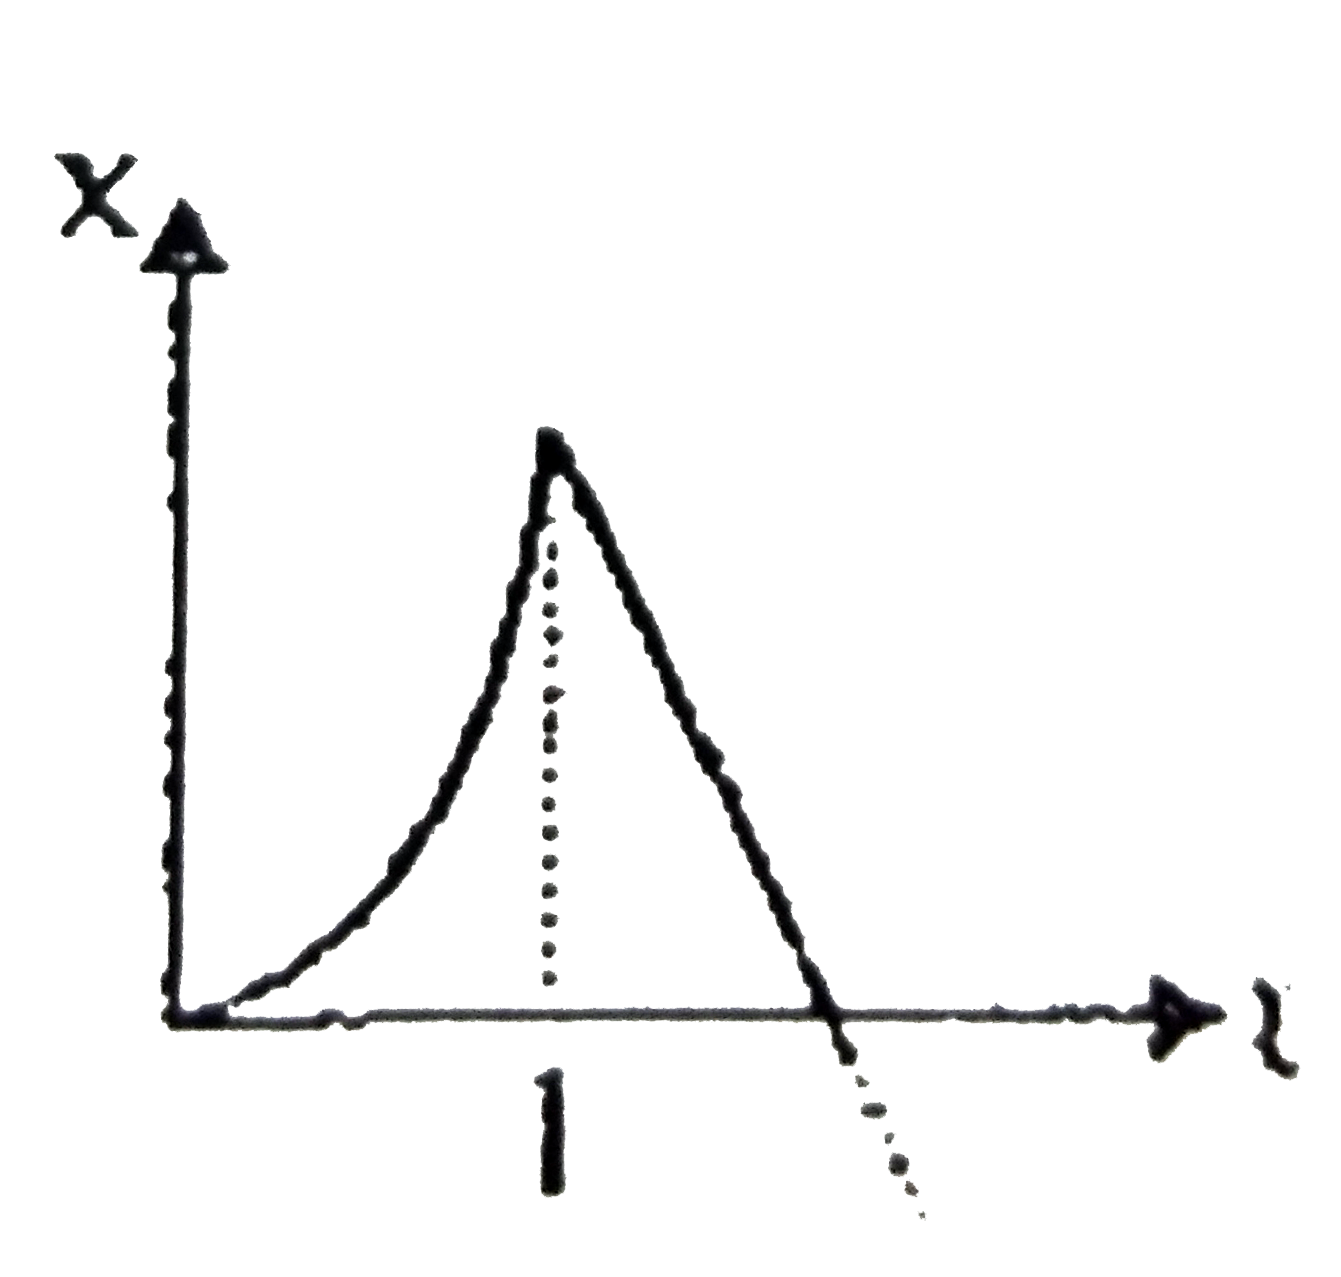
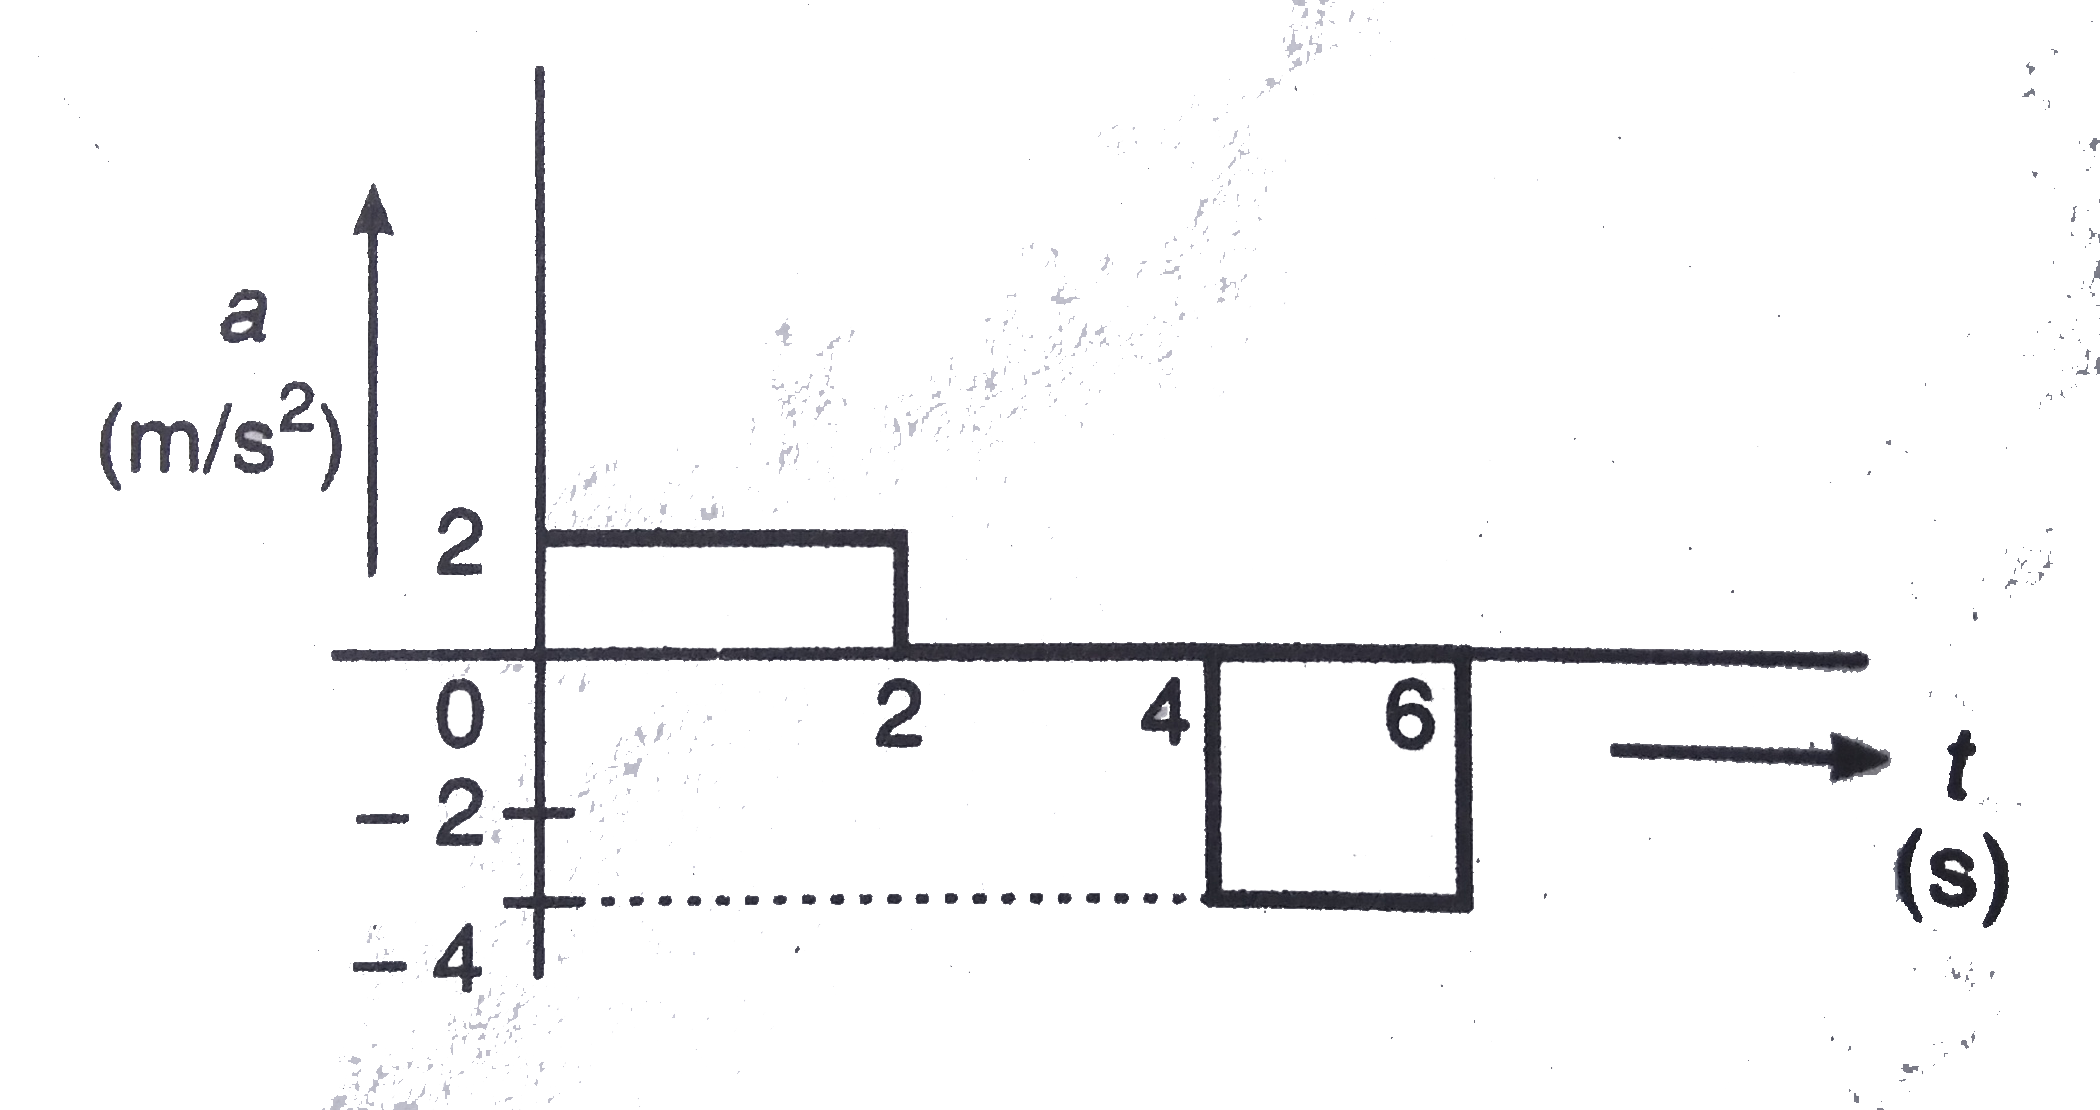
The acceleration-time graph of a particle moving along x-axis is shown in the figure. If the particle starts with velocity 3 m/s at t = 0, find the velocity of particle at t = 4 s.
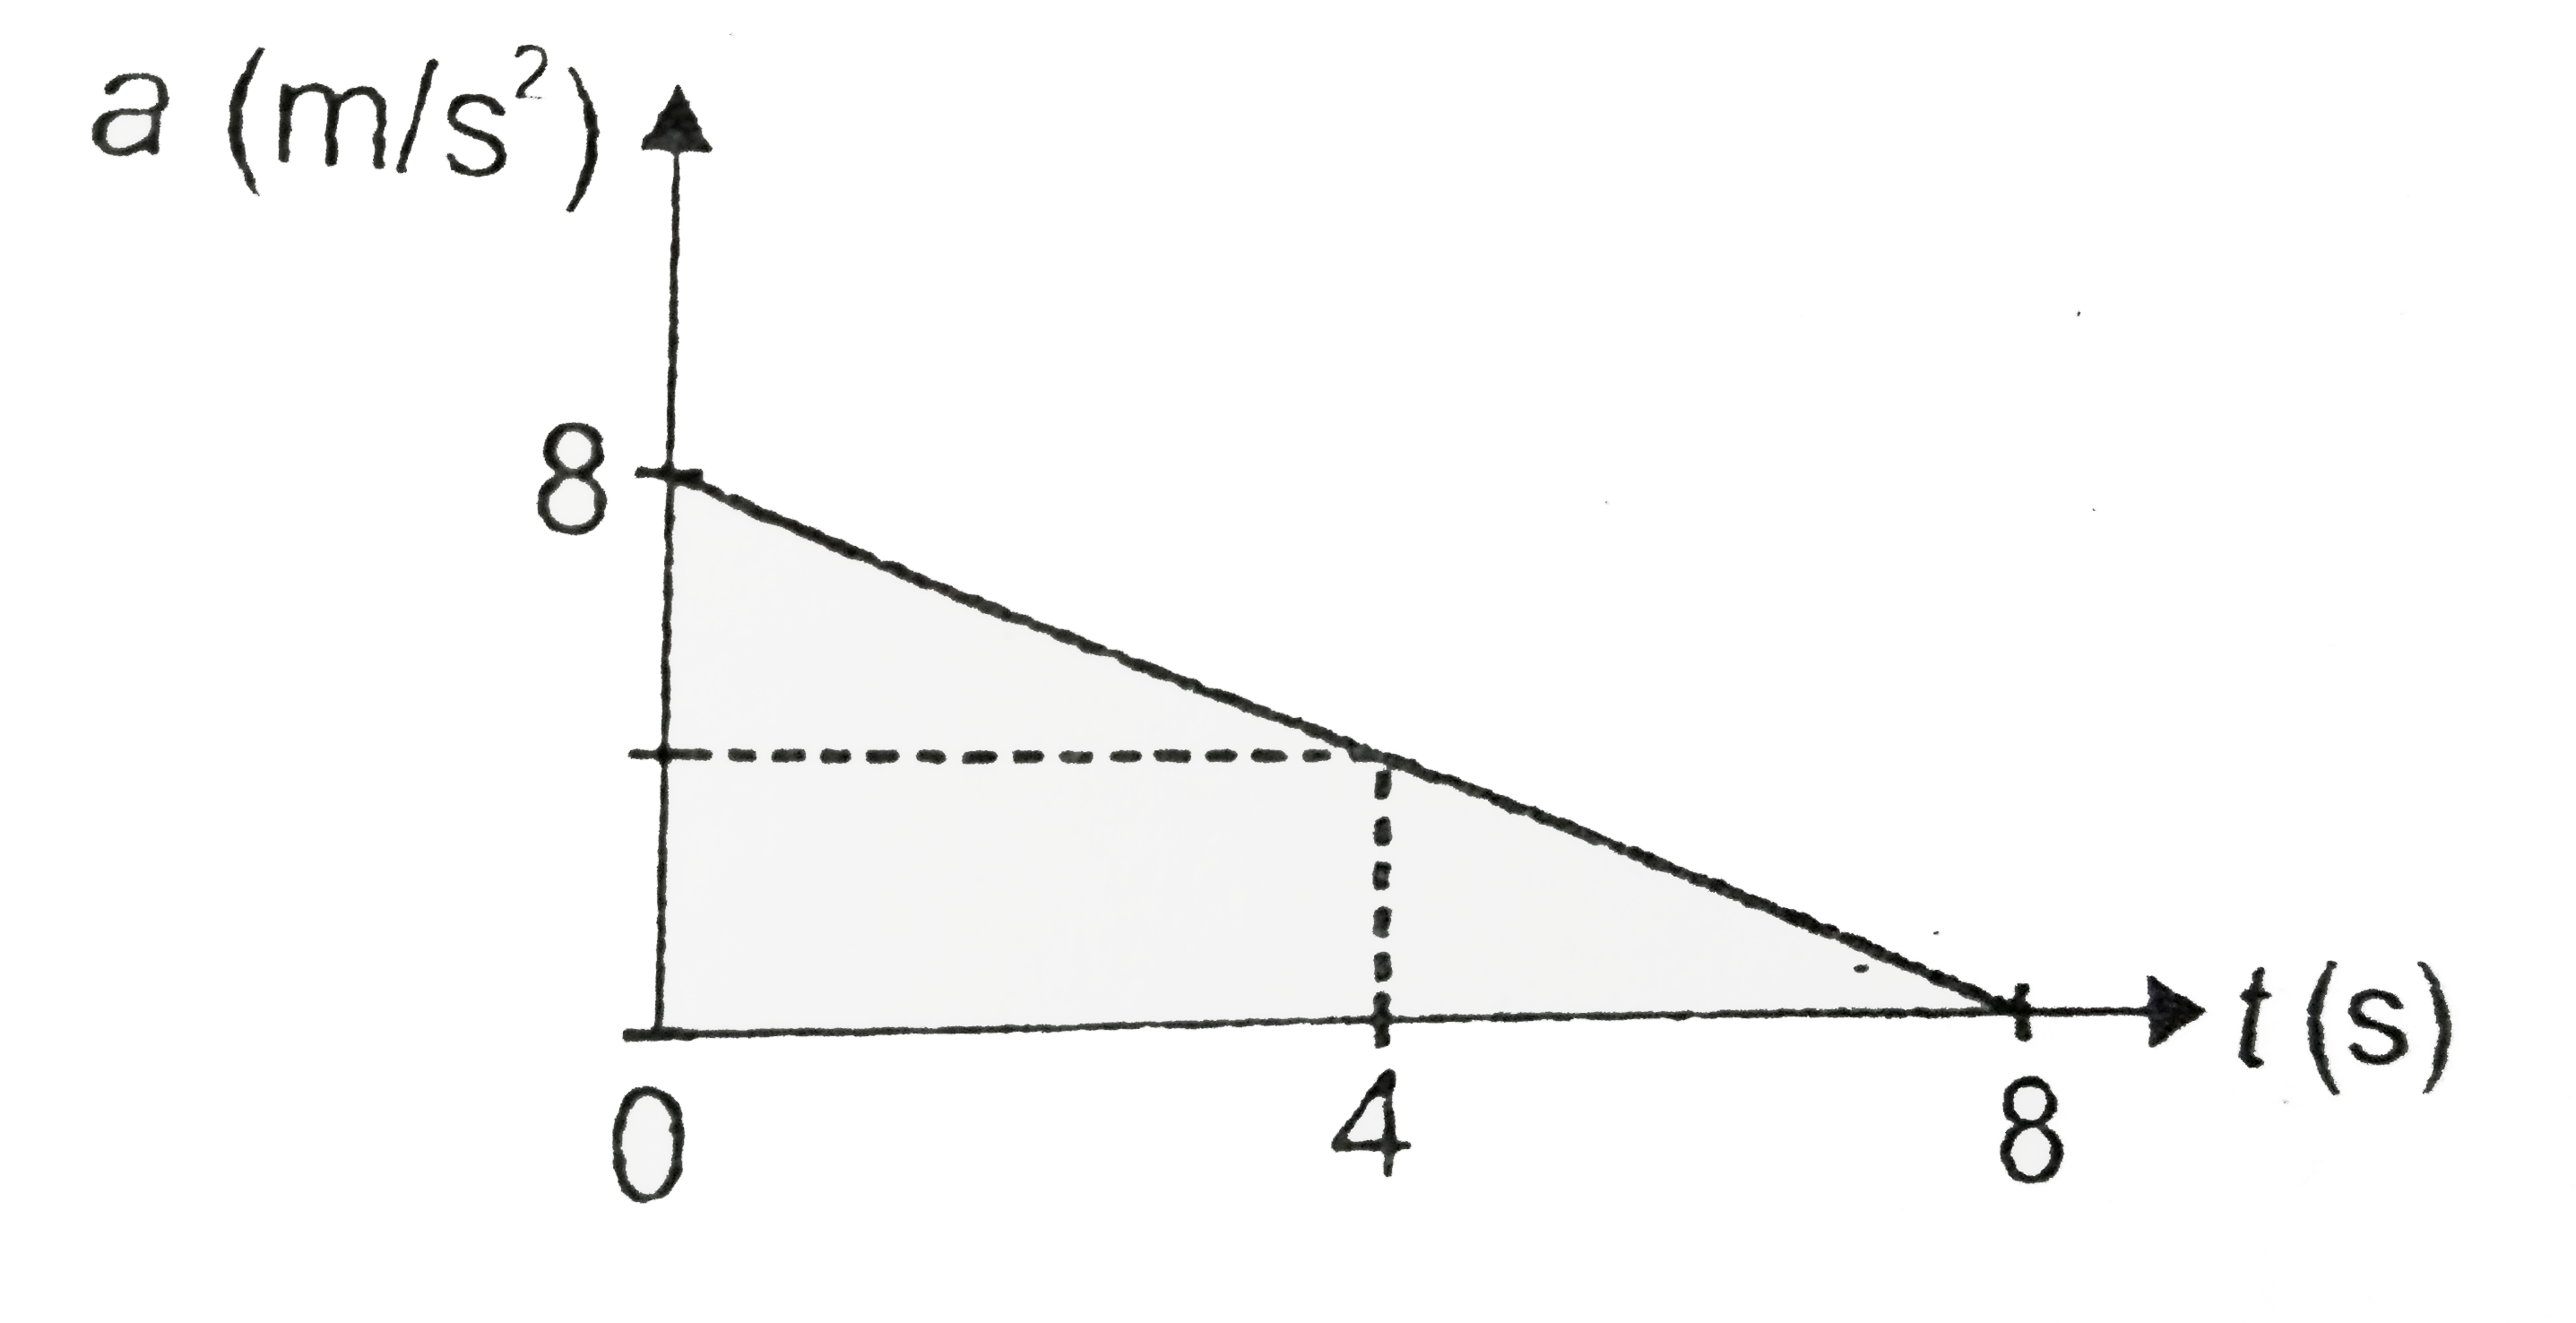
View SolutionThe velocity (v) - time (t) graph for a particle moving along x - axis is shown in the figure. The corresponding position (x) - time (t) is best represented by
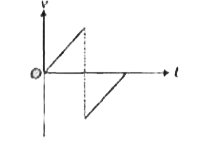
View SolutionThe velocity - time graph of a particle moving along a straight line is shown in the figure given below
The displacement of the particle in 5 second is
View SolutionThe velocity-time graph for a particle moving along X-axis is shown in the figure. The corresponding displacement-time graph is correctly shown by
View SolutionThe kinetic energy (KE) versus time graph for a particle moving along a straight line is as shown in the figure. The force versus time graph for the particle may be

View Solution

