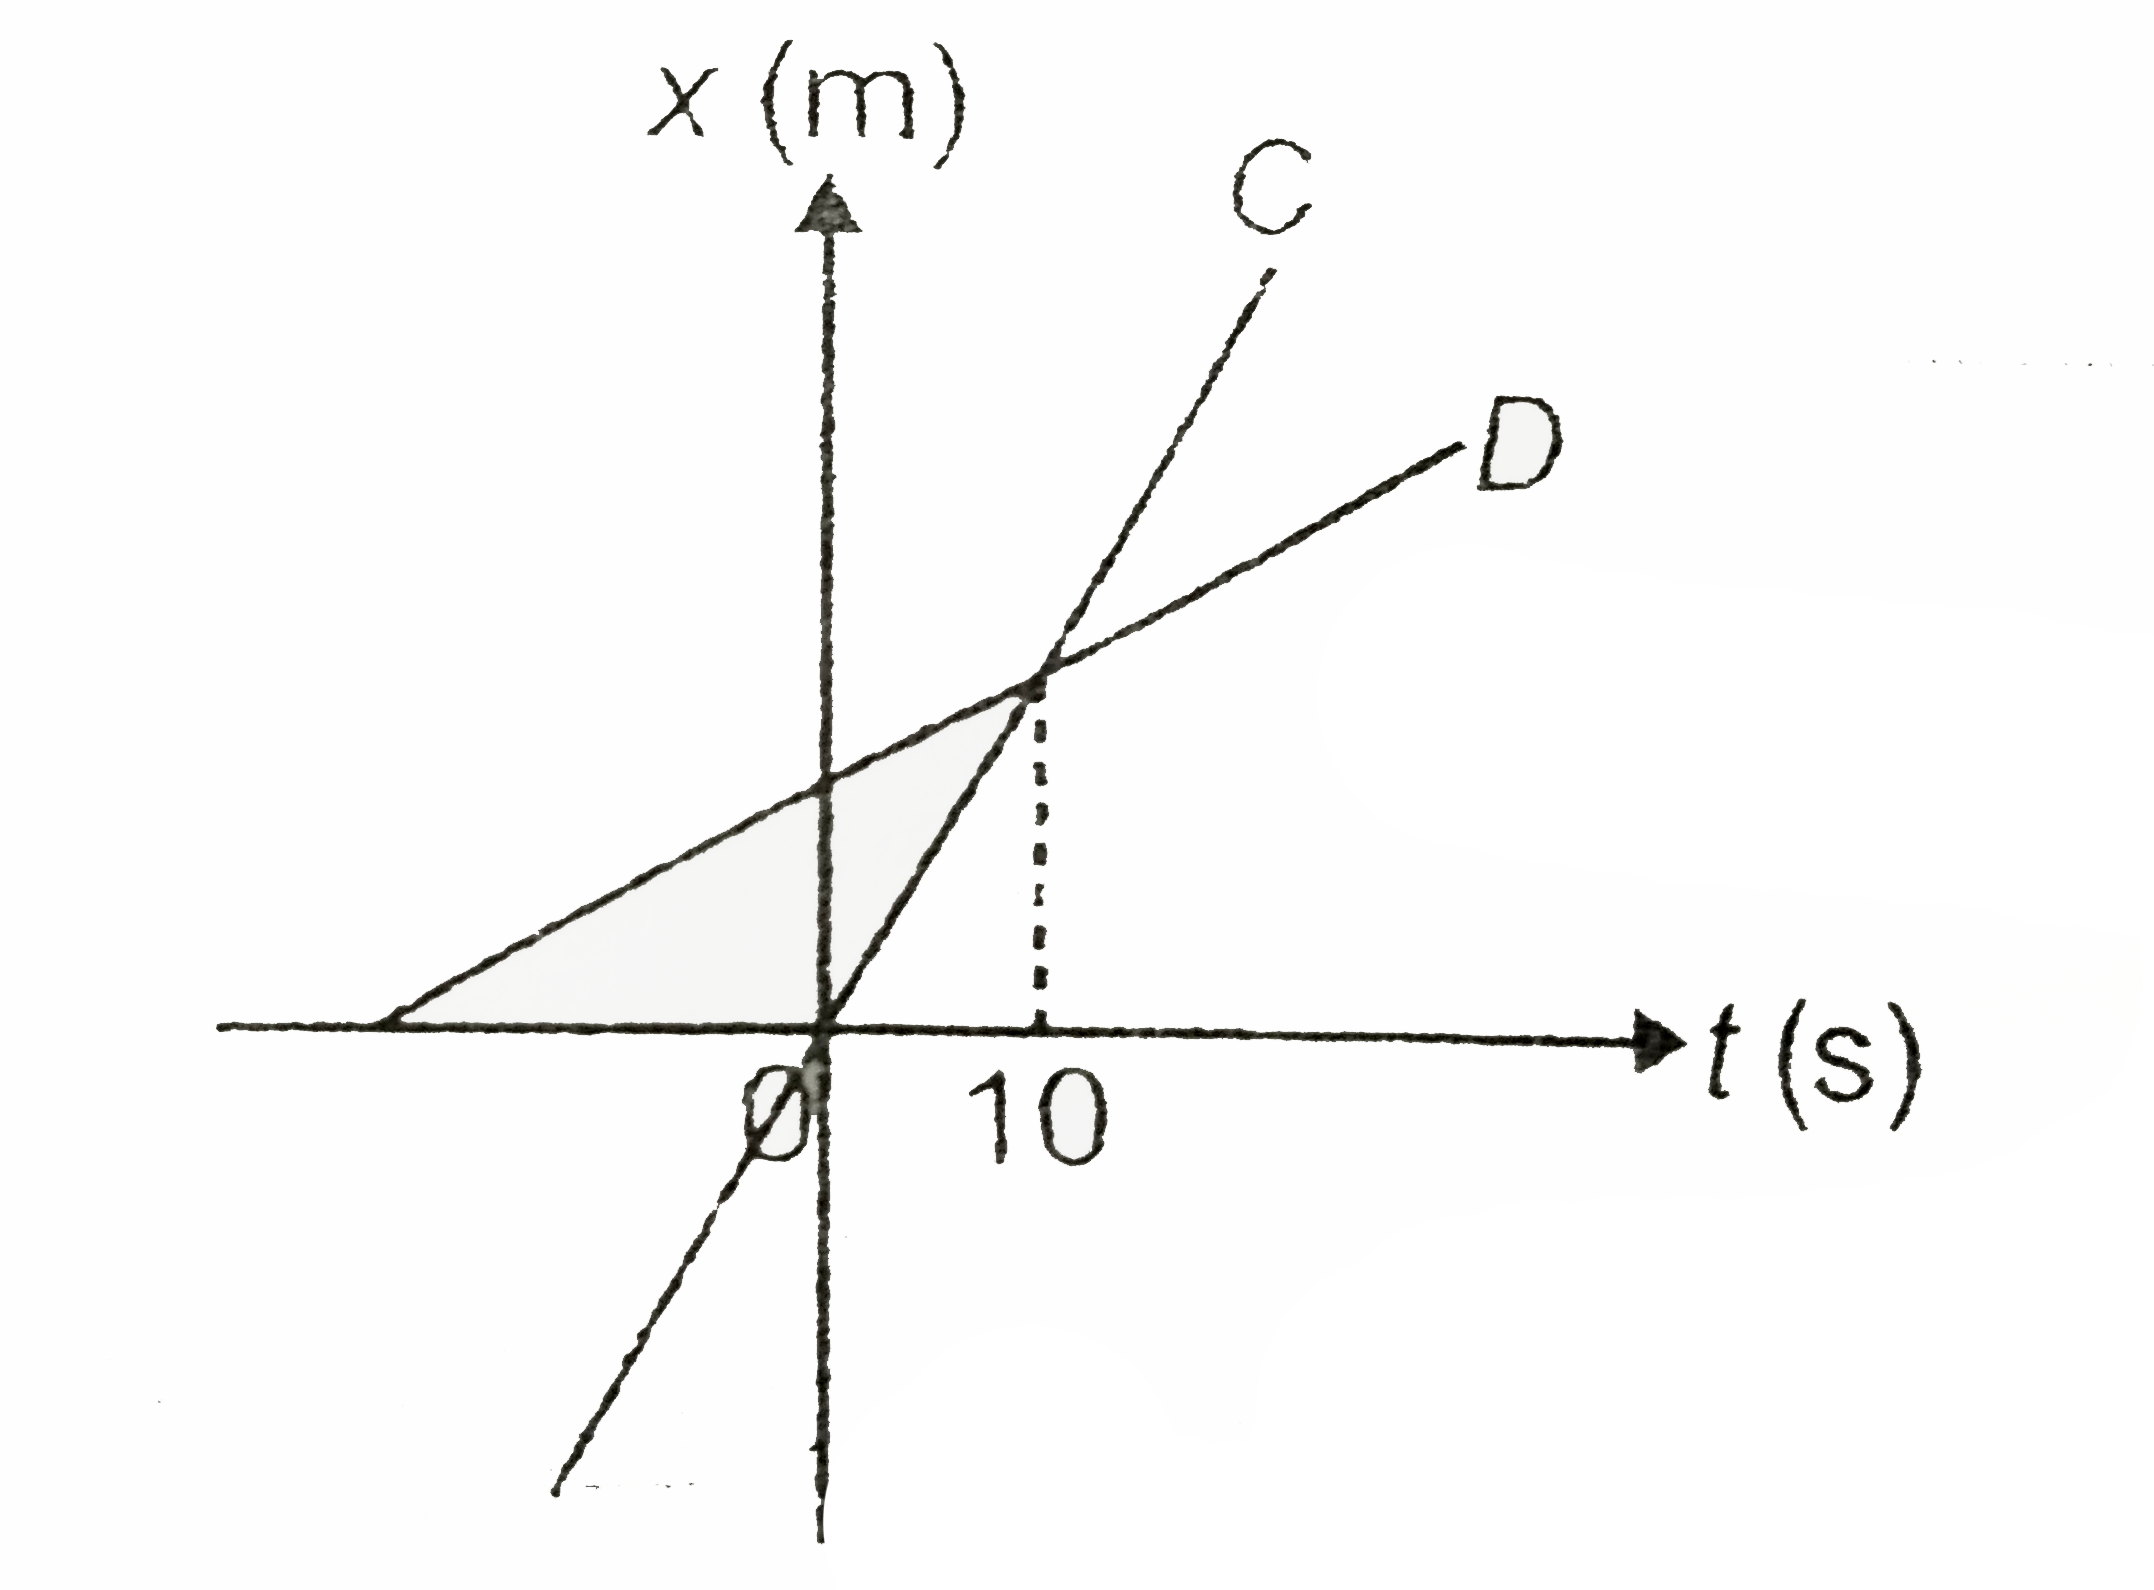
The figure shows position time graph of two riders C and D. Based on the information represented by the graph, answer the following questions.
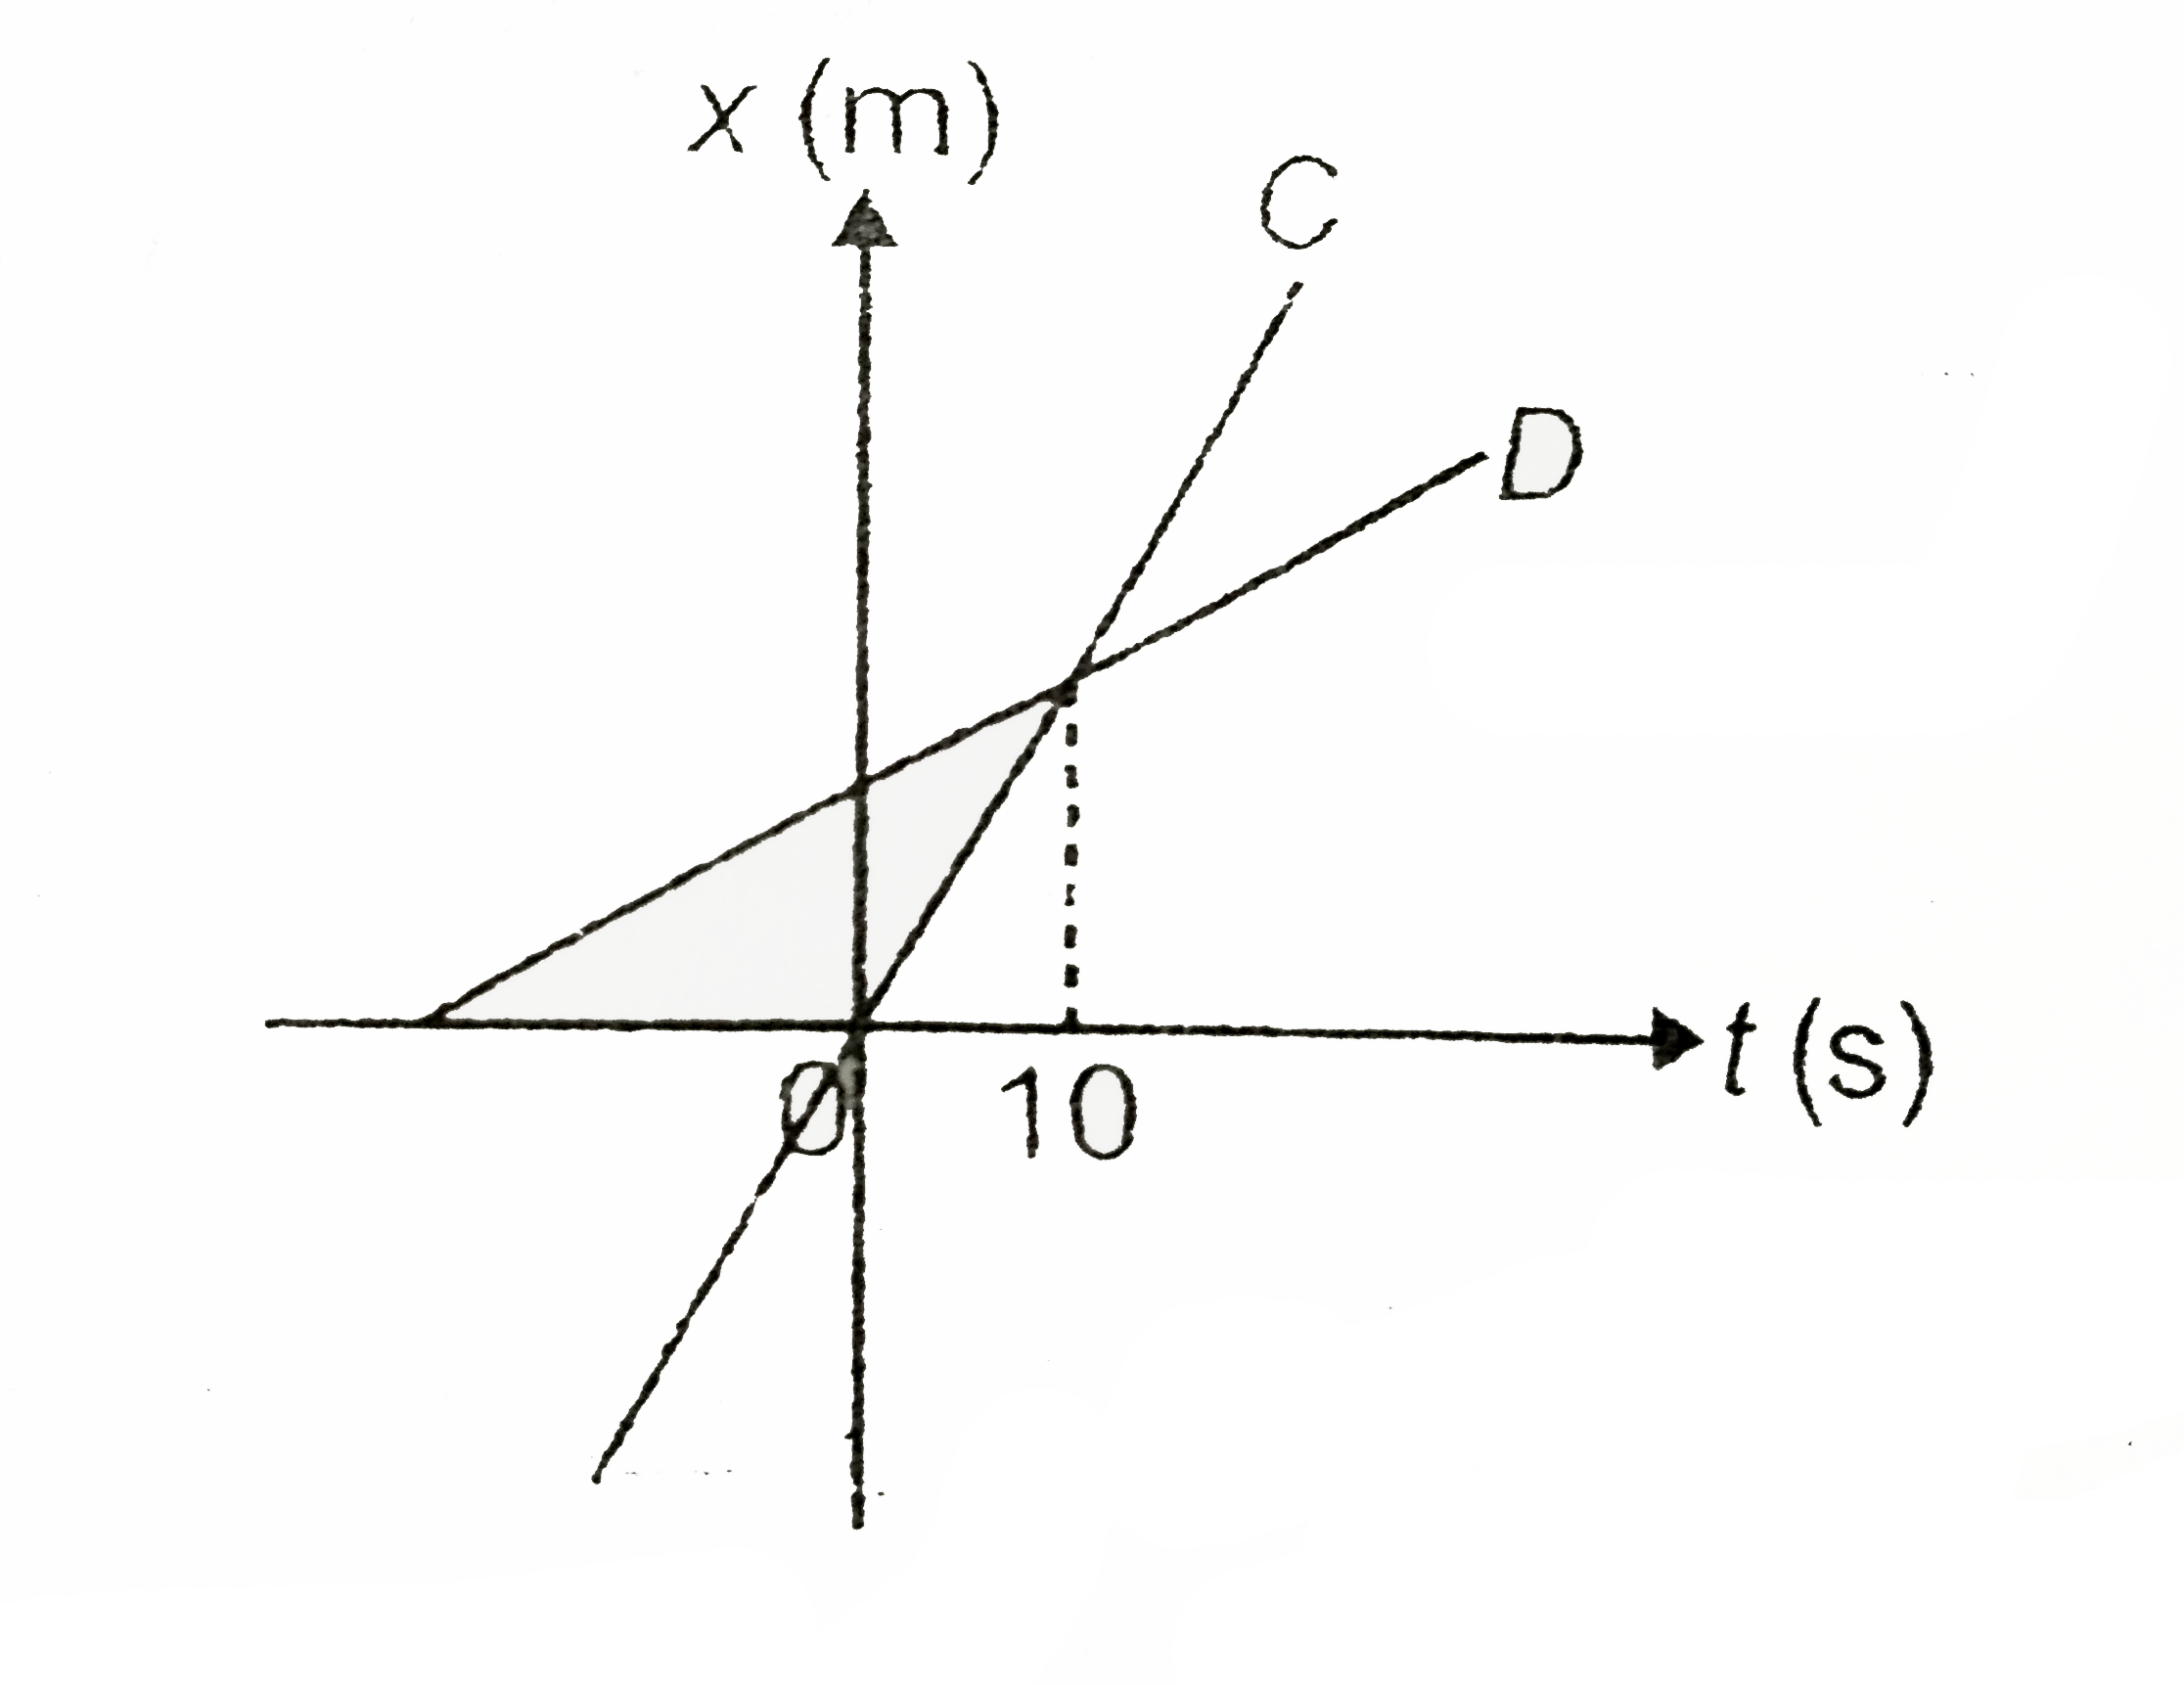
At t = 10 s
C and D are at the same position
C and D have the same velocity
The velocity of D is greater than the velocity of C
C is in front of D
The correct Answer is:A
Step by step video & image solution for The figure shows position time graph of two riders C and D. Based on the information represented by the graph, answer the following questions. At t = 10 s by Physics experts to help you in doubts & scoring excellent marks in Class 12 exams.
Updated on:21/07/2023Topper's Solved these Questions
- MOTION IN STRAIGHT LINEBOOK - AAKASH INSTITUTECHAPTER - MOTION IN STRAIGHT LINEEXERCISE - Assignment (SECTION - E)
8 Videos
- MOTION IN STRAIGHT LINEBOOK - AAKASH INSTITUTECHAPTER - MOTION IN STRAIGHT LINEEXERCISE - Assignment (SECTION - F)
1 Videos
- MOTION IN STRAIGHT LINEBOOK - AAKASH INSTITUTECHAPTER - MOTION IN STRAIGHT LINEEXERCISE - Assignment (SECTION - C)
7 Videos
- MOTION IN A STRAIGHT LINEBOOK - AAKASH INSTITUTECHAPTER - MOTION IN A STRAIGHT LINEEXERCISE - ASSIGNMENT (SECTION - D)
15 Videos
- MOVING CHARGE AND MAGNESIUMBOOK - AAKASH INSTITUTECHAPTER - MOVING CHARGE AND MAGNESIUMEXERCISE - SECTION D
16 Videos
Similar Questions
The figure shows position time graph of two riders C and D. Based on the information represented by the graph, answer the following questions.
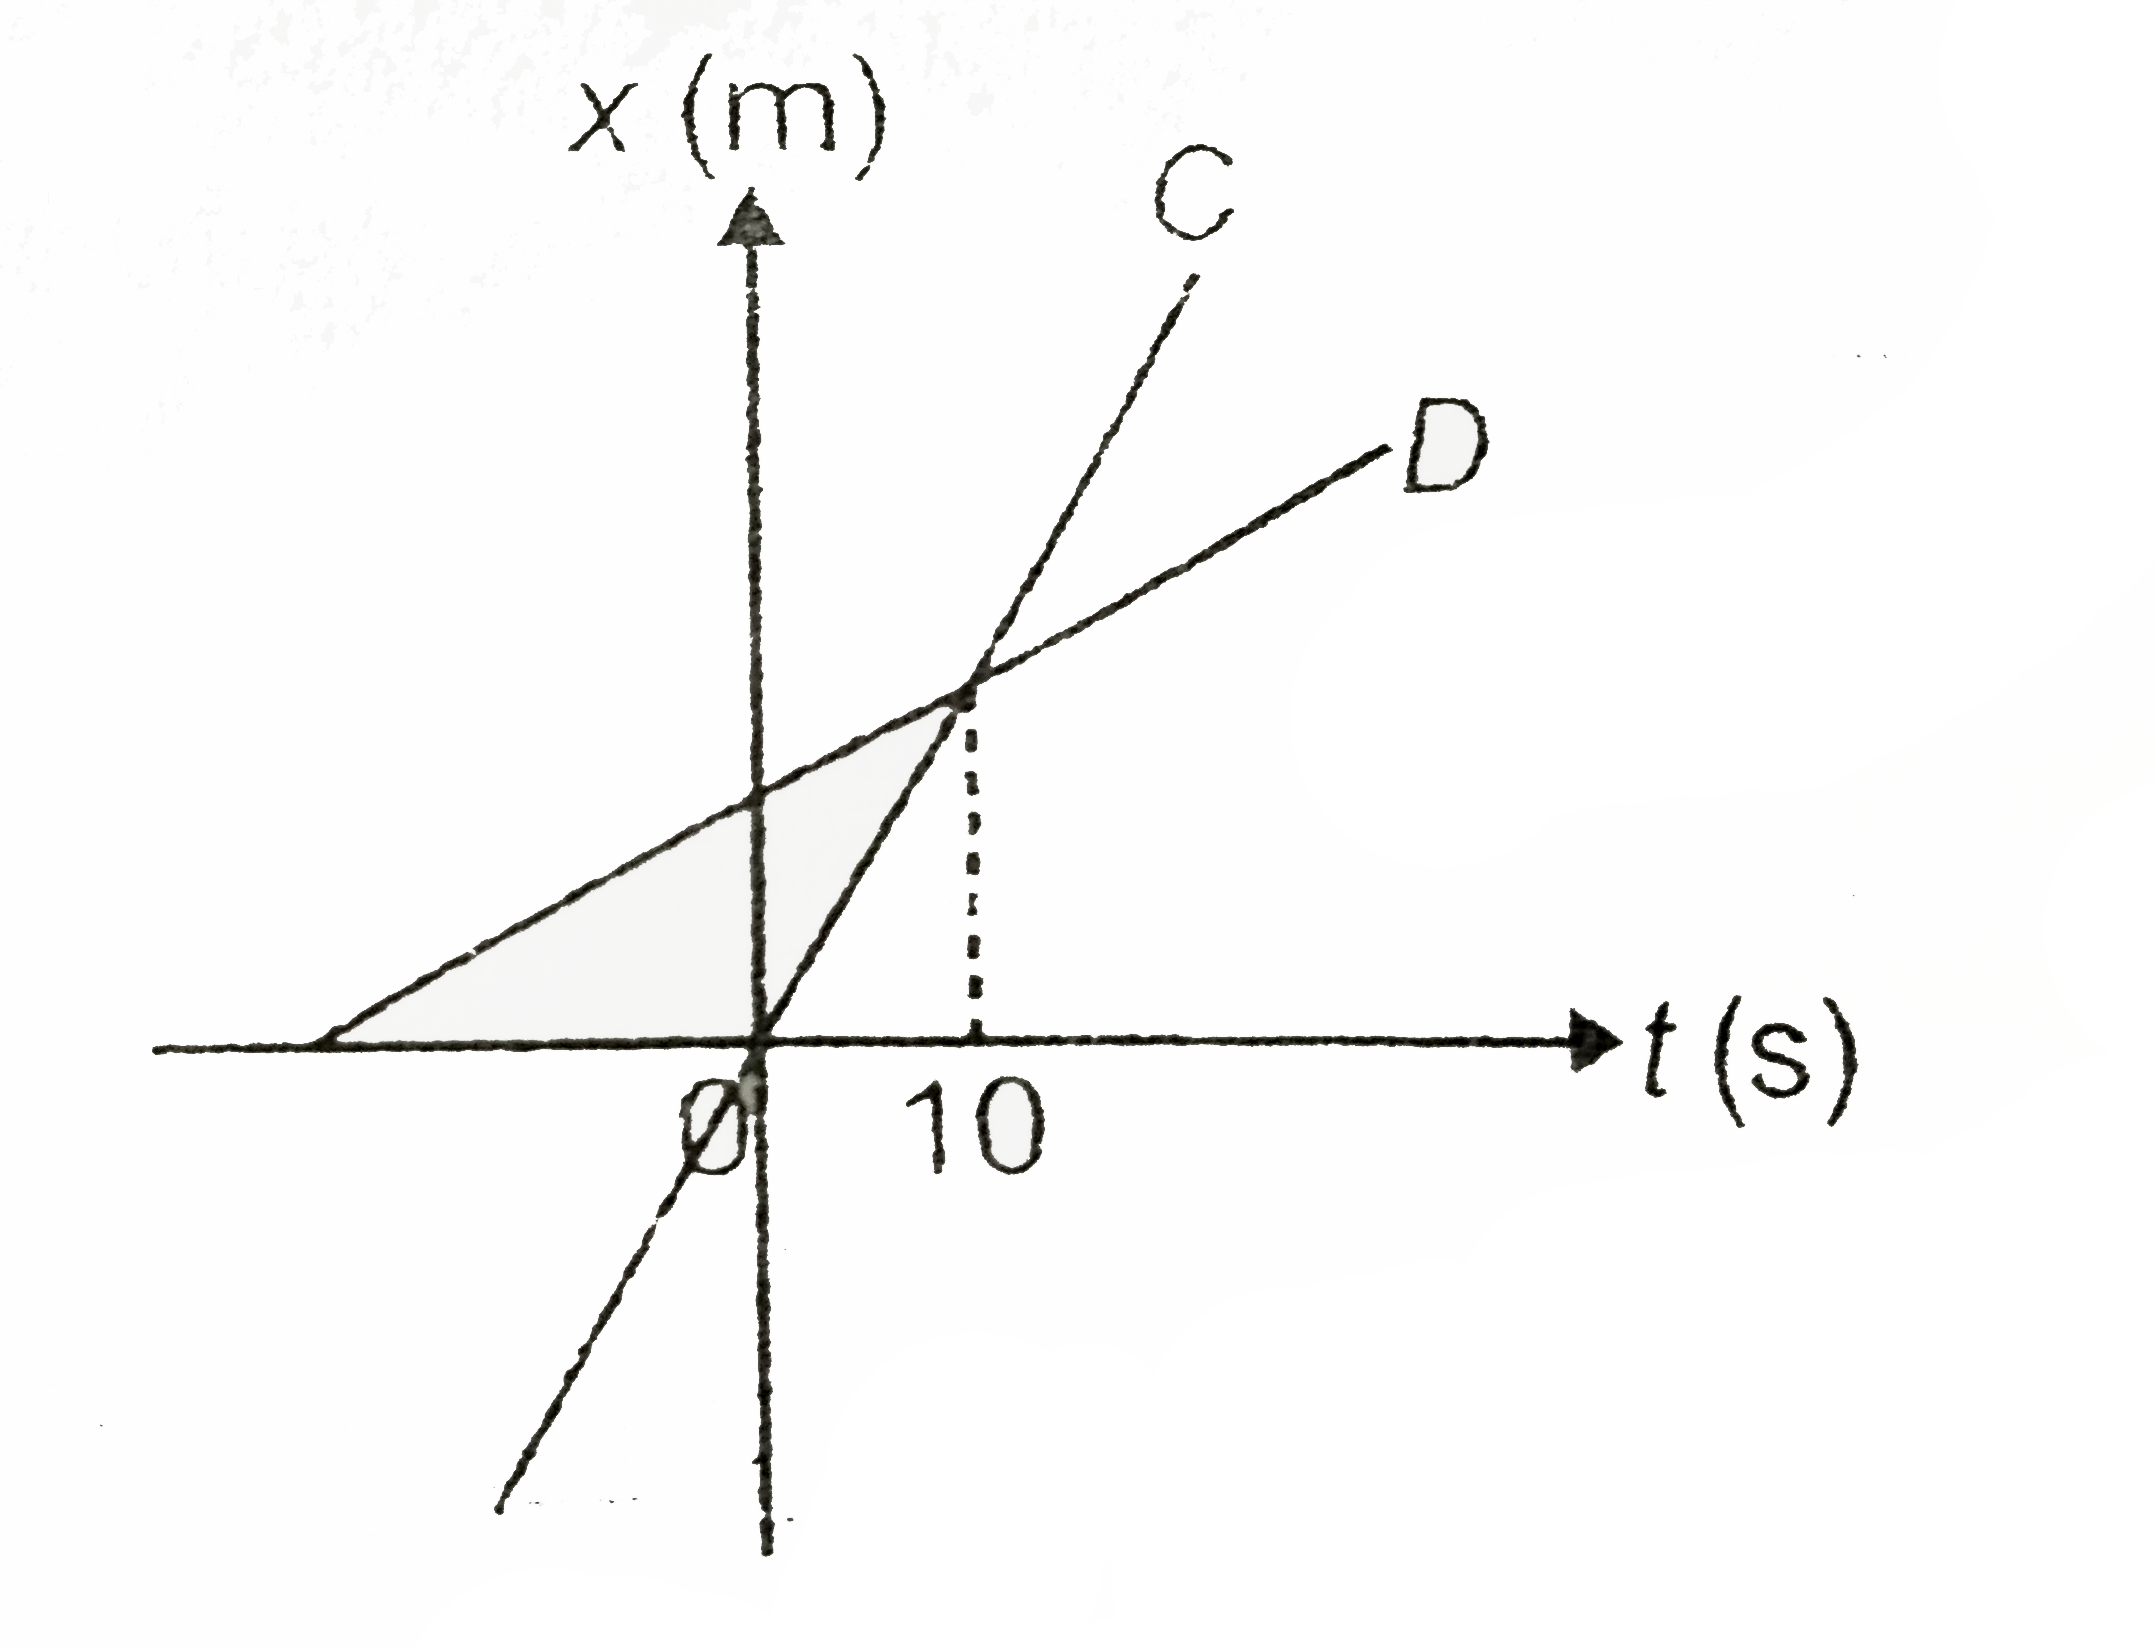
At t = 0 s
View SolutionThe figure shows position time graph of two riders C and D. Based on the information represented by the graph, answer the following questions.
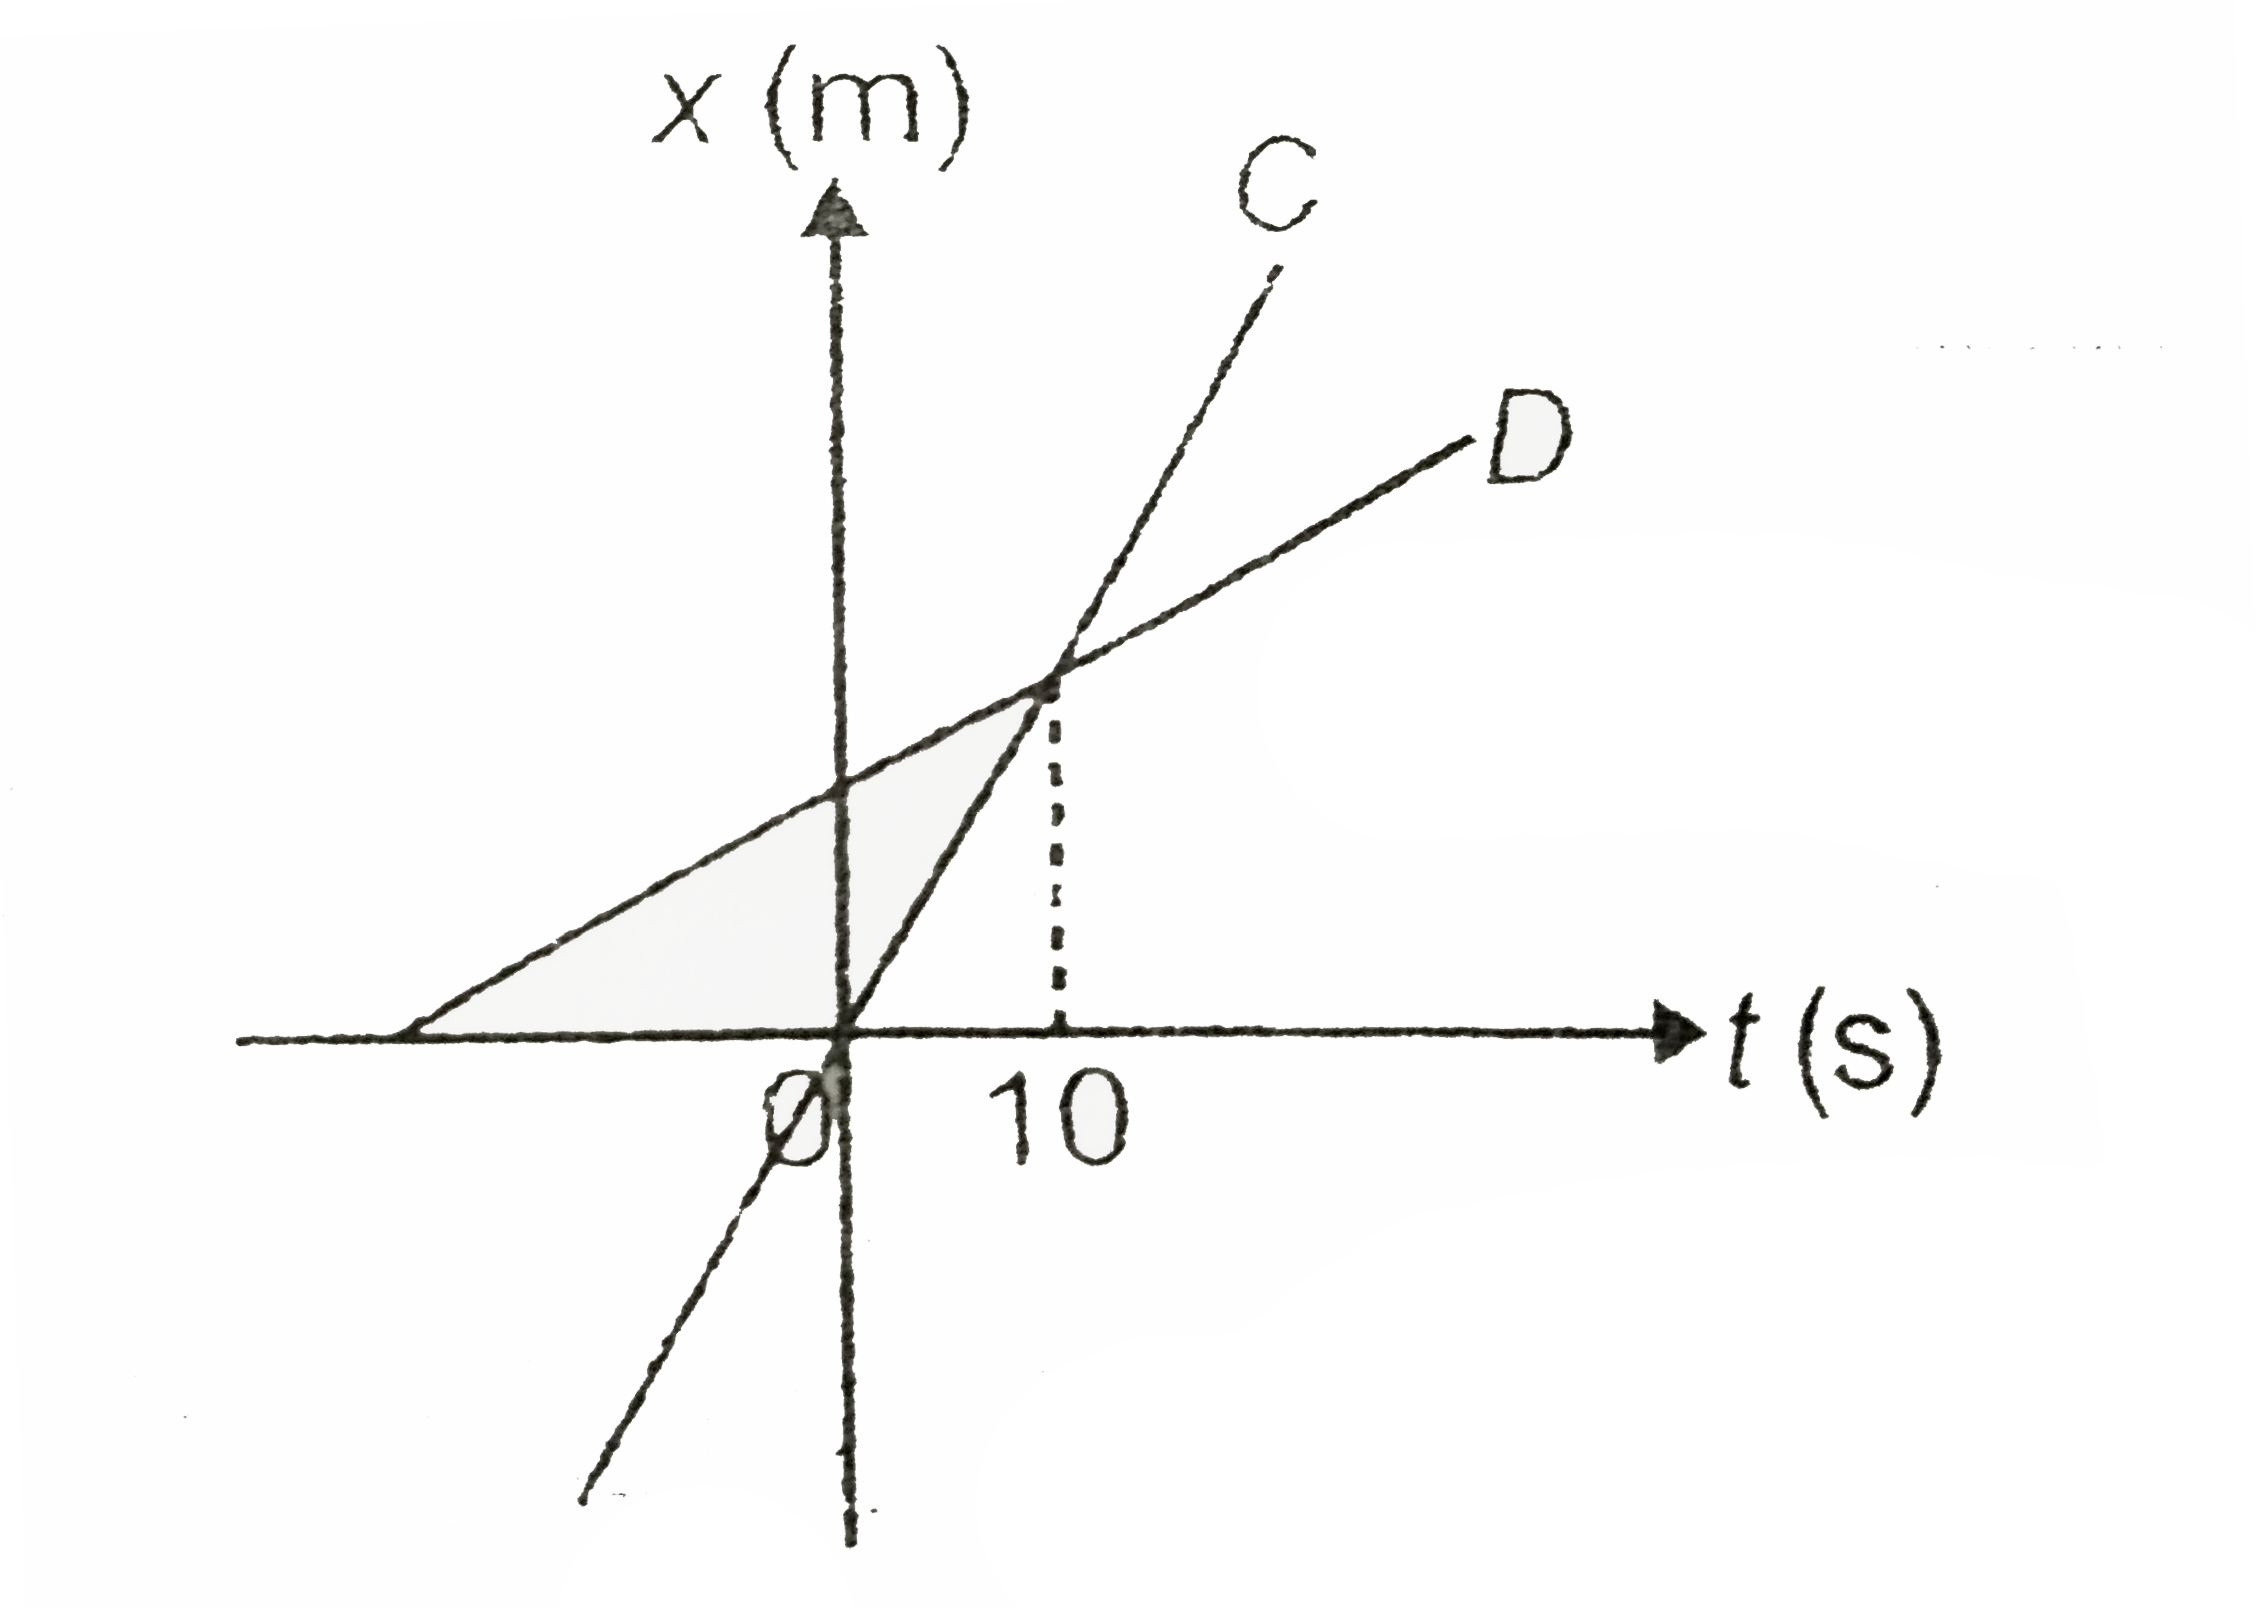
At t = 0 s
View Solution
Knowledge Check
Figure shows position-time graph of two cars A and B.
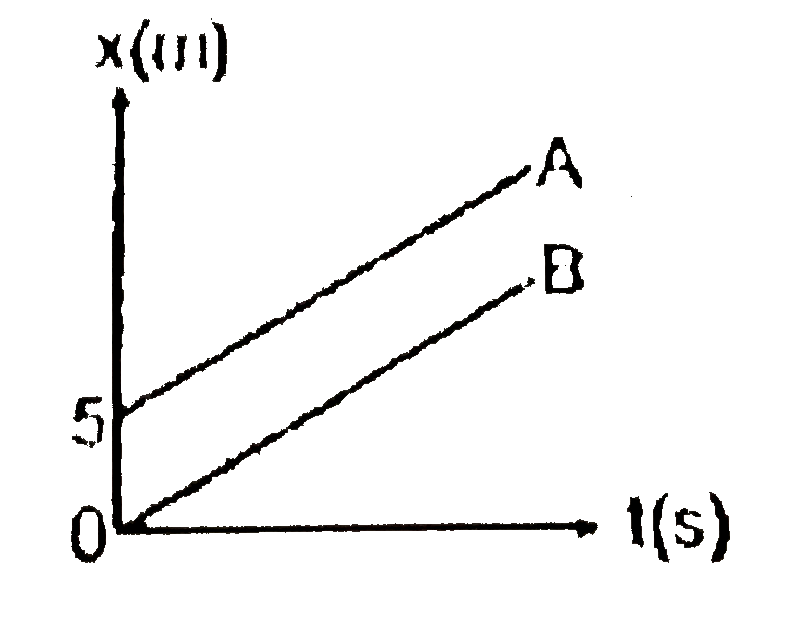 ACar A is faster than car B.BCar B is faster than car A.CBoth cars are moving with same velocity.DBoth cars have positive acceleration.
The figure shows position time graph of two riders C and D. Based on the information represented by the graph, answer the following questions.
At t = 0 s
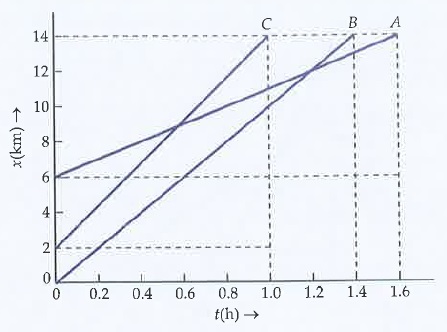
View SolutionFigure shows the position-time graphs of three car A, B and C. On the basis of the graphs, answer the following questions : What is the relative velocity of car C with respect to car A ?
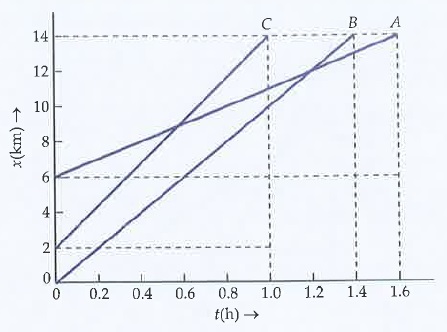
View SolutionFigure shows the position-time graphs of three car A, B and C. On the basis of the graphs, answer the following questions : What is the relative velocity of car B with respect to car C ?
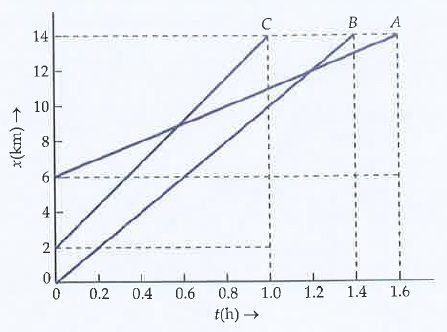
View SolutionFigure 3.64 shows the position-time graphs of three car A, B and C. On the basis of the graphs, answer the following questions : How far did car A travel between the time it passed cars B and C ?
View SolutionFigure 3.64 shows the position-time graphs of three car A, B and C. On the basis of the graphs, answer the following questions : When A passes C, where is B ?
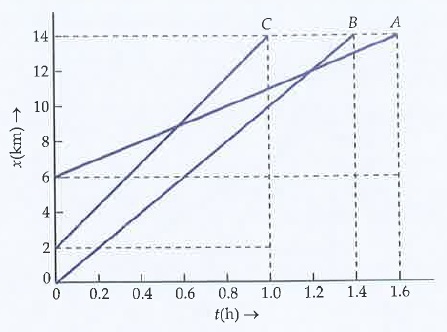
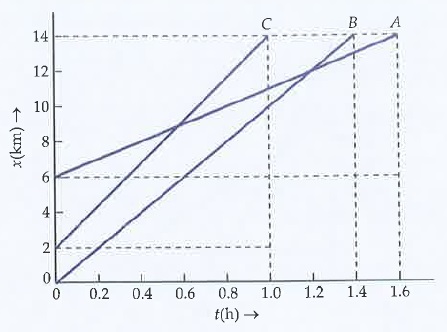
View SolutionFigure 3.64 shows the position-time graphs of three car A, B and C. On the basis of the graphs, answer the following questions : Which car has the highest speed and which the lowest ?
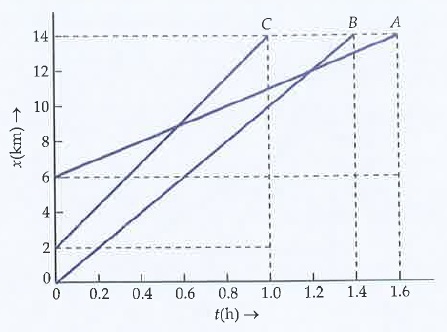
View SolutionFigure 3.64 shows the position-time graphs of three car A, B and C. On the basis of the graphs, answer the following questions : Are the three cars ever at the same point on the road ?
View Solution
