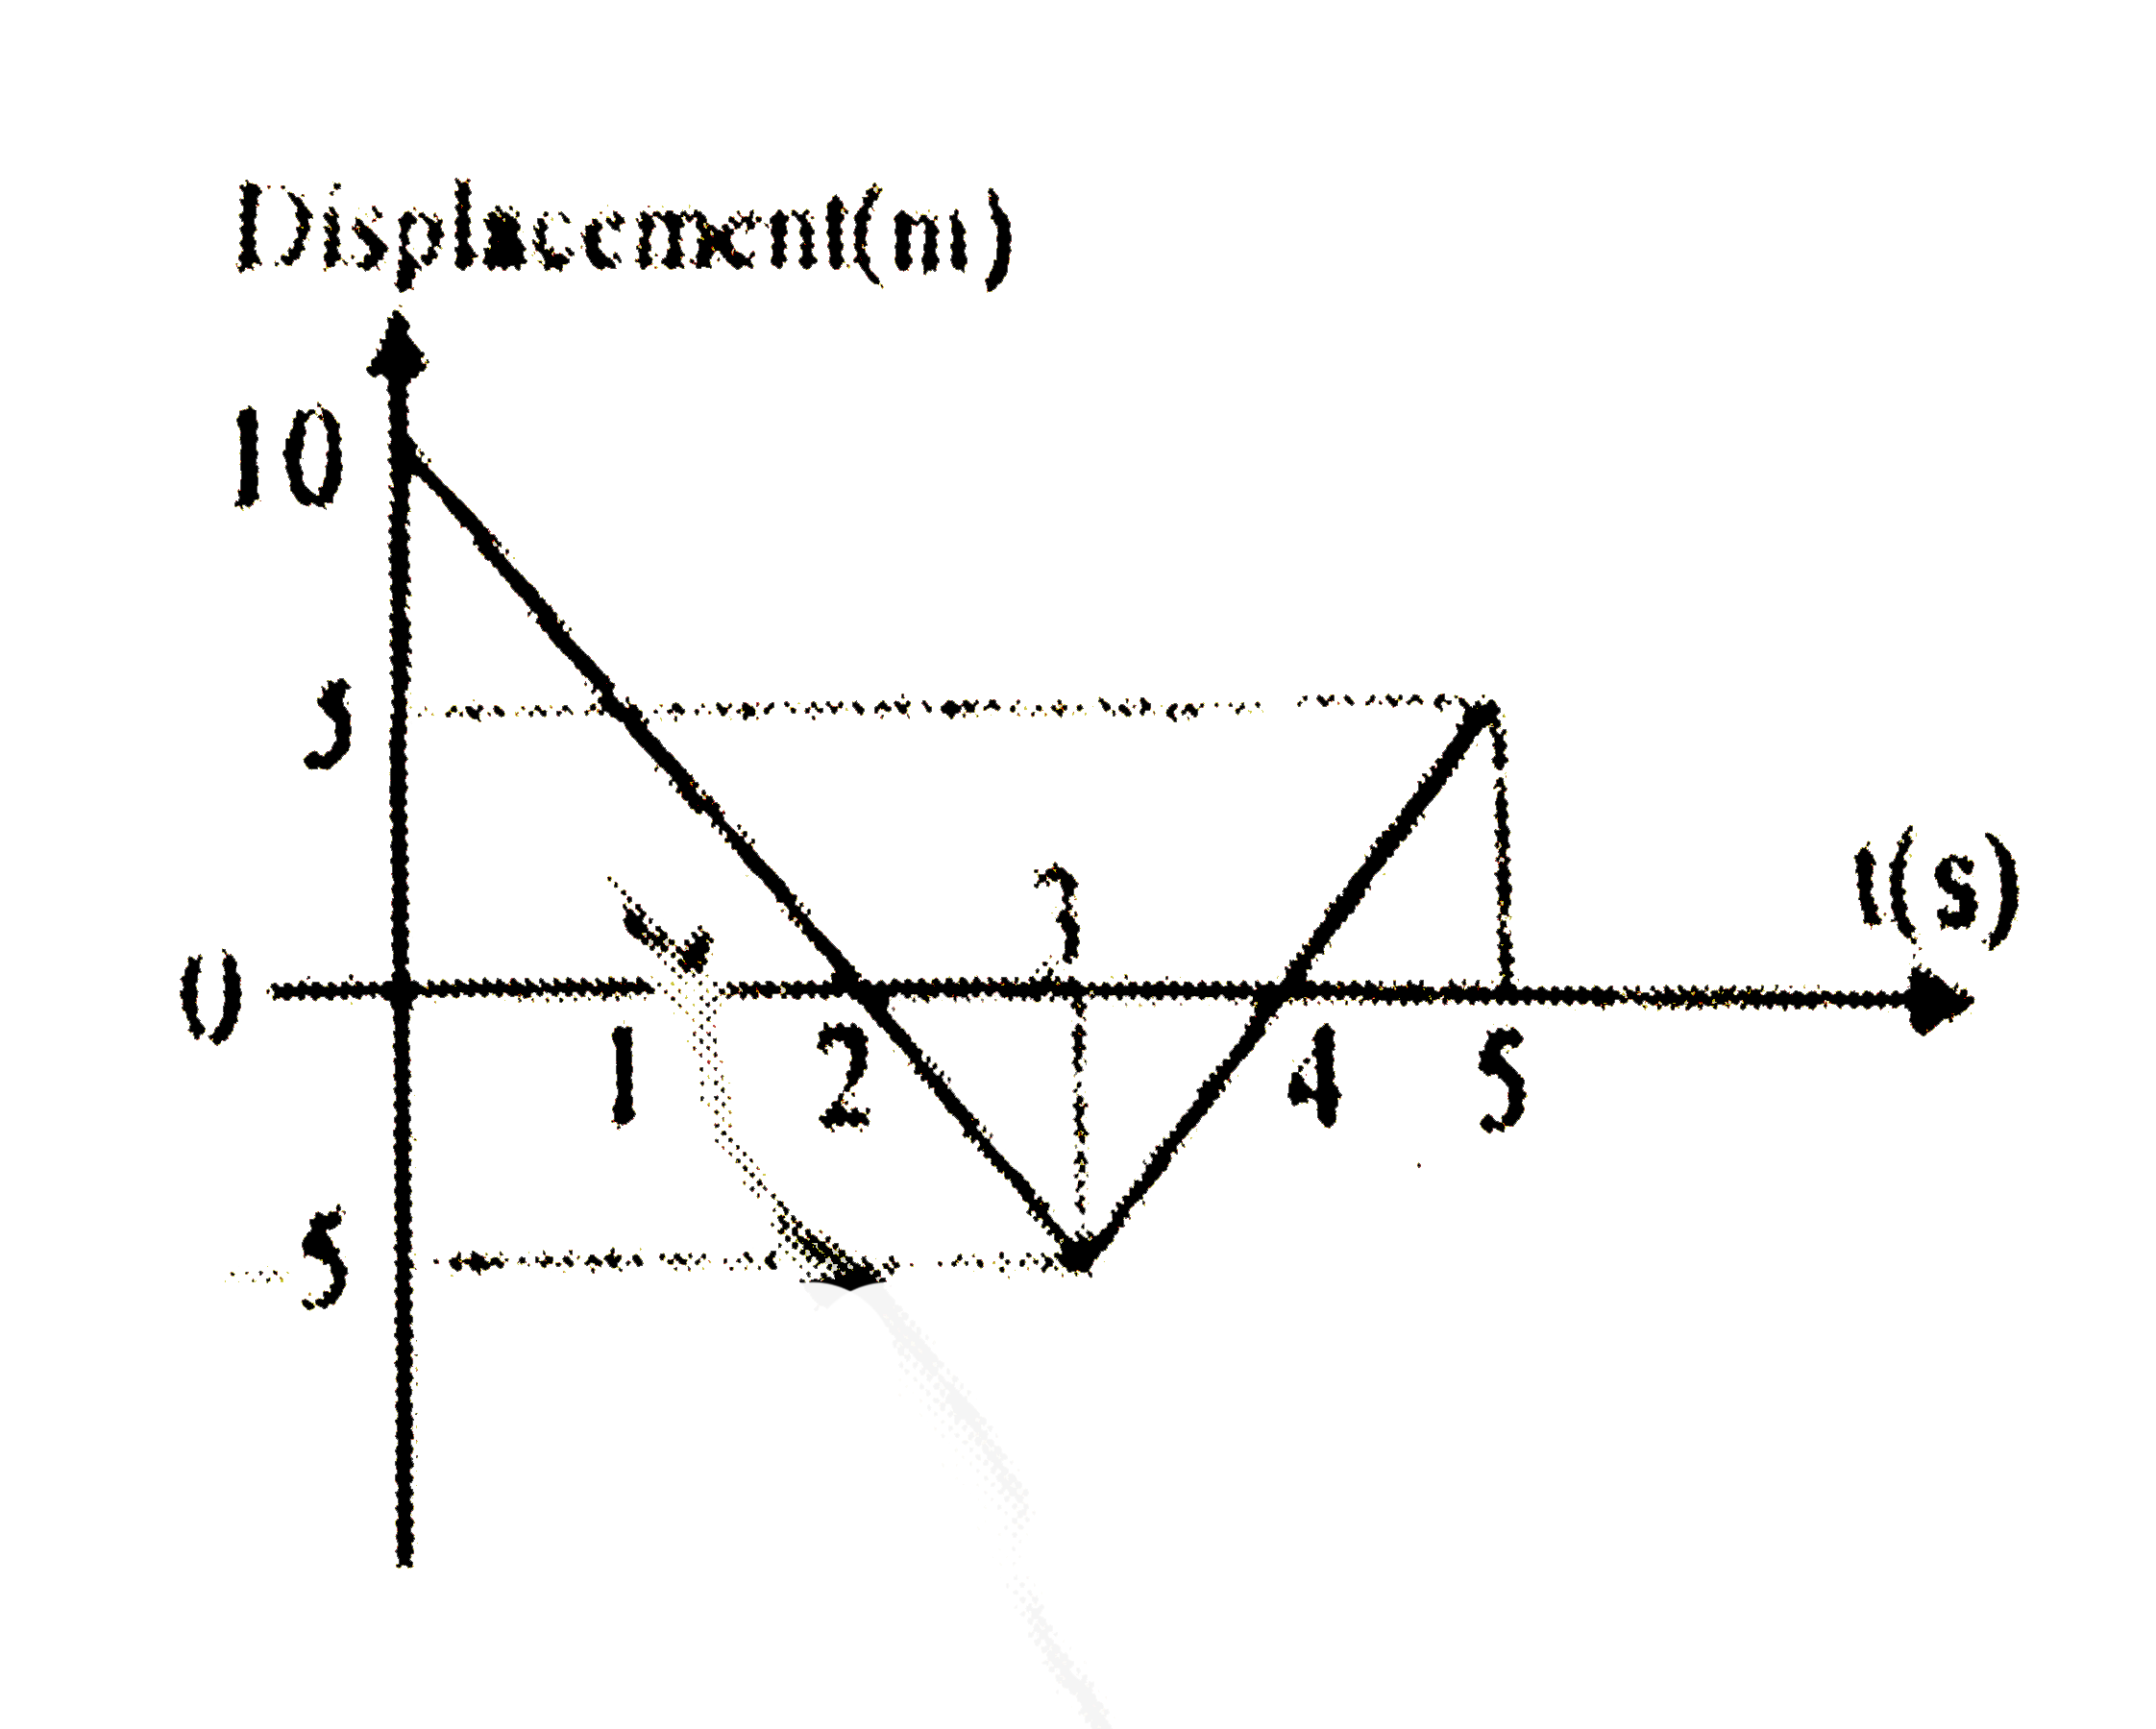
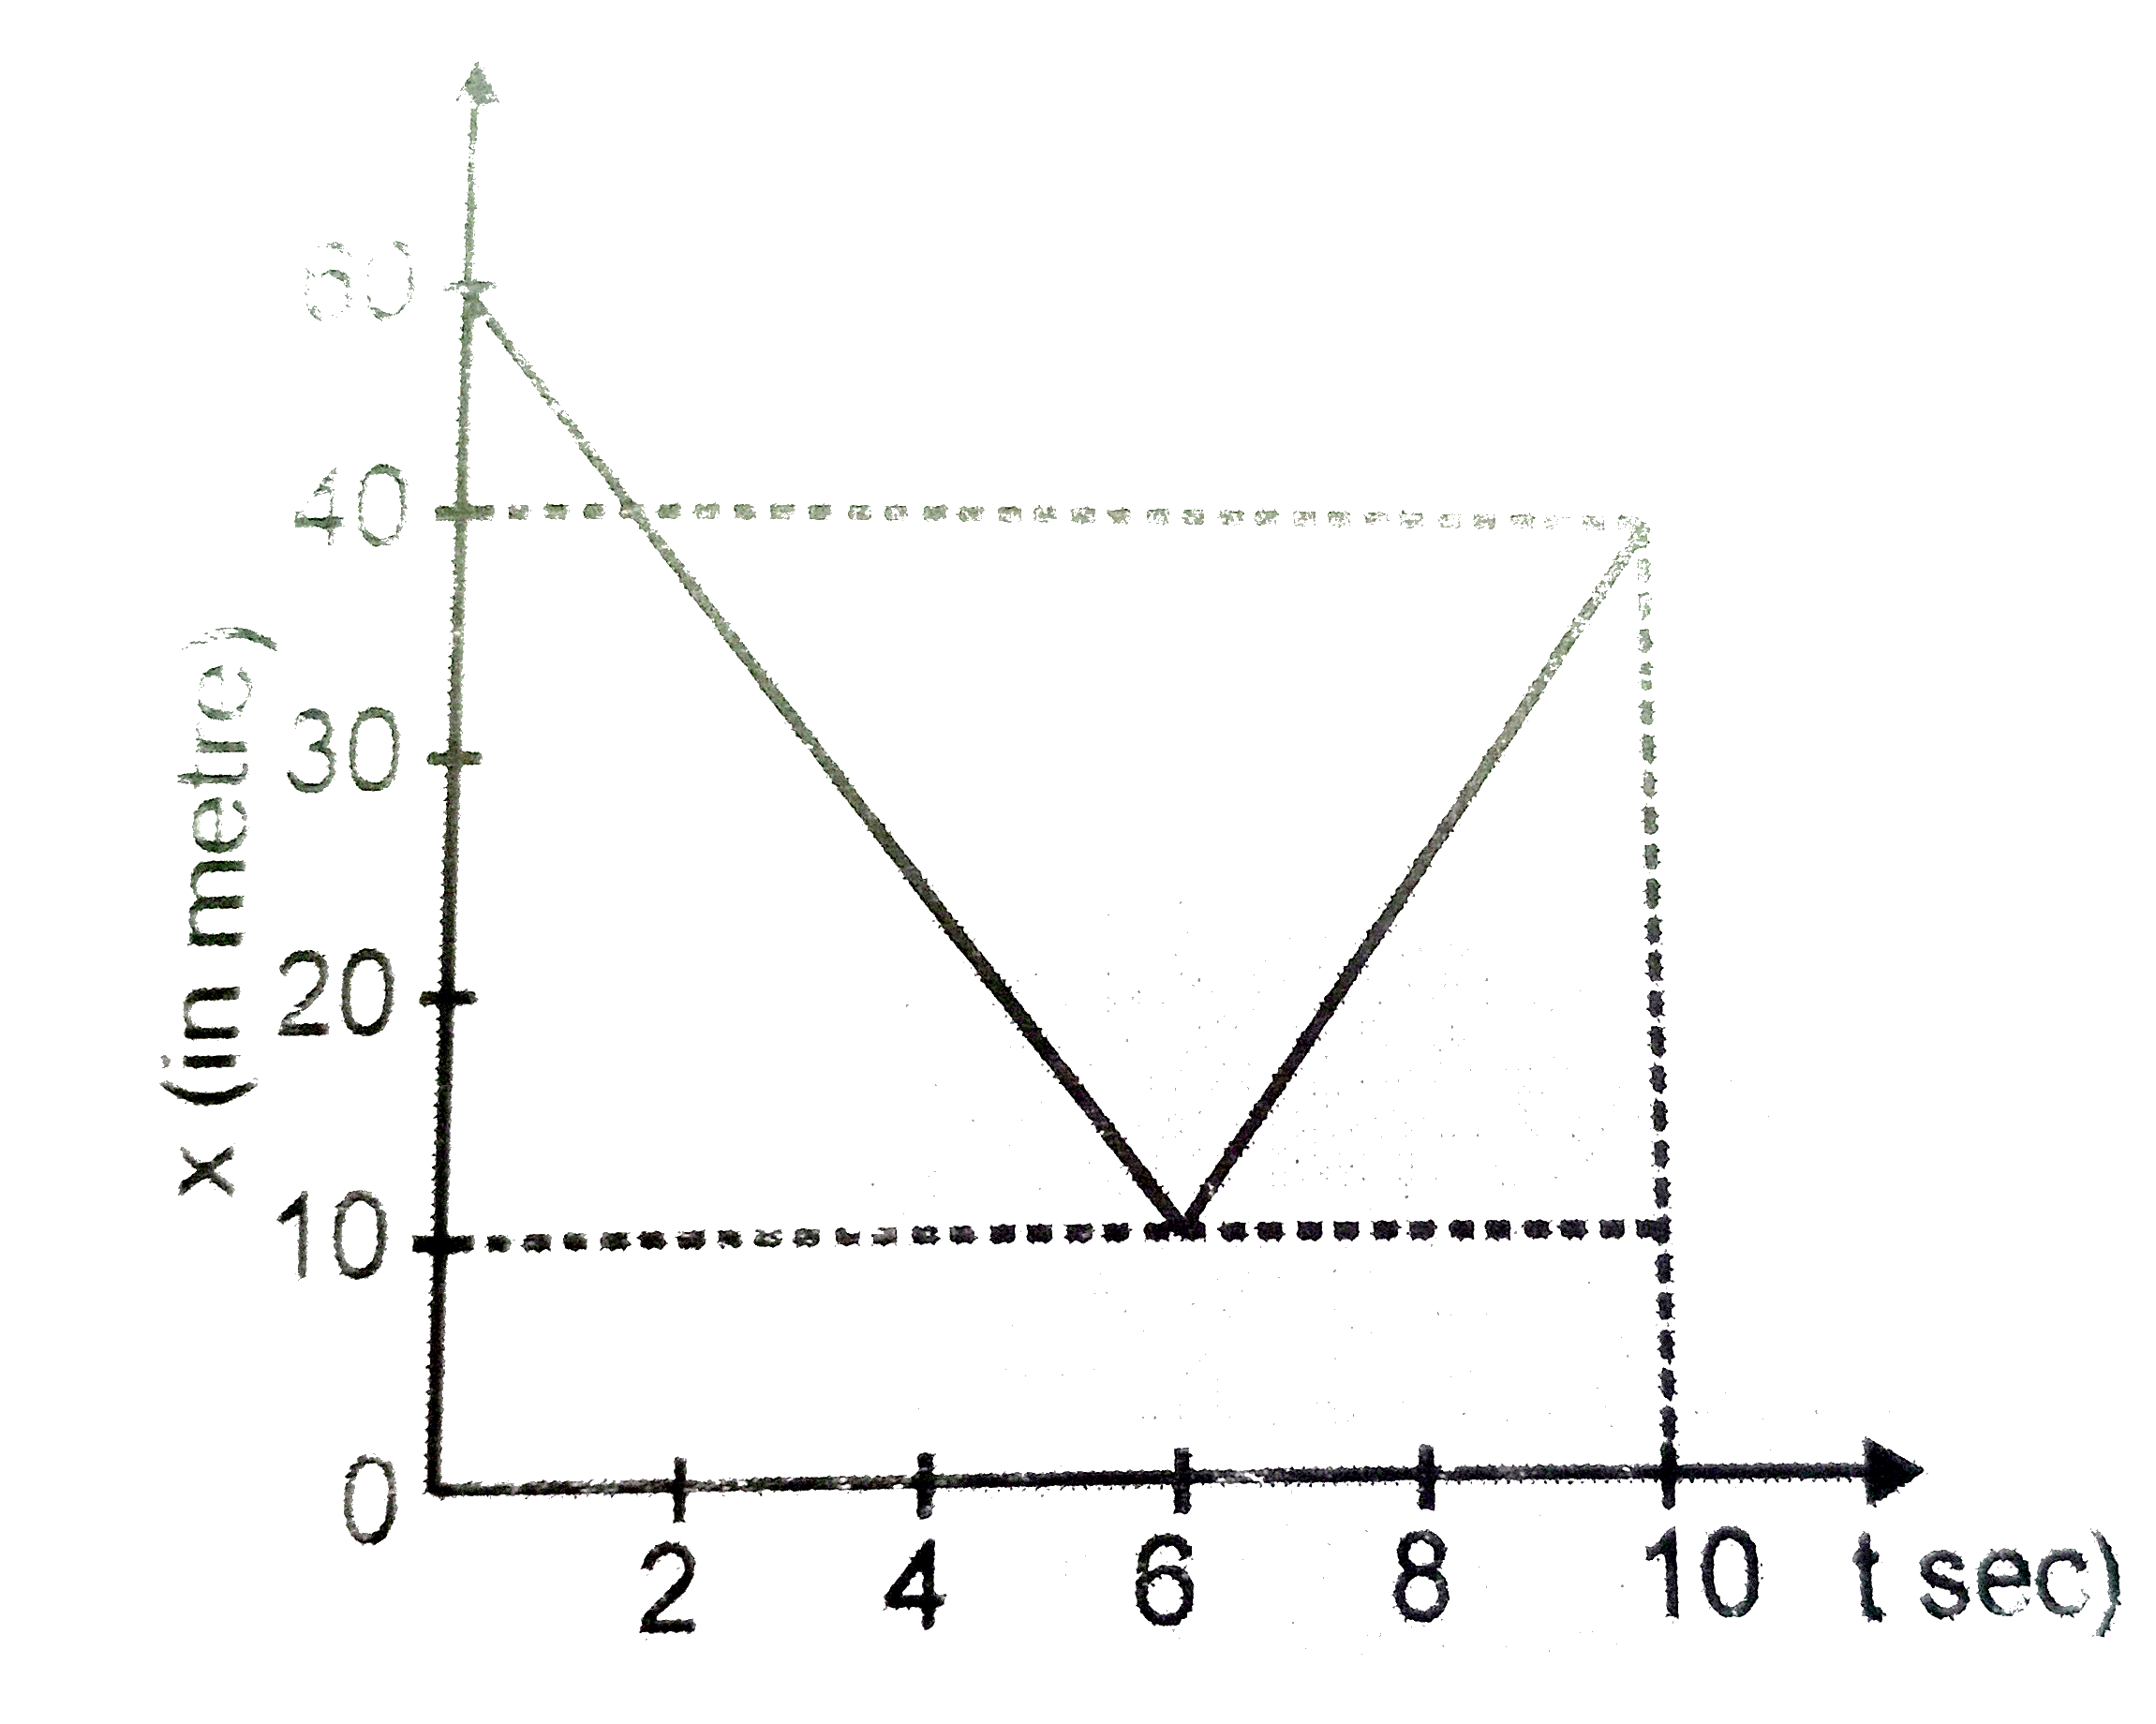
The diagram shows the displacement-time graph for the particle moving in a straight line. What is average speed (in m/s) for the interval 0-10 s?
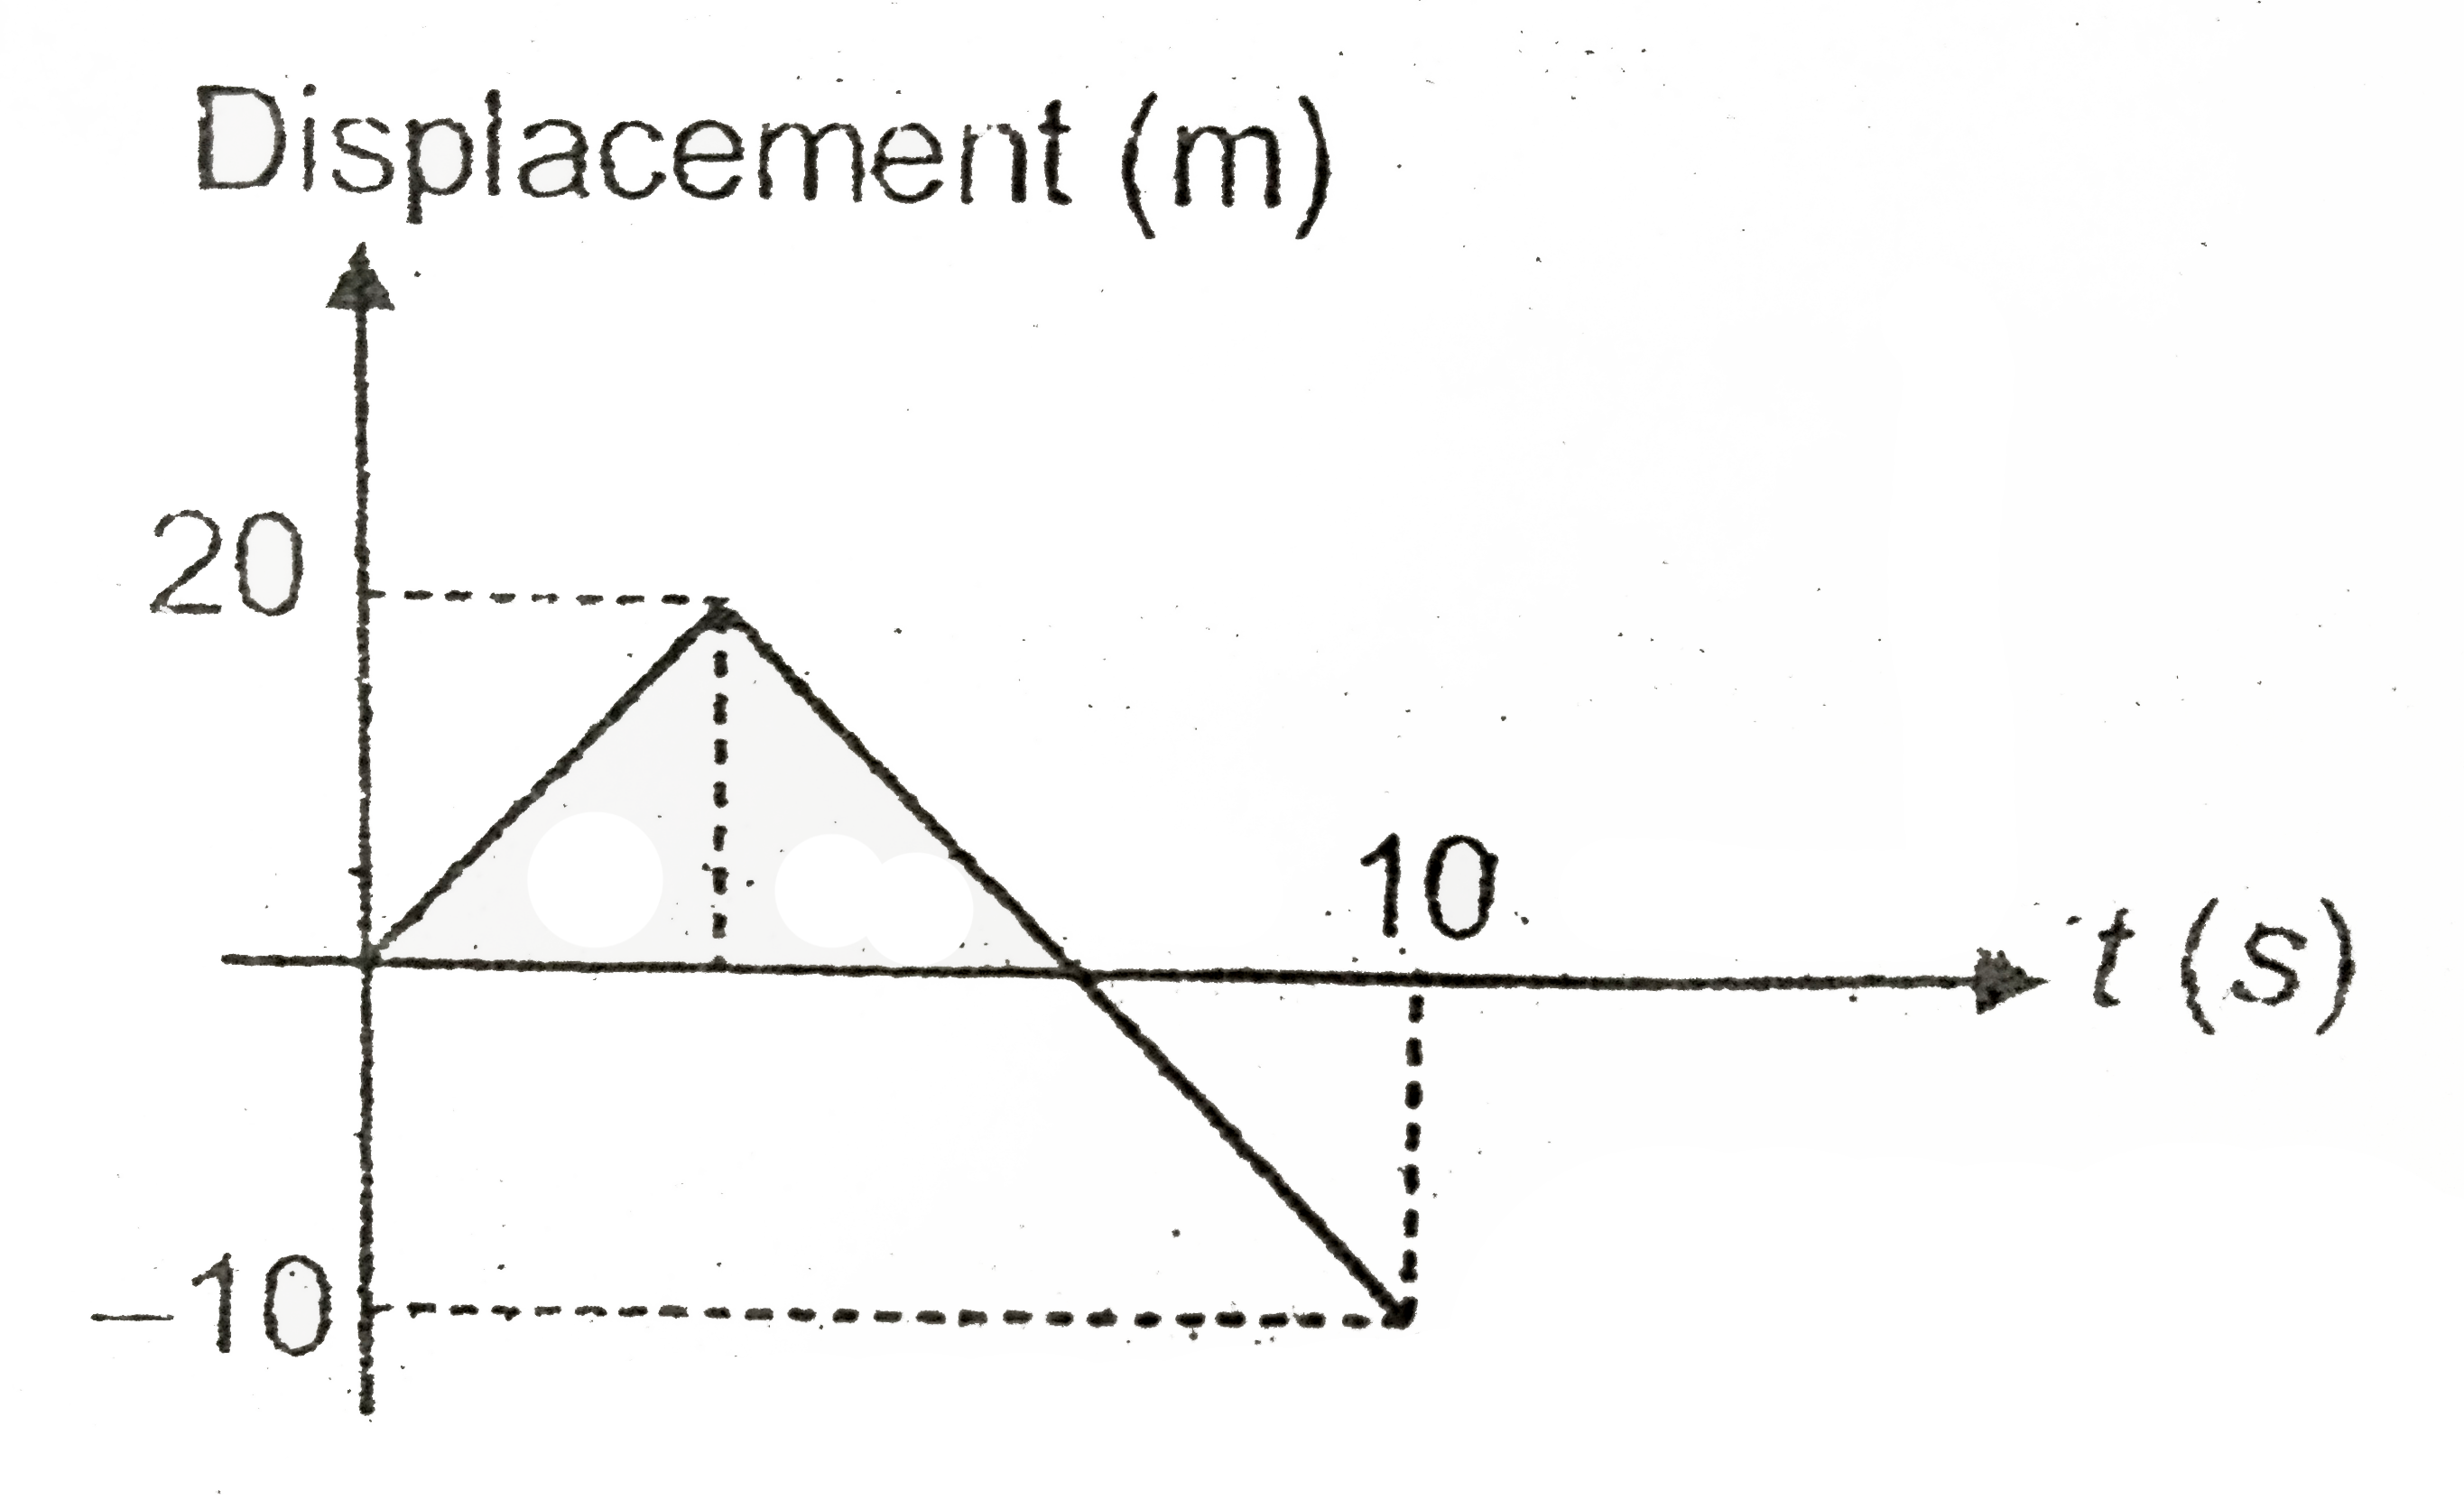
The correct Answer is:5
Step by step video & image solution for The diagram shows the displacement-time graph for the particle moving in a straight line. What is average speed (in m/s) for the interval 0-10 s? by Physics experts to help you in doubts & scoring excellent marks in Class 12 exams.
Updated on:21/07/2023Topper's Solved these Questions
- MOTION IN STRAIGHT LINEBOOK - AAKASH INSTITUTECHAPTER - MOTION IN STRAIGHT LINEEXERCISE - Assignment (SECTION - H)
9 Videos
- MOTION IN STRAIGHT LINEBOOK - AAKASH INSTITUTECHAPTER - MOTION IN STRAIGHT LINEEXERCISE - Assignment (SECTION - I)
3 Videos
- MOTION IN STRAIGHT LINEBOOK - AAKASH INSTITUTECHAPTER - MOTION IN STRAIGHT LINEEXERCISE - Assignment (SECTION - F)
1 Videos
- MOTION IN A STRAIGHT LINEBOOK - AAKASH INSTITUTECHAPTER - MOTION IN A STRAIGHT LINEEXERCISE - ASSIGNMENT (SECTION - D)
15 Videos
- MOVING CHARGE AND MAGNESIUMBOOK - AAKASH INSTITUTECHAPTER - MOVING CHARGE AND MAGNESIUMEXERCISE - SECTION D
16 Videos
Similar Questions
Knowledge Check
The diagram shows the displacement-time graph for a particle moving in a straight line. Find the average velocity for the interval from t=0 to t=5s.
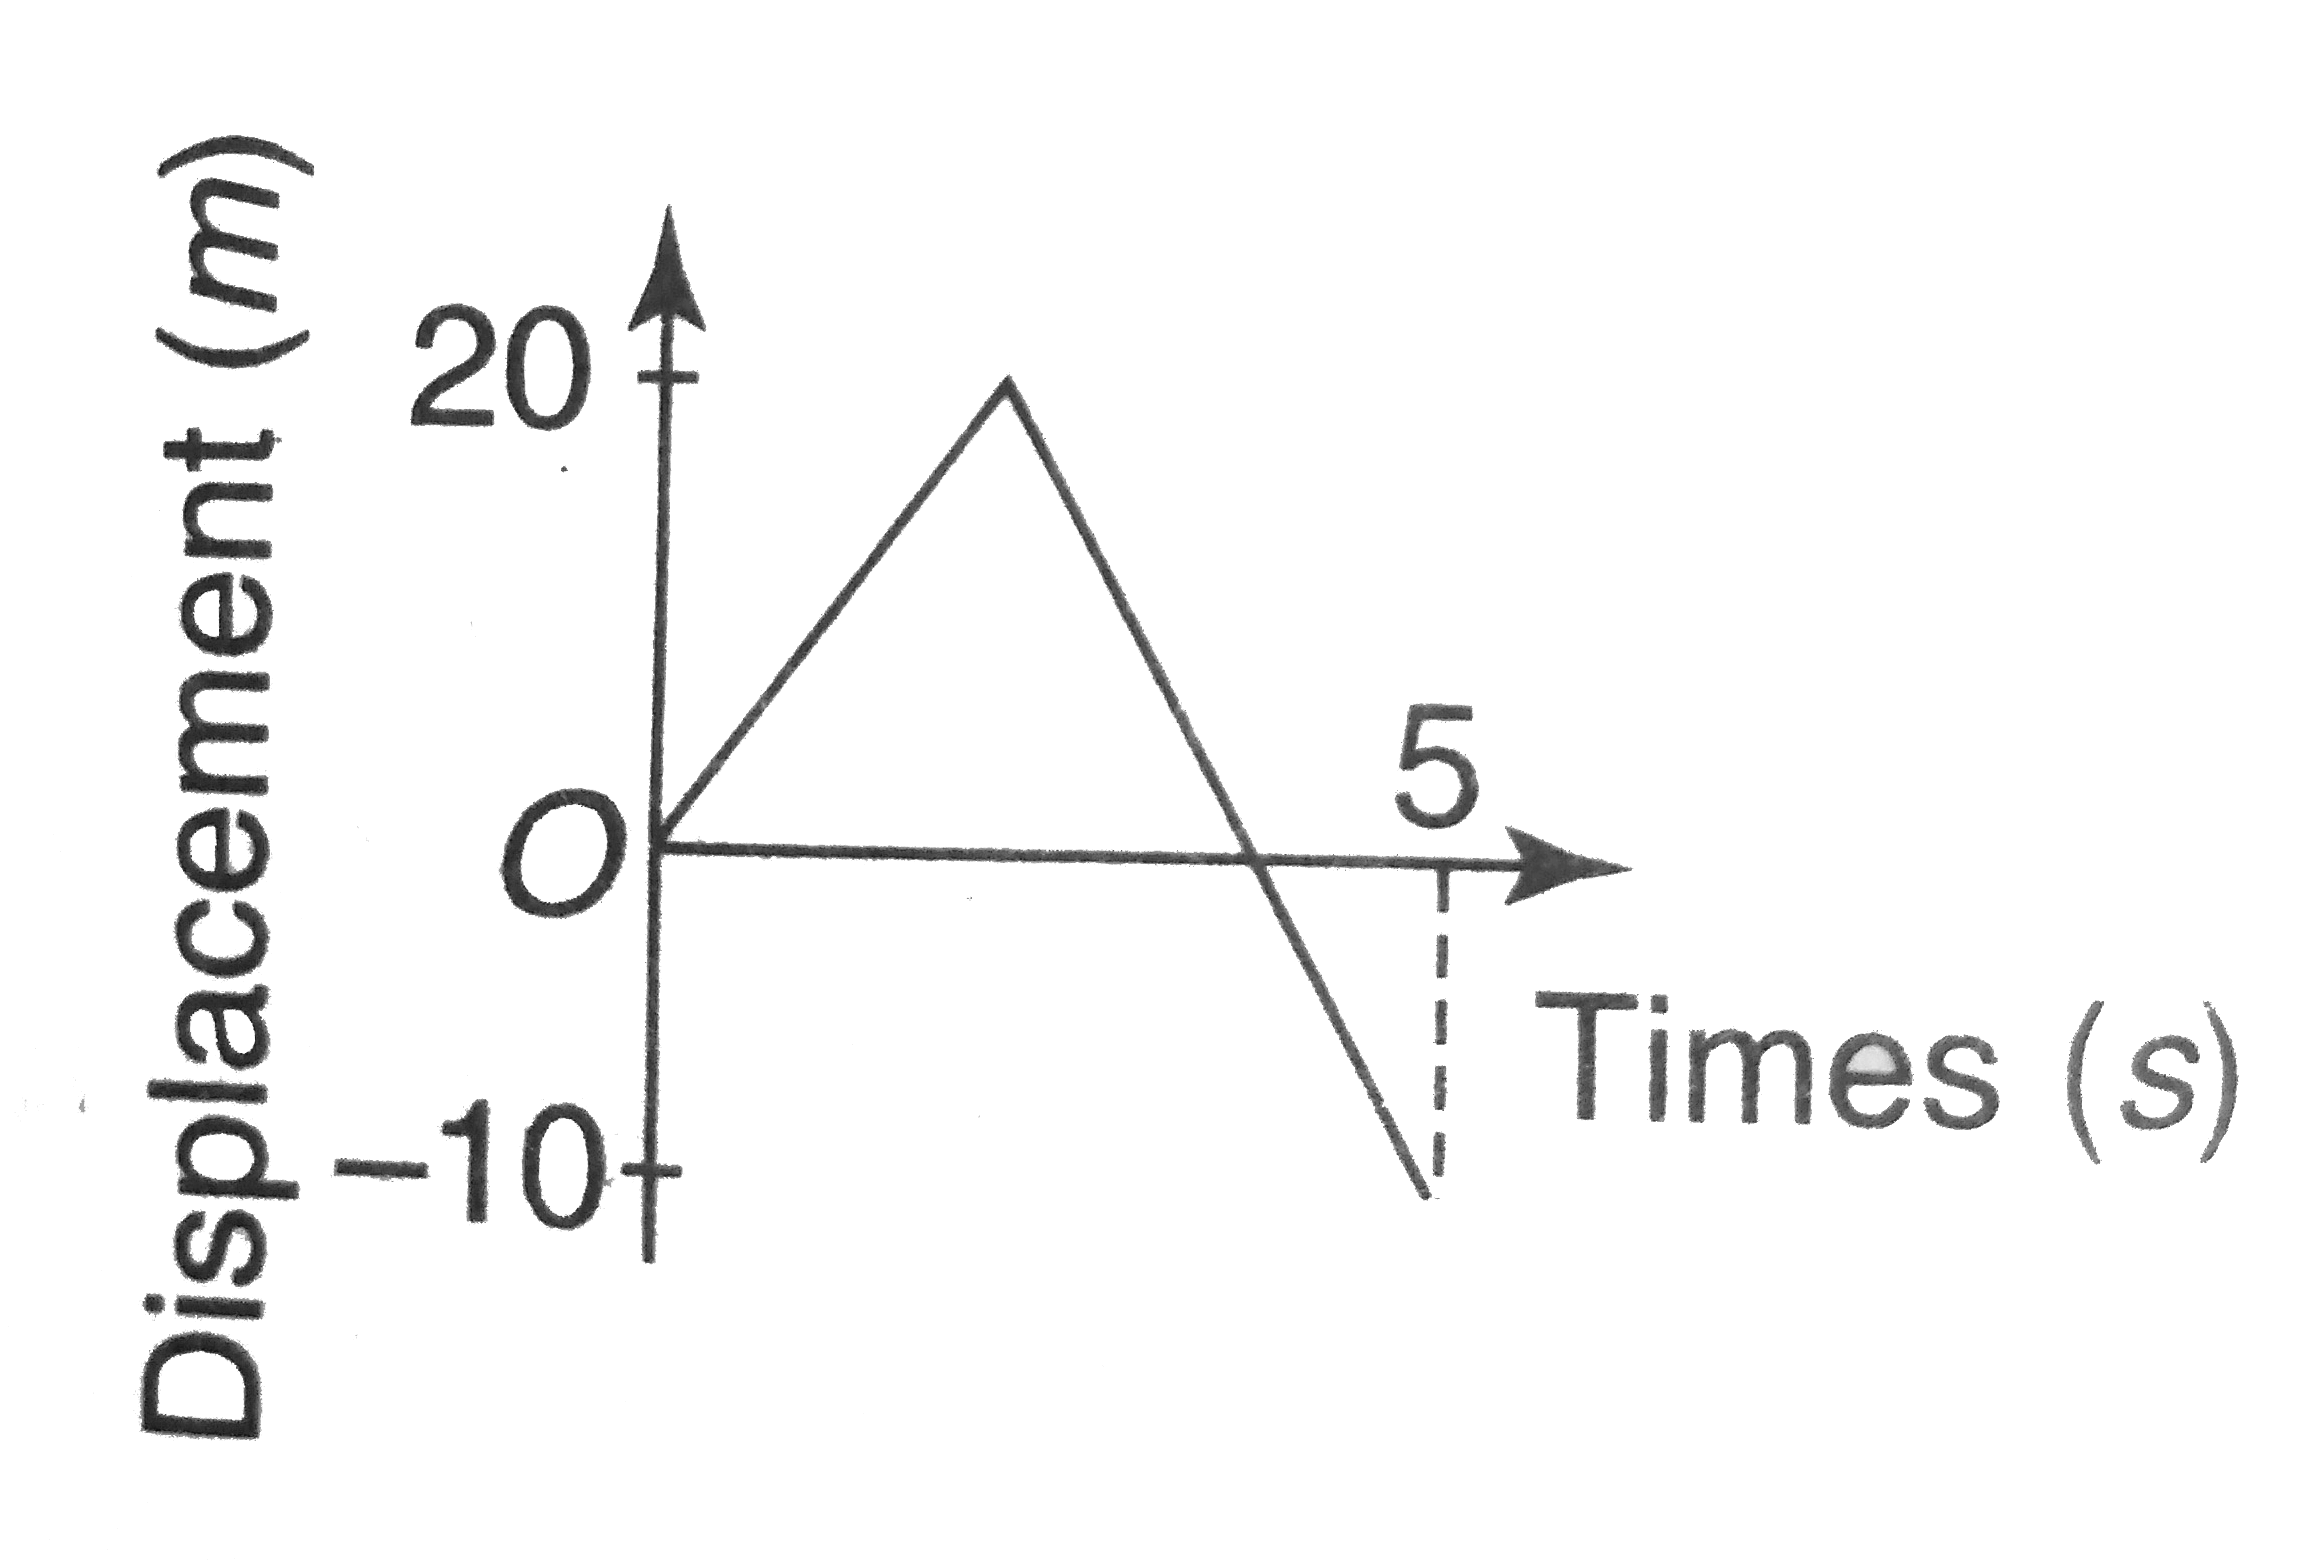 A−2ms−1B2ms−1C−4ms−1D4ms−1
The diagram shows the displacement-time graph for a particle moving in a straight line. Find the average velocity for the interval from t=0 to t=5s.
 A−2ms−1B2ms−1C−4ms−1D4ms−1
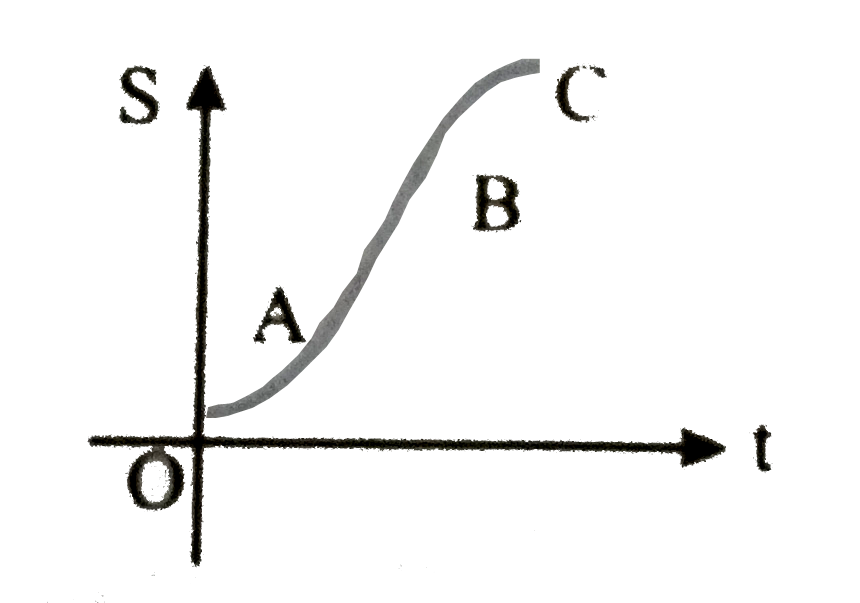
Displacement time graph of a particle moving in a straight line is a shown in figure.
 Ain region A acceleration is positiveBin region B acceleration is negativeCin region C acceleration is positiveDin region D acceleration is negative
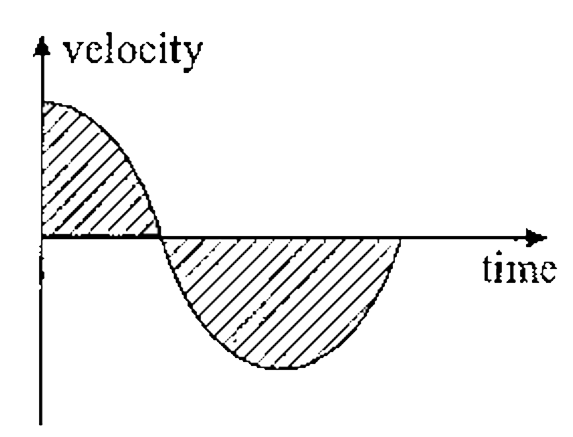
The diagram shows the velocity-time graph for a particle moving in a straight line. The sum of the two shaded areas represents :
View SolutionVelocity displacement graph of a particle moving in a straight line is as shown in figure.

View SolutionThe fig. shows the displacement time graph of a particle moving on a straight line path. What is the magnitude of average velocity of the particle over 10 seconds?
View SolutionDisplacement time graph of a particle moving in a straight line is as shown in figure. Select the correct alternative (s) :
 .
.
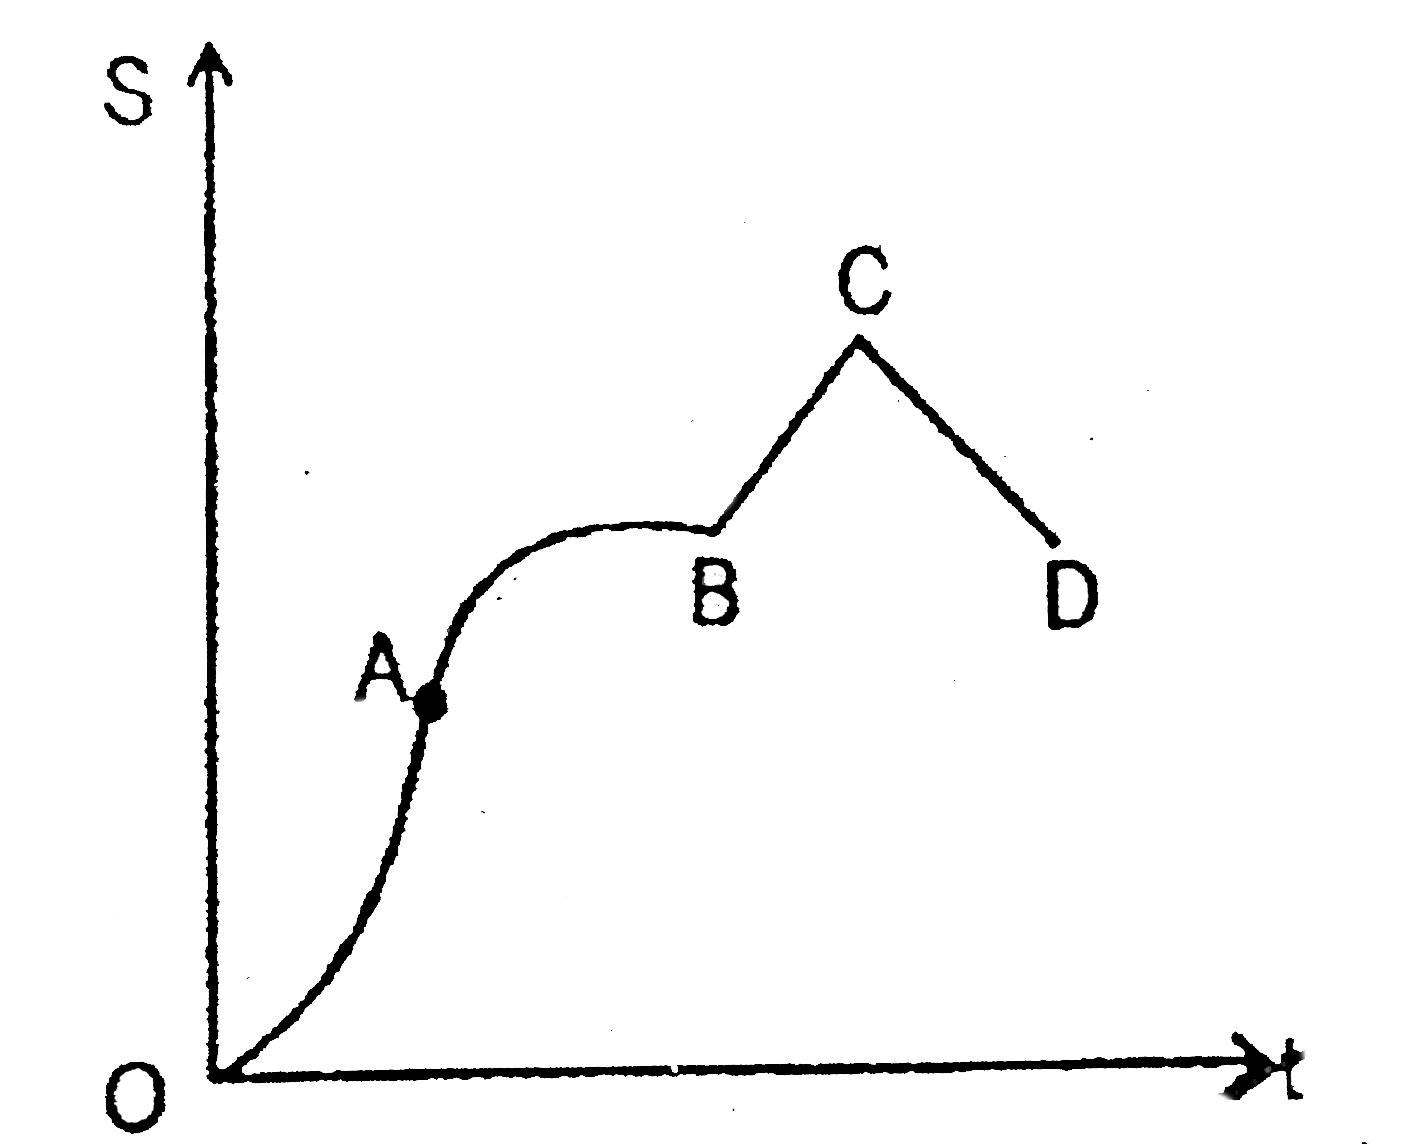
View SolutionDisplacment-time graph of a particle moving in a straight line is as shown in figure. Choose the INCORRECT statement(s)
View Solution

