The stopping potential V for photoelectric emission from a metal surface is plotted along Y - axis and frequency v of incident light along X - axis . A straight line is obtained as shown . Planck's constant is given by
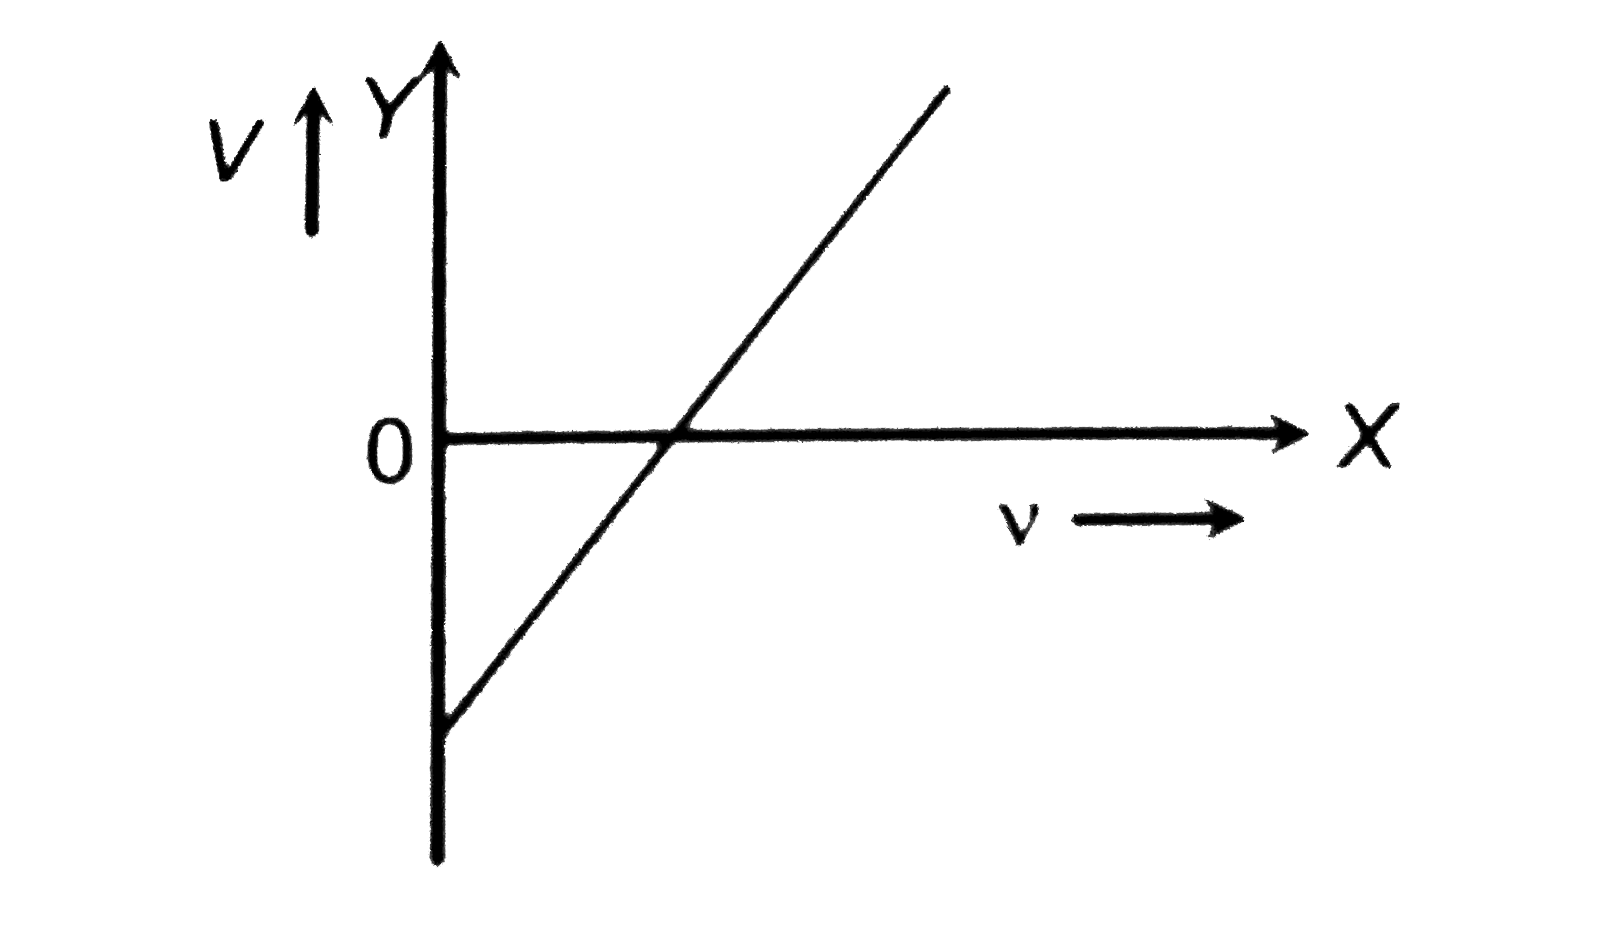
Slope of the line
Product of slope on the line and change on the electron
Product of intercept along Y-axis and mass of the electron
Product of slope and mass of electron
The correct Answer is:2
Step by step video & image solution for The stopping potential V for photoelectric emission from a metal surface is plotted along Y - axis and frequency v of incident light along X - axis . A straight line is obtained as shown . Planck's constant is given by by Physics experts to help you in doubts & scoring excellent marks in Class 12 exams.
Topper's Solved these Questions
- BOOK - AAKASH INSTITUTECHAPTER - DUAL NATURE OF RADIATION AND MATTER EXERCISE - ASSIGNMENT SECTION B.Objective (Only one answer)6videos
DUAL NATURE OF RADIATION AND MATTER
- BOOK - AAKASH INSTITUTECHAPTER - DUAL NATURE OF RADIATION AND MATTER EXERCISE - ASSIGNMENT SECTION C. Objective (More than one answer)4videos
DUAL NATURE OF RADIATION AND MATTER
- BOOK - AAKASH INSTITUTECHAPTER - DUAL NATURE OF RADIATION AND MATTER EXERCISE - Try Yourself41videos
DUAL NATURE OF RADIATION AND MATTER
- BOOK - AAKASH INSTITUTECHAPTER - CURRENT ELECTRICITYEXERCISE - ASSIGNMENT SECTION-J10videos
CURRENT ELECTRICITY
- BOOK - AAKASH INSTITUTECHAPTER - ELECTRIC CHARGES AND FIELDS EXERCISE - SECTION -J(Aakash Challengers Questions)5videos
ELECTRIC CHARGES AND FIELDS
Similar Questions
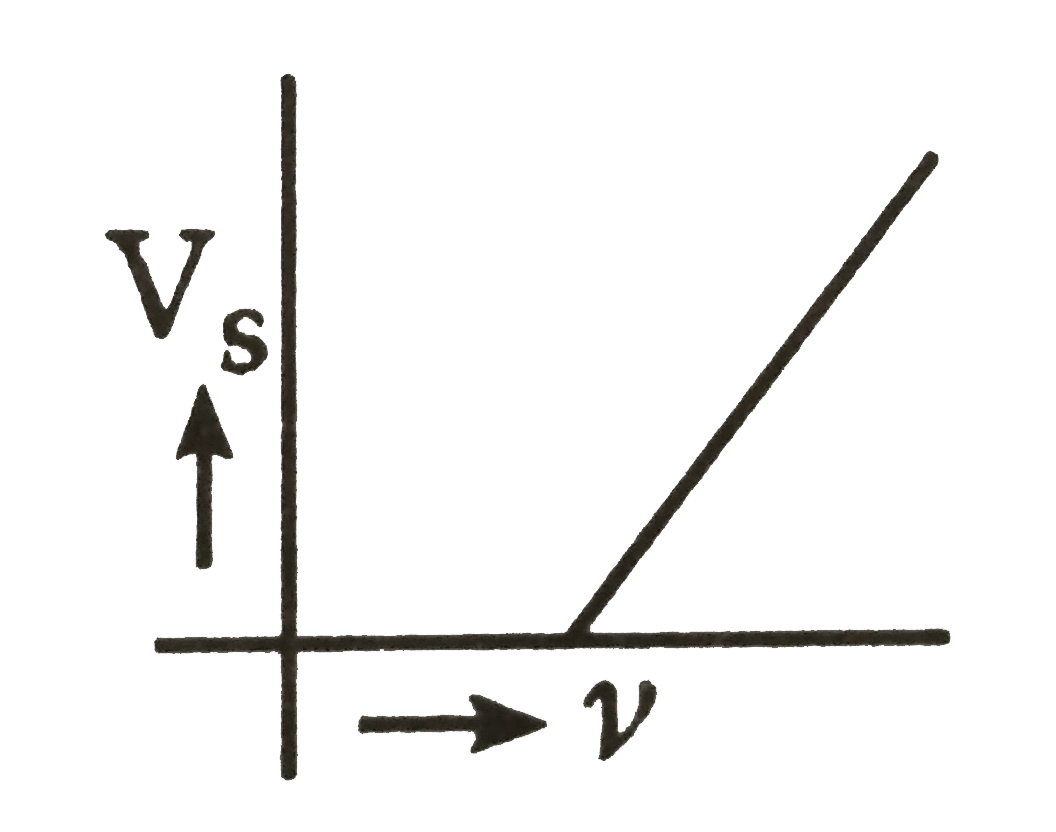
In photoelectric effect the slope of straight line graph between stopping potential (Vs) and frequency of incident light (v) gives
 View Solution
Figure shows the stopping potential (V0) for the photo electron vers (1λ) graph, for two metals A and B, λ being the wavelength of incident light.
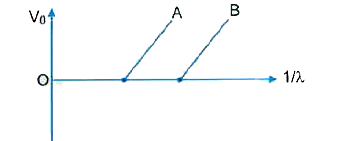
How is the value of Planck's constant determined from the graph ?View Solution
Knowledge Check
- Question 1 - Select One
A graph is plotted taking ∘––C along the Y - axis and of along the X - axis .It is a /an
AparabolaBstraight lineCellipseDcircle - Question 2 - Select One
For a zero order reaction a plot of rate (along Y-axis) and concentration (along X-axis) is
Aa rectangular parabolaBa line with −ve slope and zero Y - interceptCa line with +ve slope and a non - zero Y- interceptDa line with zero slope and a positive Y-intercept - Question 3 - Select One
In a photoelectric experiment, the graph of frequency v of incident light (in Hz) and stopping potential V (in V) is as shown in the figure. Planck's constant is (e is the elementary charge)
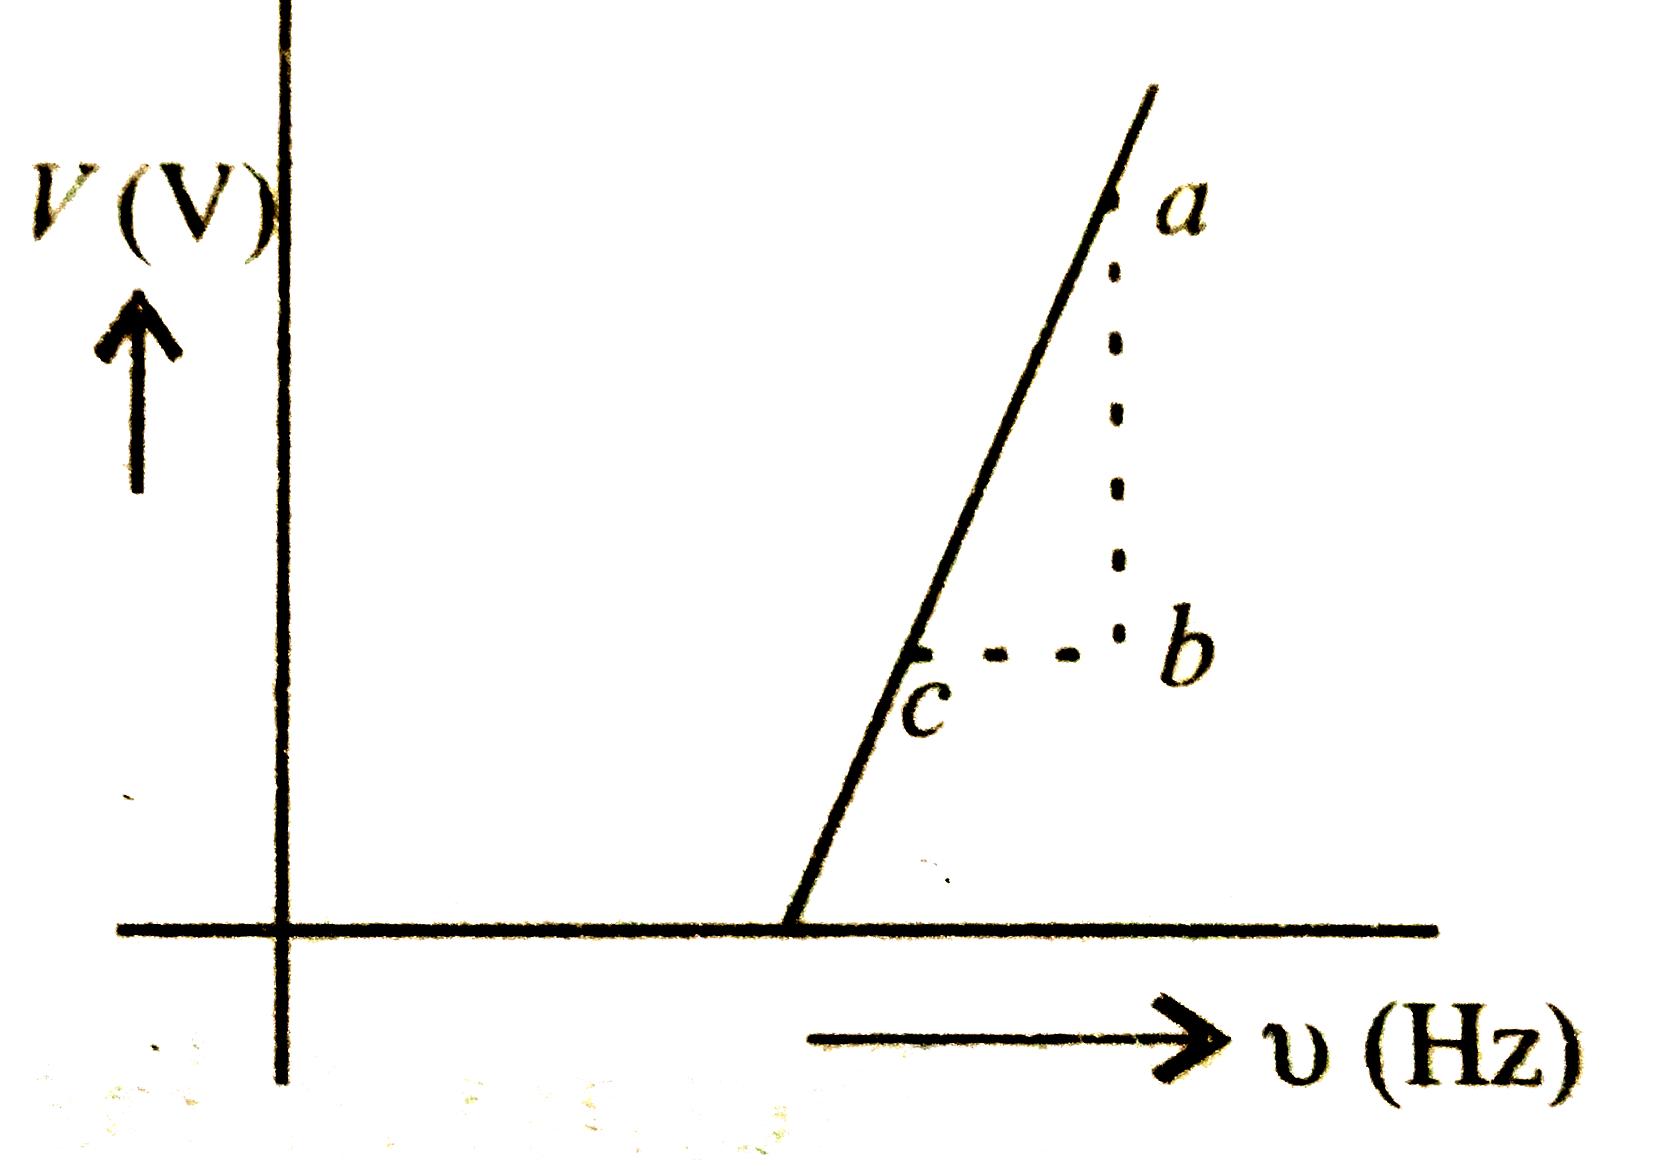 AeabbcBecbacCeacbcDeacab
The stopping potential for photoelectrons from a metal surface is V1 when monochromatic light of frequency υ1 is incident on it. The stopping potential becomes V2 when monochromatic light of another frequency is incident on the same metal surface. If h be the Planck’s constant and e be the charge of an electron, then the frequency of light in the second case is:
View SolutionIn a photoelectric experiment , the stopping potential Vs is plotted against the frequency v of the incident light . The resulting curve is a straight line which makes an angle θ with the v - axis. Then tanθ will be equal to (Here E0 = work function of the surface_
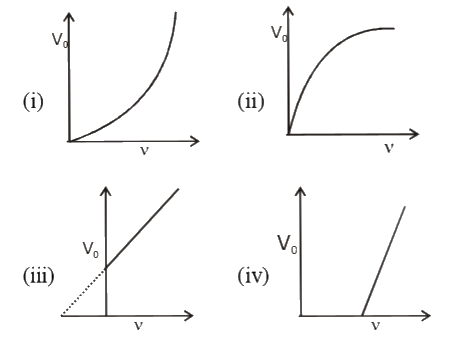
View SolutionFor a photoelectric cell, the graph shown the variation of cut off voltage (V0) with frequency (v) of incident light is
 View Solution
In a photoelectric experiment , the stopping potential Vs is plotted against the frequency v of the incident light . The resulting curve is a straight line which makes an angle θ with the v - axis. Then tanθ will be equal to (Here E0 = work function of the surface_
View SolutionIn photoelectric effect the slope of stop of stopping potential versus frequency of incident light for a given surface will be
View Solution

