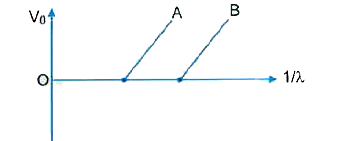
Figure shows the stopping potential (V0) for the photo electron vers (1λ) graph, for two metals A and B, λ being the wavelength of incident light.

How is the value of Planck's constant determined from the graph ?
We know that V0=he(v−v0)=hce(1λ−1λ0).
So V0−1λ graph is a straight line graph whose slope has a magnitude of hce .
Thus, Planck.s constant h=ec×(Slope of V0−1λ aph for any photosensitive metal)
Topper's Solved these Questions
- CBSE EXAMINATION PAPER 2020 (SOLVED)BOOK - U-LIKE SERIESCHAPTER - CBSE EXAMINATION PAPER 2020 (SOLVED)EXERCISE - SECTION C
11 Videos
- CBSE EXAMINATION PAPER 2020 (SOLVED)BOOK - U-LIKE SERIESCHAPTER - CBSE EXAMINATION PAPER 2020 (SOLVED)EXERCISE - SECTION D
11 Videos
- CBSE EXAMINATION PAPER 2020 (SOLVED)BOOK - U-LIKE SERIESCHAPTER - CBSE EXAMINATION PAPER 2020 (SOLVED)EXERCISE - SECTION D
11 Videos
- CBSE EXAMINATION PAPER 2020 BOOK - U-LIKE SERIESCHAPTER - CBSE EXAMINATION PAPER 2020 EXERCISE - SECTION D
12 Videos
- CBSE EXAMINATION PAPER 2020 (SOLVED) BOOK - U-LIKE SERIESCHAPTER - CBSE EXAMINATION PAPER 2020 (SOLVED) EXERCISE - SECTION - D
6 Videos
Similar Questions
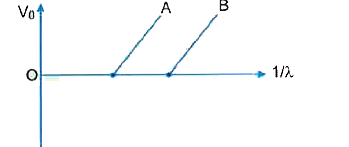
Figure shows the stopping potential (V0) for the photo electron vers (1λ) graph, for two metals A and B, λ being the wavelength of incident light.

If the distance between the light source and the surface of metal A is increased, how will the stopping potential for the electrons emitted from it be affected ? Justify your answer.
View SolutionDraw a graph showing the variation of stopping potential with frequency of the incident on a metal plate. How can the value of Planck's constant be determined from this graph?
View Solution
Knowledge Check
The stopping potential are V1 and V2. Calculate the (V1−V2), if the λ1 and λ2 are wavelength of incident lights, respectively.
Ahce(1λ1−1λ2)Bhce(1λ1+1λ1)Cehc(1λ1+1λ2)Dehc(1λ1−1λ2)If λ0 is the threshold wavelnegth of a metal and λ is the wavelength of the incident radiation, the maximum velocity of the ejected electron from the metal would be
A[2hcm(λ0−λλ0λ)]1/2B[2hcm(λ−λ0λλ0)]1/2C[2hcm(λ−λ0)]1/2D[2hcm(λ0−λ)]1/2In photo electric effect, the slope of the straight line graph between stopping potential and frequency of the incident light gives the ratio of Planck's constant to
Acharge of electronBwork functionCphoto electric currentDK.E. of electron
If λ0 is the threshold wavelnegth of a metal and λ is the wavelength of the incident radiation, the maximum velocity of the ejected electron from the metal would be
View SolutionPlot a labelled graph of maximum kinetic energy of photo electrons versus frequency of incident radiation. State how you will obtain the value of Planck.s constant h from the graph.
View SolutionIn a photoelectric experiment, it was found that the stopping potential decreases from 1.85 V to 0.82 V as the wavelength of the incident light is varied from 300nm to 400nm. Calculate the value of the Planck constant from these data.
View SolutionGraph of stopping potential for most energetic emitted photoelectron (VS) with frequency of incident radiation on metal is given below.

The value of ABBC, in graph is
(h=Planck's constant, e = electronic charge)
View SolutionIn a photoelectric experiment it was found that the stopping potential decreases from 1.85 V to 0.82 V as the wavelength of the incident light is varied from 300 nm to 400 nm. Calculate the value of the Planck constant from these data.
View Solution
