Choose the diagram which correctly depicts anaphase I
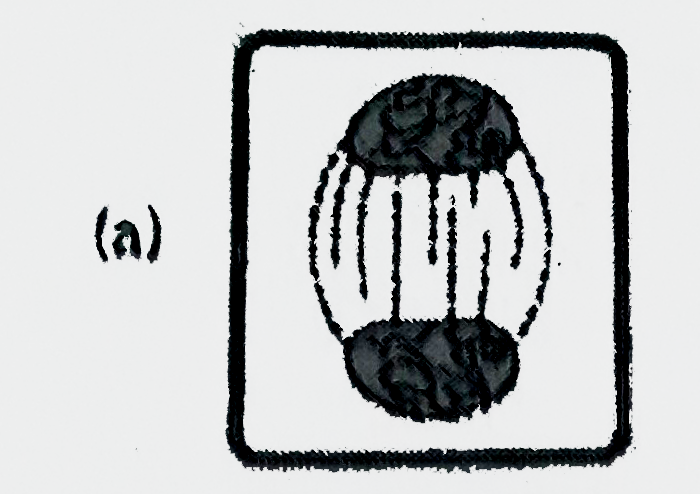
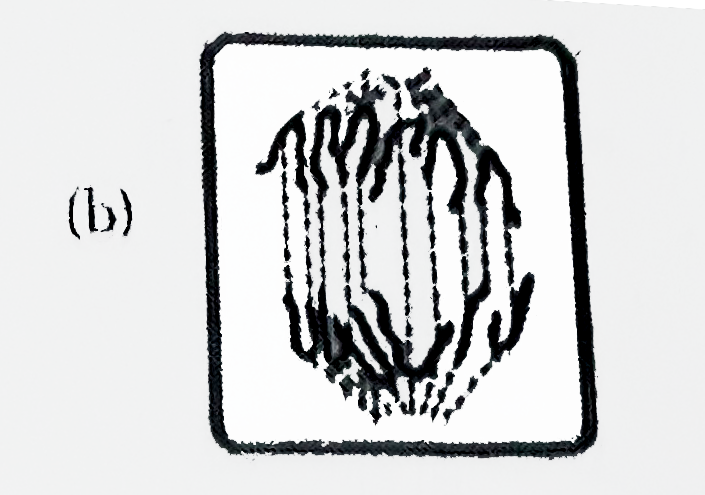
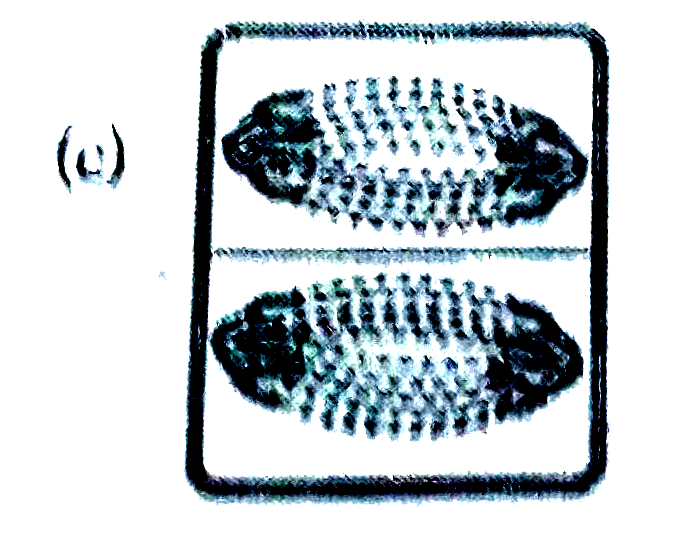
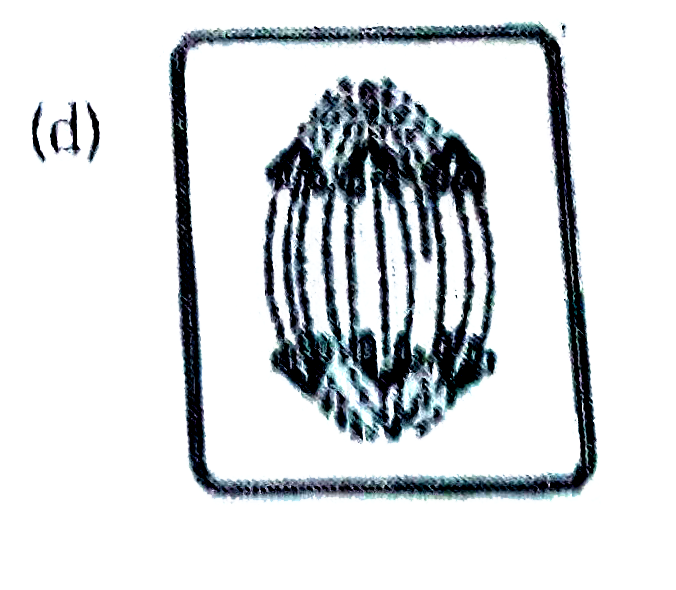
The correct Answer is:D
Step by step video, text & image solution for Choose the diagram which correctly depicts anaphase I by Biology experts to help you in doubts & scoring excellent marks in Class 12 exams.
Topper's Solved these Questions
- BOOK - ARIHANT NEETCHAPTER - CELL CYCLE AND CELL DIVISIONEXERCISE - Chapter Exercises (A) Taking it together (Assorted Questions of the Chapter of Advanced Level Practice)1videos
CELL CYCLE AND CELL DIVISION
- BOOK - ARIHANT NEETCHAPTER - CELL CYCLE AND CELL DIVISIONEXERCISE - Chapter Exercises (B) Medical entrances special formate questions (Statement Based questions)6videos
CELL CYCLE AND CELL DIVISION
- BOOK - ARIHANT NEETCHAPTER - CELL CYCLE AND CELL DIVISIONEXERCISE - Check Point 16.215videos
CELL CYCLE AND CELL DIVISION
- BOOK - ARIHANT NEETCHAPTER - BREATHING AND EXCHANGE OF GASES EXERCISE - Chapter exercise C (Medical entrances gallery )54videos
BREATHING AND EXCHANGE OF GASES
- BOOK - ARIHANT NEETCHAPTER - CELL: THE UNIT OF LIFEEXERCISE - Chapter Exercises C Medical Entranes Gallery (Collection of questions Asked in NEET & Various Medical Entrance Exams )118videos
CELL: THE UNIT OF LIFE
Similar Questions
Knowledge Check
- Question 1 - Select One
Choose the word which is spelt correctly.
ACommitedBCommittedCComitteedDCommitteed - Question 2 - Select One
In Anaphase-I
Achromosomes move to respective polesBchromatids move to respective polesCcentriole movesDspindle fibres move - Question 3 - Select One
which of the following diagram correctly depicts the situation of Unitary Elastic Supply ?
A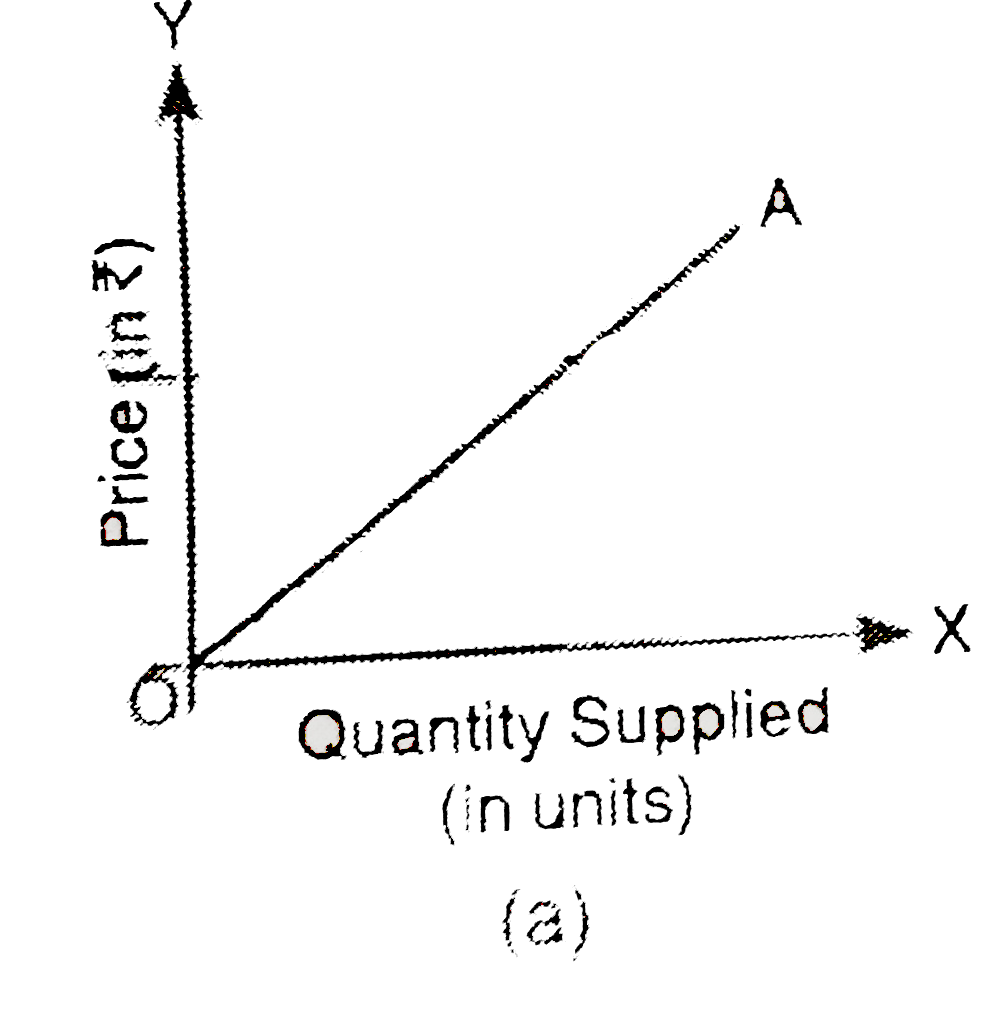 B
B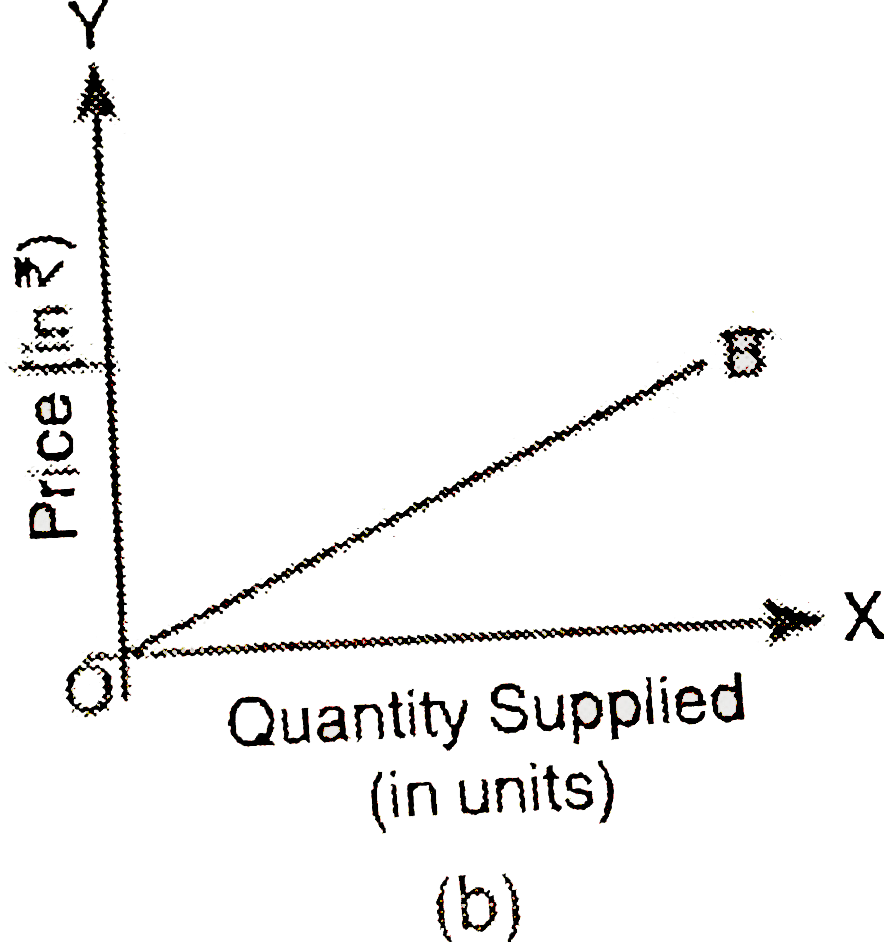 C
C DAll of these
Which of the following diagram correctly depicts the relationship between TC,TFC and TVC ?
View SolutionWhich of the following diagram correctly depicts the relation between AR and MR when price falls with rise in output ?
View SolutionWhich diagram correctly depicts total variable cost curve :
View SolutionSelect the option which correctly represents the stage anaphase - I for chromosome number 2n = 4.
View SolutionWhich of the following graphs correctly depicts the rate of photosynthesis of sun plant (P) and shade plant (Q)?
View Solution

