The graph representing absorption of light at different wavelength is called
absorption spectrum
action spectrum
Both (a) and (b)
None of these
The correct Answer is:A
Step by step video, text & image solution for The graph representing absorption of light at different wavelength is called by Biology experts to help you in doubts & scoring excellent marks in Class 12 exams.
Topper's Solved these Questions
- BOOK - ARIHANT NEETCHAPTER - PHOTOSYNTHESIS IN HIGHERF PLANTS EXERCISE - Chapter Exercies (B Medical entrances special format questions) (Statement based quations)10videos
PHOTOSYNTHESIS IN HIGHERF PLANTS
- BOOK - ARIHANT NEETCHAPTER - PHOTOSYNTHESIS IN HIGHERF PLANTS EXERCISE - Chapter Exercies (B Medical entrances special format questions) Assertion and reason7videos
PHOTOSYNTHESIS IN HIGHERF PLANTS
- BOOK - ARIHANT NEETCHAPTER - PHOTOSYNTHESIS IN HIGHERF PLANTS EXERCISE - Check Point 20.315videos
PHOTOSYNTHESIS IN HIGHERF PLANTS
- BOOK - ARIHANT NEETCHAPTER - PHOTOSYNTHESIS IN HIGHER PLANTS EXERCISE - Check Point 20.11videos
PHOTOSYNTHESIS IN HIGHER PLANTS
- BOOK - ARIHANT NEETCHAPTER - PLANT BREEDING AND TISSUE CULTURE EXERCISE - Medical entrances gallery (Collection of questions Asked in NEET and Various Medical Entrance Exams)44videos
PLANT BREEDING AND TISSUE CULTURE
Similar Questions
A pigment appears yellow-orange in the chromatogram and found in leaves of higher plants, helps
(a) In absorption of light of different wavelength
(b) To prevent oxidative destruction of chlorophyll pigment by light.
(c) By absorbing wavelengths beyond visible spectrum which increases the efficiency of photosynthesis.View SolutionThe graph showing rate of photosynthesis at different wavelength of light is called
View Solution
Knowledge Check
- Question 1 - Select One
This graph represents:
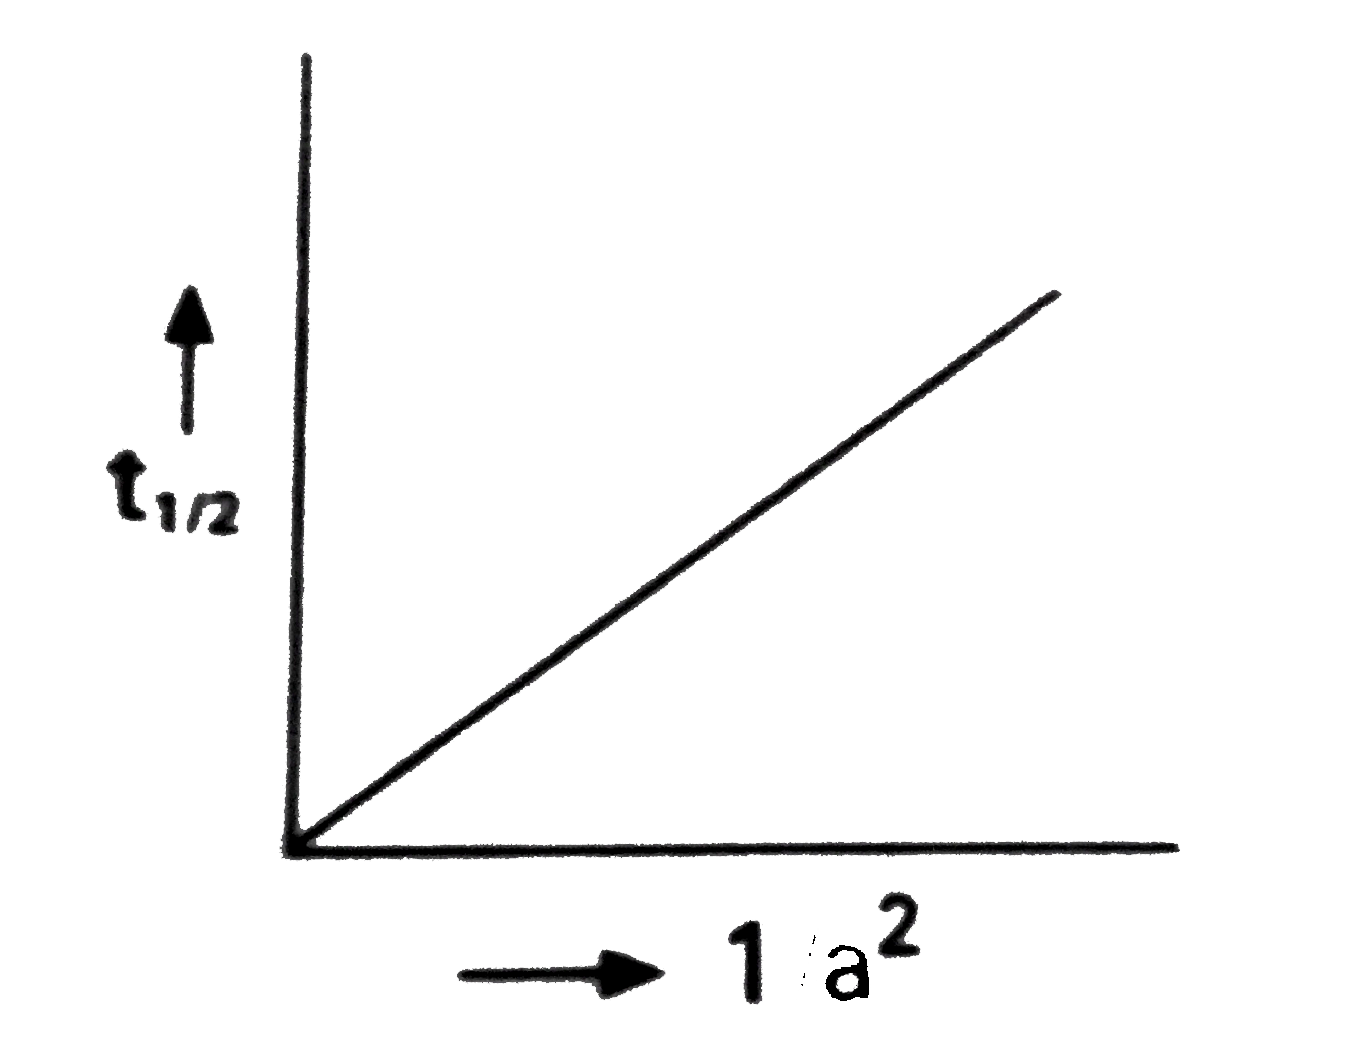 Afirst order reactionBzero order reactionCsecond order reactionDthird order reaction
 - Question 2 - Select One
In absorption spectrum of Na the missing wavelength (s) are
A589 nmB589.6 nmCBothDNone of these - Question 3 - Select One
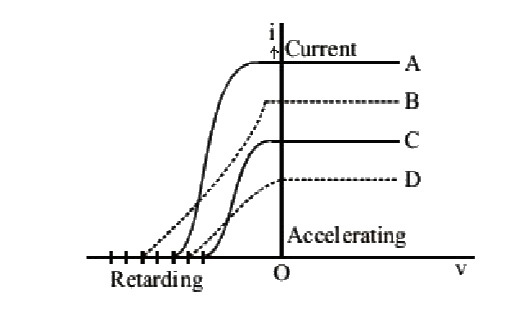
Figure shows a results of an experiment inolving photoelectric effect. The graph A,B,C,D are related to light beams having differents wavelength. Choose incorrect option:
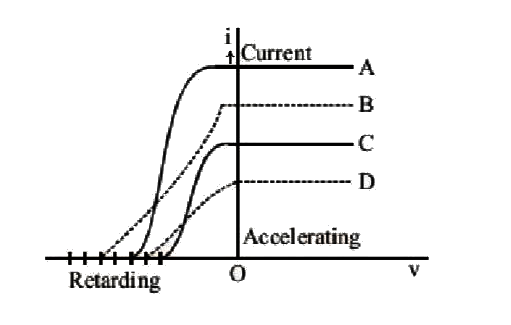 ABeam B has highest frequencyBPhotoelectrons ejected by beam B have momentum greater than C and less than ACBeam A has the highest rate of photoelectric emissionDBeam C has longest wavelength
Thefigure shows the results of an experiment involving photoelectric effect. The graphs A, B,C and D relate to a light beam having different wavelengths. Select the correct alternative.
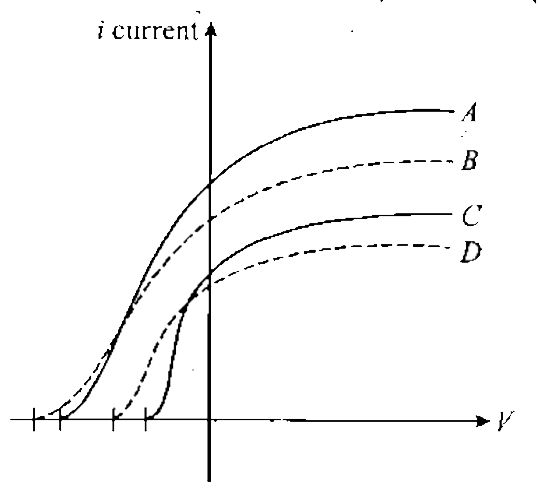 View Solution
In a photoelectric experiment light of different wavelengths are used on a metal surface. For each wavelength the stopping potential difference is recorded. The given graph shows the variation of stopping potential difference (Vs) versus the wavelength (l) of light used. Find the value of V0 shown in the graph. Given h=4×10–15eVs and c=3×10⁸ms–1.
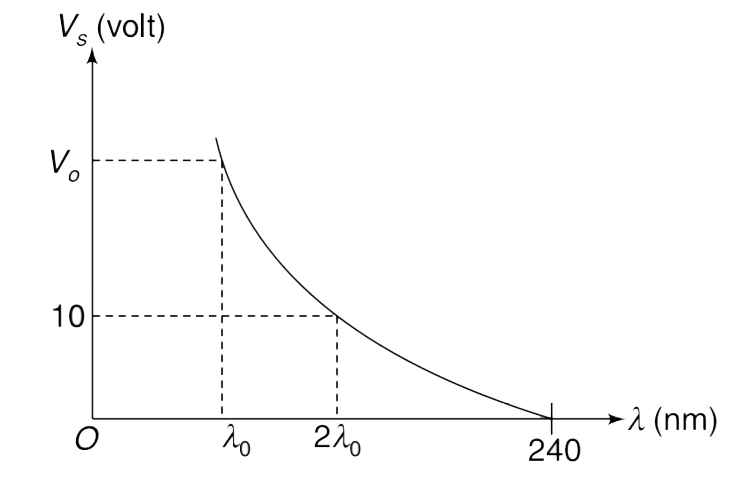 View Solution
A wave of light of ____ wavelength is called monochromatic light.
View SolutionFigure shows the results of an experiment involving photoelectric effect. The graphs A, B, C, D are related to the light beams having different wavelength. Choose incorrect option :-
 View Solution
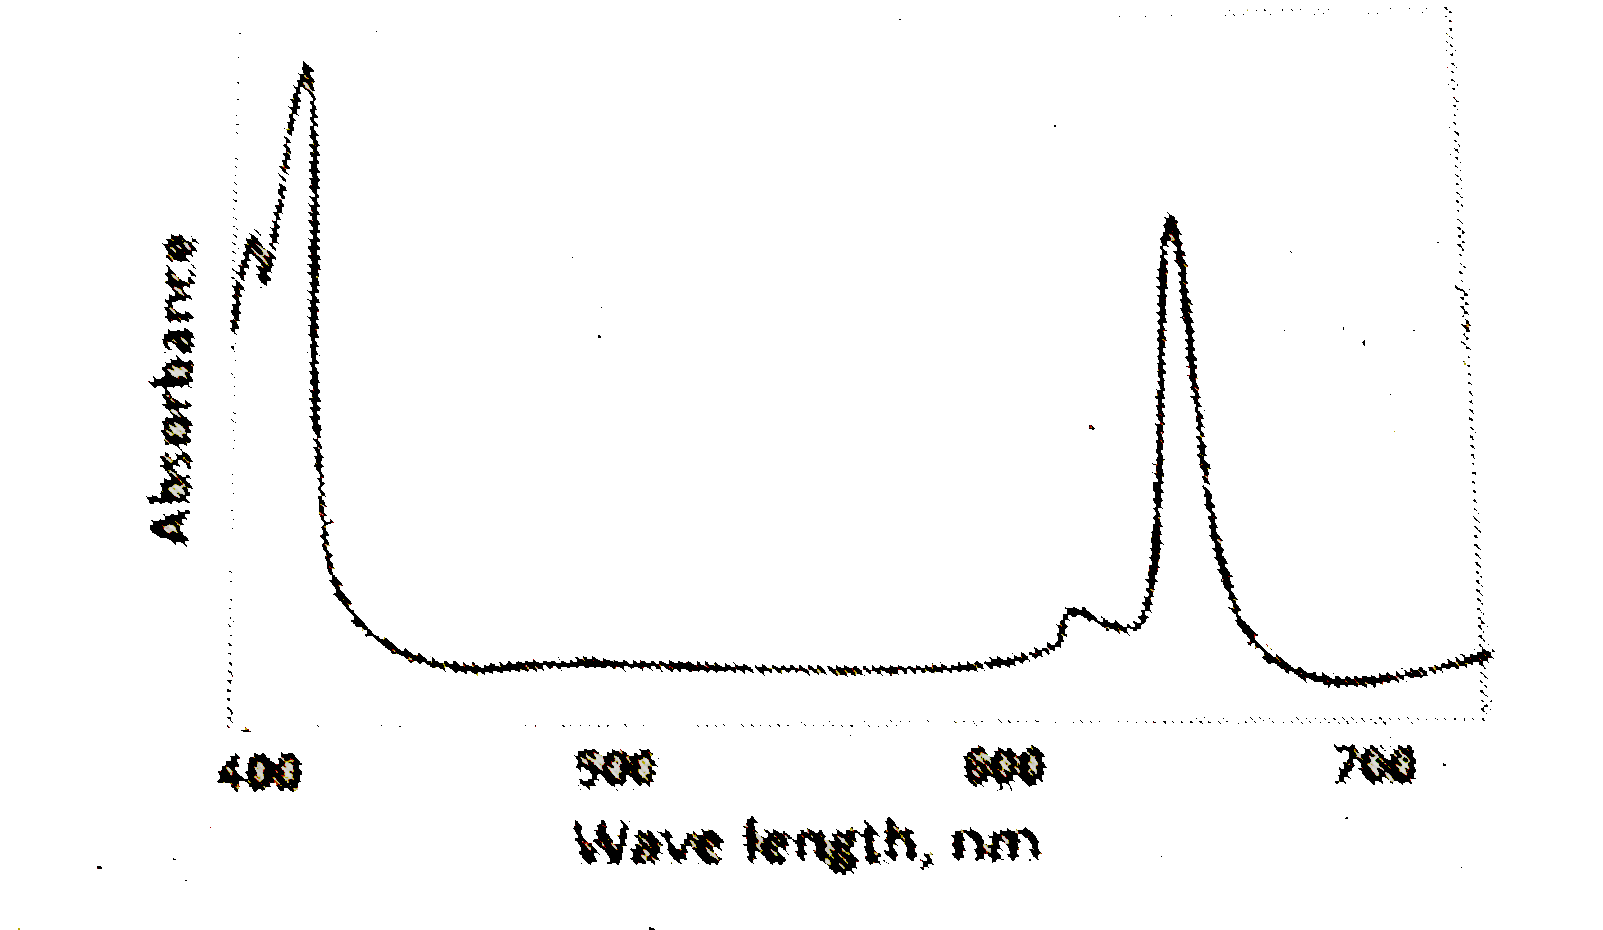
The graph below represents the absorption spectrum of major pigment contributing to photosynthesis ?
 View Solution

