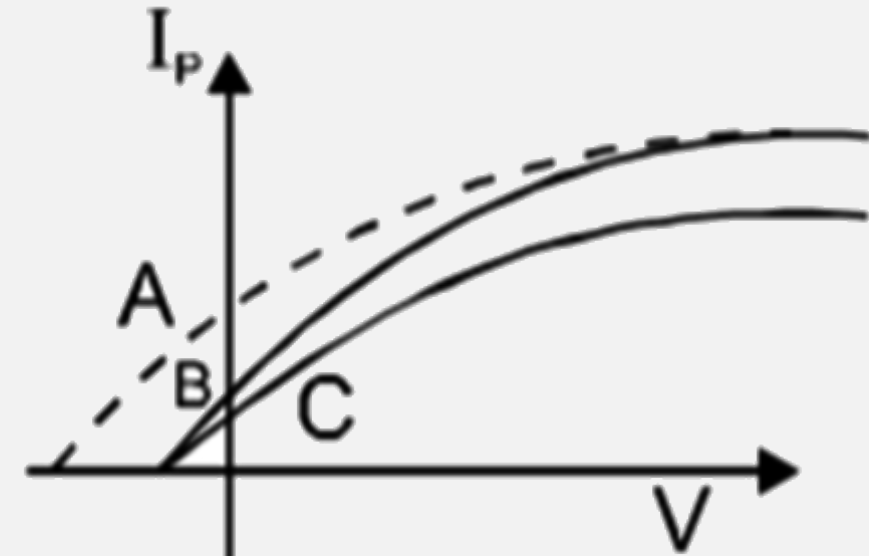
Figure shows the results of an experiment involving photoelectric effect. The graphs A, B, C, D are related to the light beams having different wavelength. Choose incorrect option :-
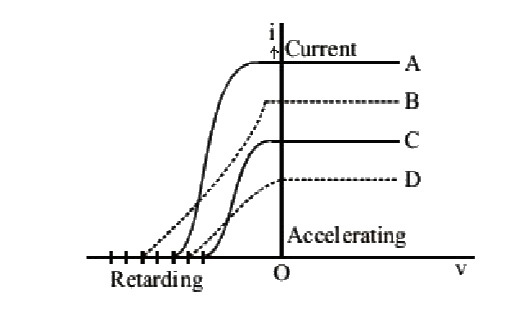
Beam B has highest frequency
Photoelectrons ejected by beam B have momentum greater than C and less then A
Beam A has the highest rate of photoelectric emission
Beam C has longest wavelength
The correct Answer is:B
We can compare only maximum kinetic energy or maximum momentum.
Topper's Solved these Questions
Similar Questions
The figure shows the results of an experiment involving photoelectric effect. The graphs A, B,C and D relate to a light beam having different wavelengths. Select the correct alternative.
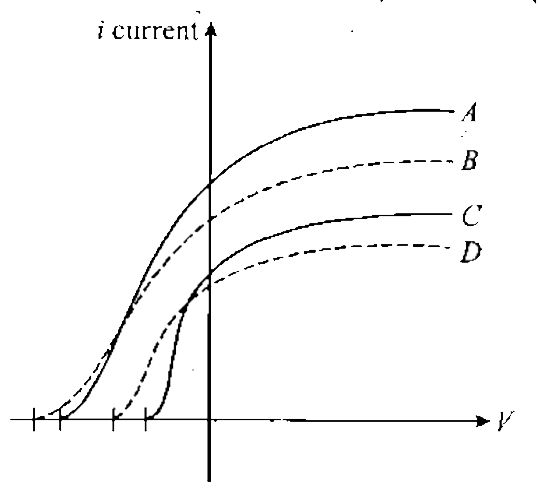
View SolutionThefigure shows the results of an experiment involving photoelectric effect. The graphs A, B,C and D relate to a light beam having different wavelengths. Select the correct alternative.

View Solution
Knowledge Check
Figure shows a results of an experiment inolving photoelectric effect. The graph A,B,C,D are related to light beams having differents wavelength. Choose incorrect option:
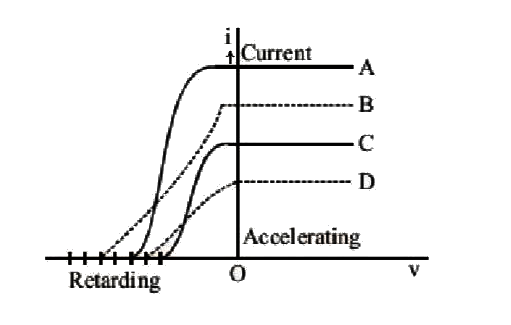 ABeam B has highest frequencyBPhotoelectrons ejected by beam B have momentum greater than C and less than ACBeam A has the highest rate of photoelectric emissionDBeam C has longest wavelength
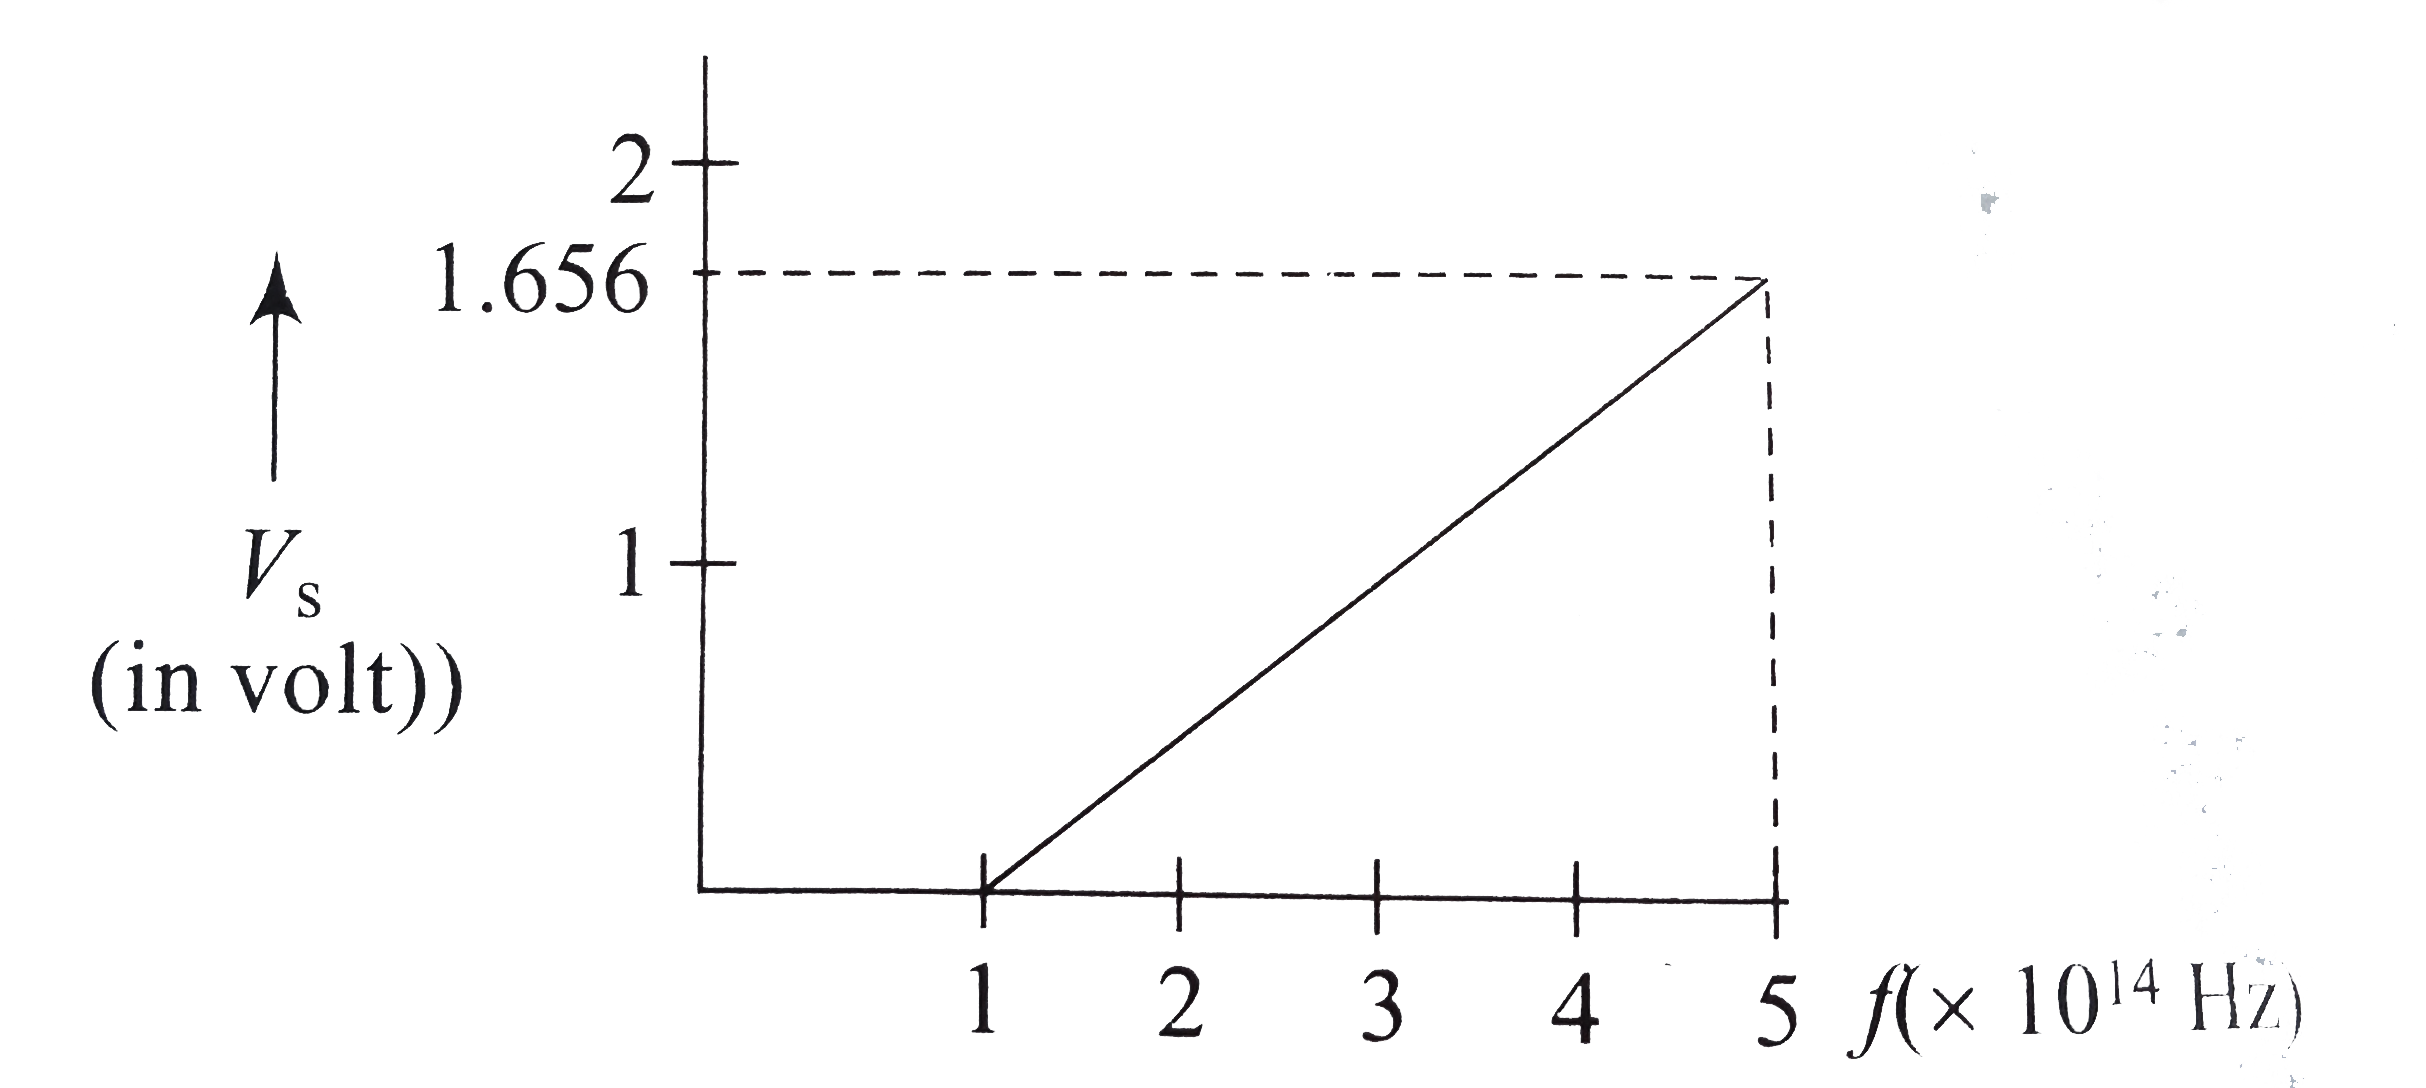
Figure shows the plot of the stopping potential versus the frequency of the light used in an experiment on photoelectric effect. The ratio he isA10−15Vs−15VsB2×10−15VsC3×10−15VsD4.14×10−15Vs
In an experiment on photoelectric effect, the stopping potential is measured for monochromatic light beams corresponding to different wavelength. The data collected are as follows:
wavelength (nm): 350 400 450 500 550
stopping potential (V): 1.45 1.00 0.66 0.38 0.16
Plot the stopping potential against inverse of wavelength on a graph paper and find (a) the Planck constant, (b) the work function of the emitter and (c) the threshold wavelength .
View SolutionIn an experiment on photoelectric effect, the stopping potential is measured for monochromatic light beams corresponding to different wavelength. The data collected are as follows:
wavelength (nm): 350 400 450 500 550
stopping potential (V): 1.45 1.00 0.66 0.38 0.16
Plot the stopping potential against inverse of wavelength on a graph paper and find (a) the Planck constant, (b) the work function of the emitter and (c) the threshold wavelength .
View SolutionPlot a graph showing the variation of photoelectric current with anode potential for two light beam of same wavelength but different intensity.
View SolutionThe graph shows the variation of photocurrent with the applied voltage in a photoelectric effect experiment for three different beams of light falling on identical metal surfaces, then which among the following is correct ?
View SolutionThe graph shows the variation of photocurrent with the applied voltage in a photoelectric effect experiment for three different beams of light falling on identical metal surfaces, then which among the following is correct ?

View SolutionWhich of the following quantities related to a lens depend on the wavelength or wavelengths of the incident light?
(Choose the incorrect option)
View Solution
