The diagram given here is the standard ECG of a normal person. The P-wave represents the

A
initiation of the ventricular contraction
B
beginning of the systole
C
end of systole
D
contraction of both the atria
Text Solution
The correct Answer is:D
In ECG, P-wave represents the depolarisation of atria, which leads to the contraction of both atria. T -wave represents the return of ventricles from excited to normal state. The QRS complex represents the depolarisation of the ventricles, which initiates ventricular contraction. The contraction starts shortly after Q and marks the beginning of systole.
|
Topper's Solved these Questions
- BODY FLUID AND CIRCULATIONBOOK - ARIHANT NEETCHAPTER - BODY FLUID AND CIRCULATIONEXERCISE - ASSERTION AND REASON
7 Videos
- BIOTECHNOLOGY AND ITS APPLICATIONS BOOK - ARIHANT NEETCHAPTER - BIOTECHNOLOGY AND ITS APPLICATIONS EXERCISE - CHAPTER EXERCISES ((C ) MEDICAL ENTRANCES GALLERY )
46 Videos
- BREATHING AND EXCHANGE OF GASES BOOK - ARIHANT NEETCHAPTER - BREATHING AND EXCHANGE OF GASES EXERCISE - Chapter exercise C (Medical entrances gallery )
54 Videos
Similar Questions
Knowledge Check
In the standard ECG of a normal person, the P-wave represents the
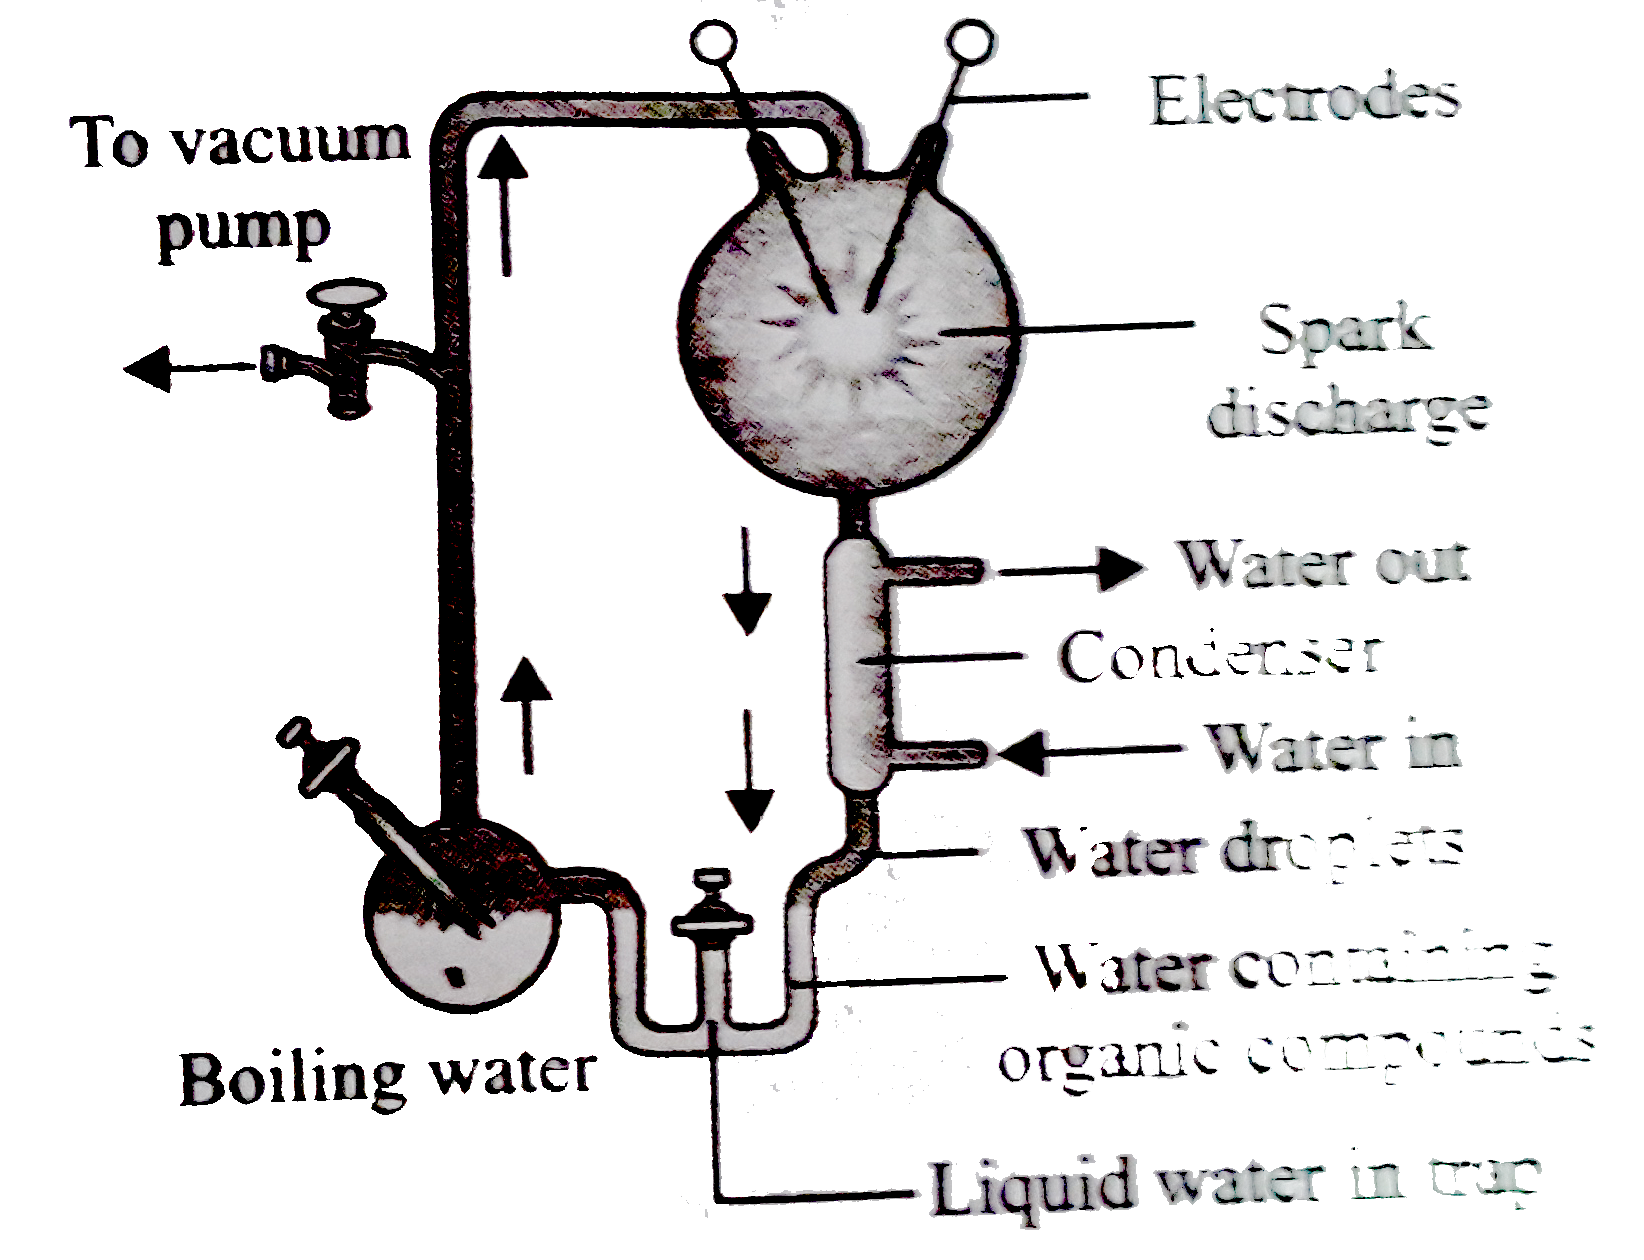
Aatrial depolarisationBventricular depolarisationCatrial repolarisationDventricular repolarisationThe diagram given here is the representation of
 AMiller's experimentBRedi's experimentCLouis pasteur's experimentDSpallanzani's experiment
The diagram given here is the representation of
 AMiller's experimentBRedi's experimentCLouis pasteur's experimentDSpallanzani's experiment

