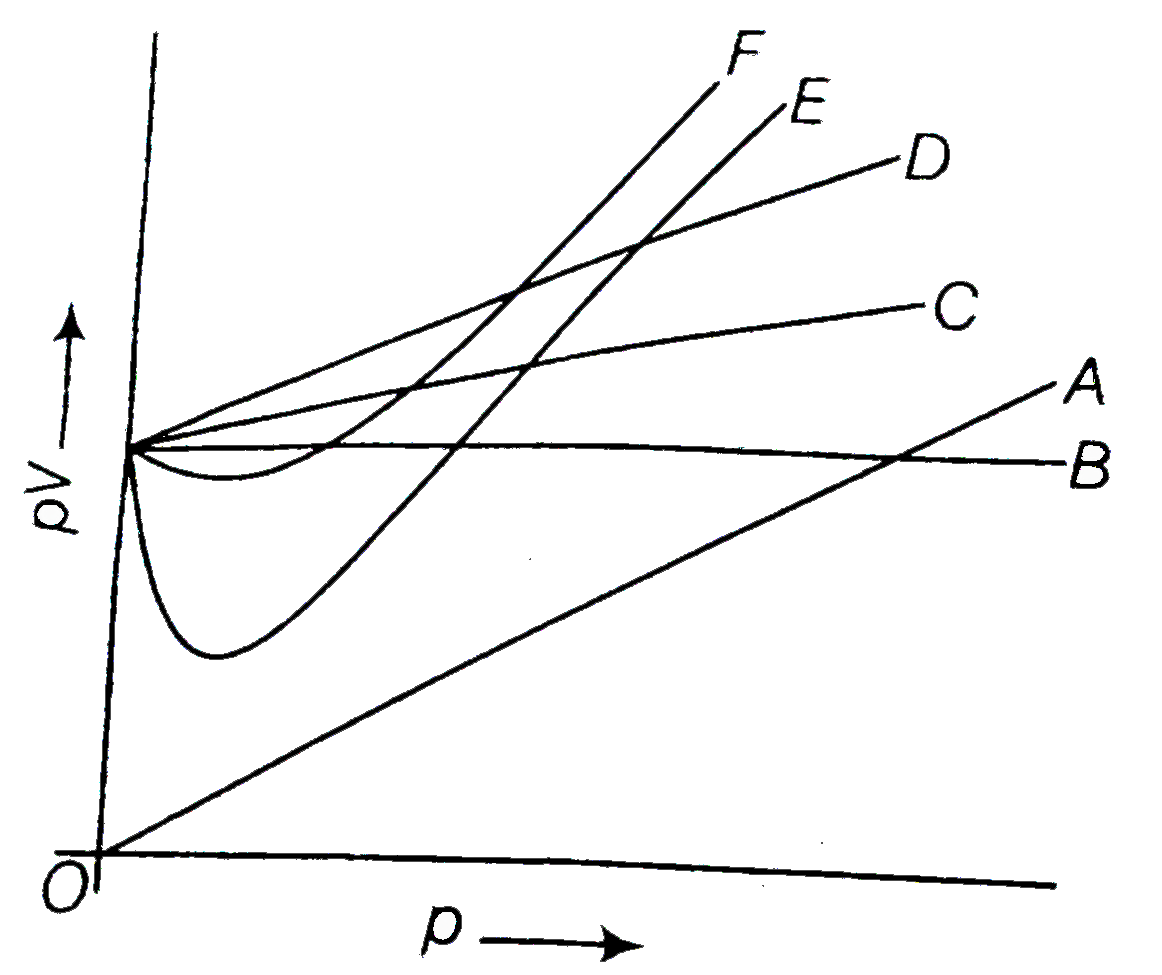
Which curve in Fig. 5.58 represents the curve of ideal gas ?

A
B only
B
C and D only
C
E and F only
D
A and B only
Text Solution
The correct Answer is:A
For ideal gas pv=constant at all pressures, i.e., for B.
|
Topper's Solved these Questions
- STATES OF MATTER : GASES AND LIQUIDESBOOK - PRADEEPCHAPTER - STATES OF MATTER : GASES AND LIQUIDESEXERCISE - MULTIPLE CHOICE QUESTIONS-II
4 Videos
- STATES OF MATTER : GASES AND LIQUIDESBOOK - PRADEEPCHAPTER - STATES OF MATTER : GASES AND LIQUIDESEXERCISE - SHORT ANSWER QUESTIONS
23 Videos
- STATES OF MATTER : GASES AND LIQUIDESBOOK - PRADEEPCHAPTER - STATES OF MATTER : GASES AND LIQUIDESEXERCISE - QUESTIONS AND EXERCISES WITH ANSWERS
21 Videos
- SOME p-BLOCK ELEMENTSBOOK - PRADEEPCHAPTER - SOME p-BLOCK ELEMENTSEXERCISE - Competition Focus (JEE( Main and Advanced)/Medical Entrance) VIII. Assertion-Reason Type Questions (Type I)
23 Videos
- STATES OF MATTER: SOLID MATTERBOOK - PRADEEPCHAPTER - STATES OF MATTER: SOLID MATTEREXERCISE - COMPETITION FOCUS (ASSERTION-REASON)
17 Videos
Similar Questions
Knowledge Check
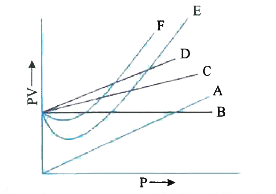
Which curve in figure represents the curve of ideal gas ?
 AOnly BBC and DCE and FDA and B
Which curve in figure represents the curve of ideal gas?
 AB onlyBC and D onlyCE and F onlyDA and B only
Which curve in the following graph represents the curve of ideal gas ?
 AB onlyBC and D onlyCE and F onlyDA and B only
Which curve does not represent Boyl's law ?
View SolutionThe given curve represents the variation of temperature as a function of volume for one mole of an ideal gas. Which of the following curves best represents the variation of pressure as a function of volume?

View SolutionWhich curve does not represent Boyle’s law
View SolutionWhich curve does not represent Boyle's law ?
View SolutionWhich of the following represents market demand curve ?

View Solution
