In Figure, time and distance graph of a linear motion is given. Two positions of time and distance are recorded as, when T = 0, D = 2 and when T = 3, D = 8. Using die concept of slope, find law of motion, i.e., how distance depends upon time.
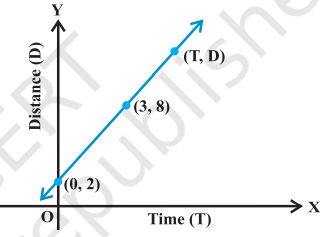
Now, we know that the equation of a line passing through two points (x1,y1)and(x2,y2) is
(y−y1)=y2−y1x2−x1(x−x1).
So, we have to find the equation between time and distance that is the equation of a given line.
So, we have,
(y−8)=(8−23−0)(x−0)
(y−8)=53xy=8+53xy=53x+8
Now, since on y – axis we have distance D and on x – axis we have time T. So, the equation of the given line is,
D=8+53T
Note: To solve these type of question it is important to note that we have used two point form of a straight line in which a line can be represented as,
(y−y1)=(y2−y1x2−x1)(x−x1)Now,herey2−y1x2−x1 is slope of the line.
So, we have utilised that concept also.
Topper's Solved these Questions
- BOOK - NCERTCHAPTER - STRAIGHT LINESEXERCISE - EXERCISE 10.318videos
STRAIGHT LINES
- BOOK - NCERTCHAPTER - STRAIGHT LINESEXERCISE - MISCELLANEOUS EXERCISE24videos
STRAIGHT LINES
- BOOK - NCERTCHAPTER - STRAIGHT LINESEXERCISE - EXERCISE 10.52videos
STRAIGHT LINES
- BOOK - NCERTCHAPTER - STATISTICSEXERCISE - EXERCISE 15.210videos
STATISTICS
- BOOK - NCERTCHAPTER - TRIGONOMETRIC FUNCTIONSEXERCISE - EXERCISE 3.17videos
TRIGONOMETRIC FUNCTIONS
Similar Questions
In figure, time and distance graph of a linear motion is given. Two positions of time and distance recorded and when T=0, D=2 and when T=3, D=8. Using the concept of slope, find law of motion i.e. how distance depends upon time.
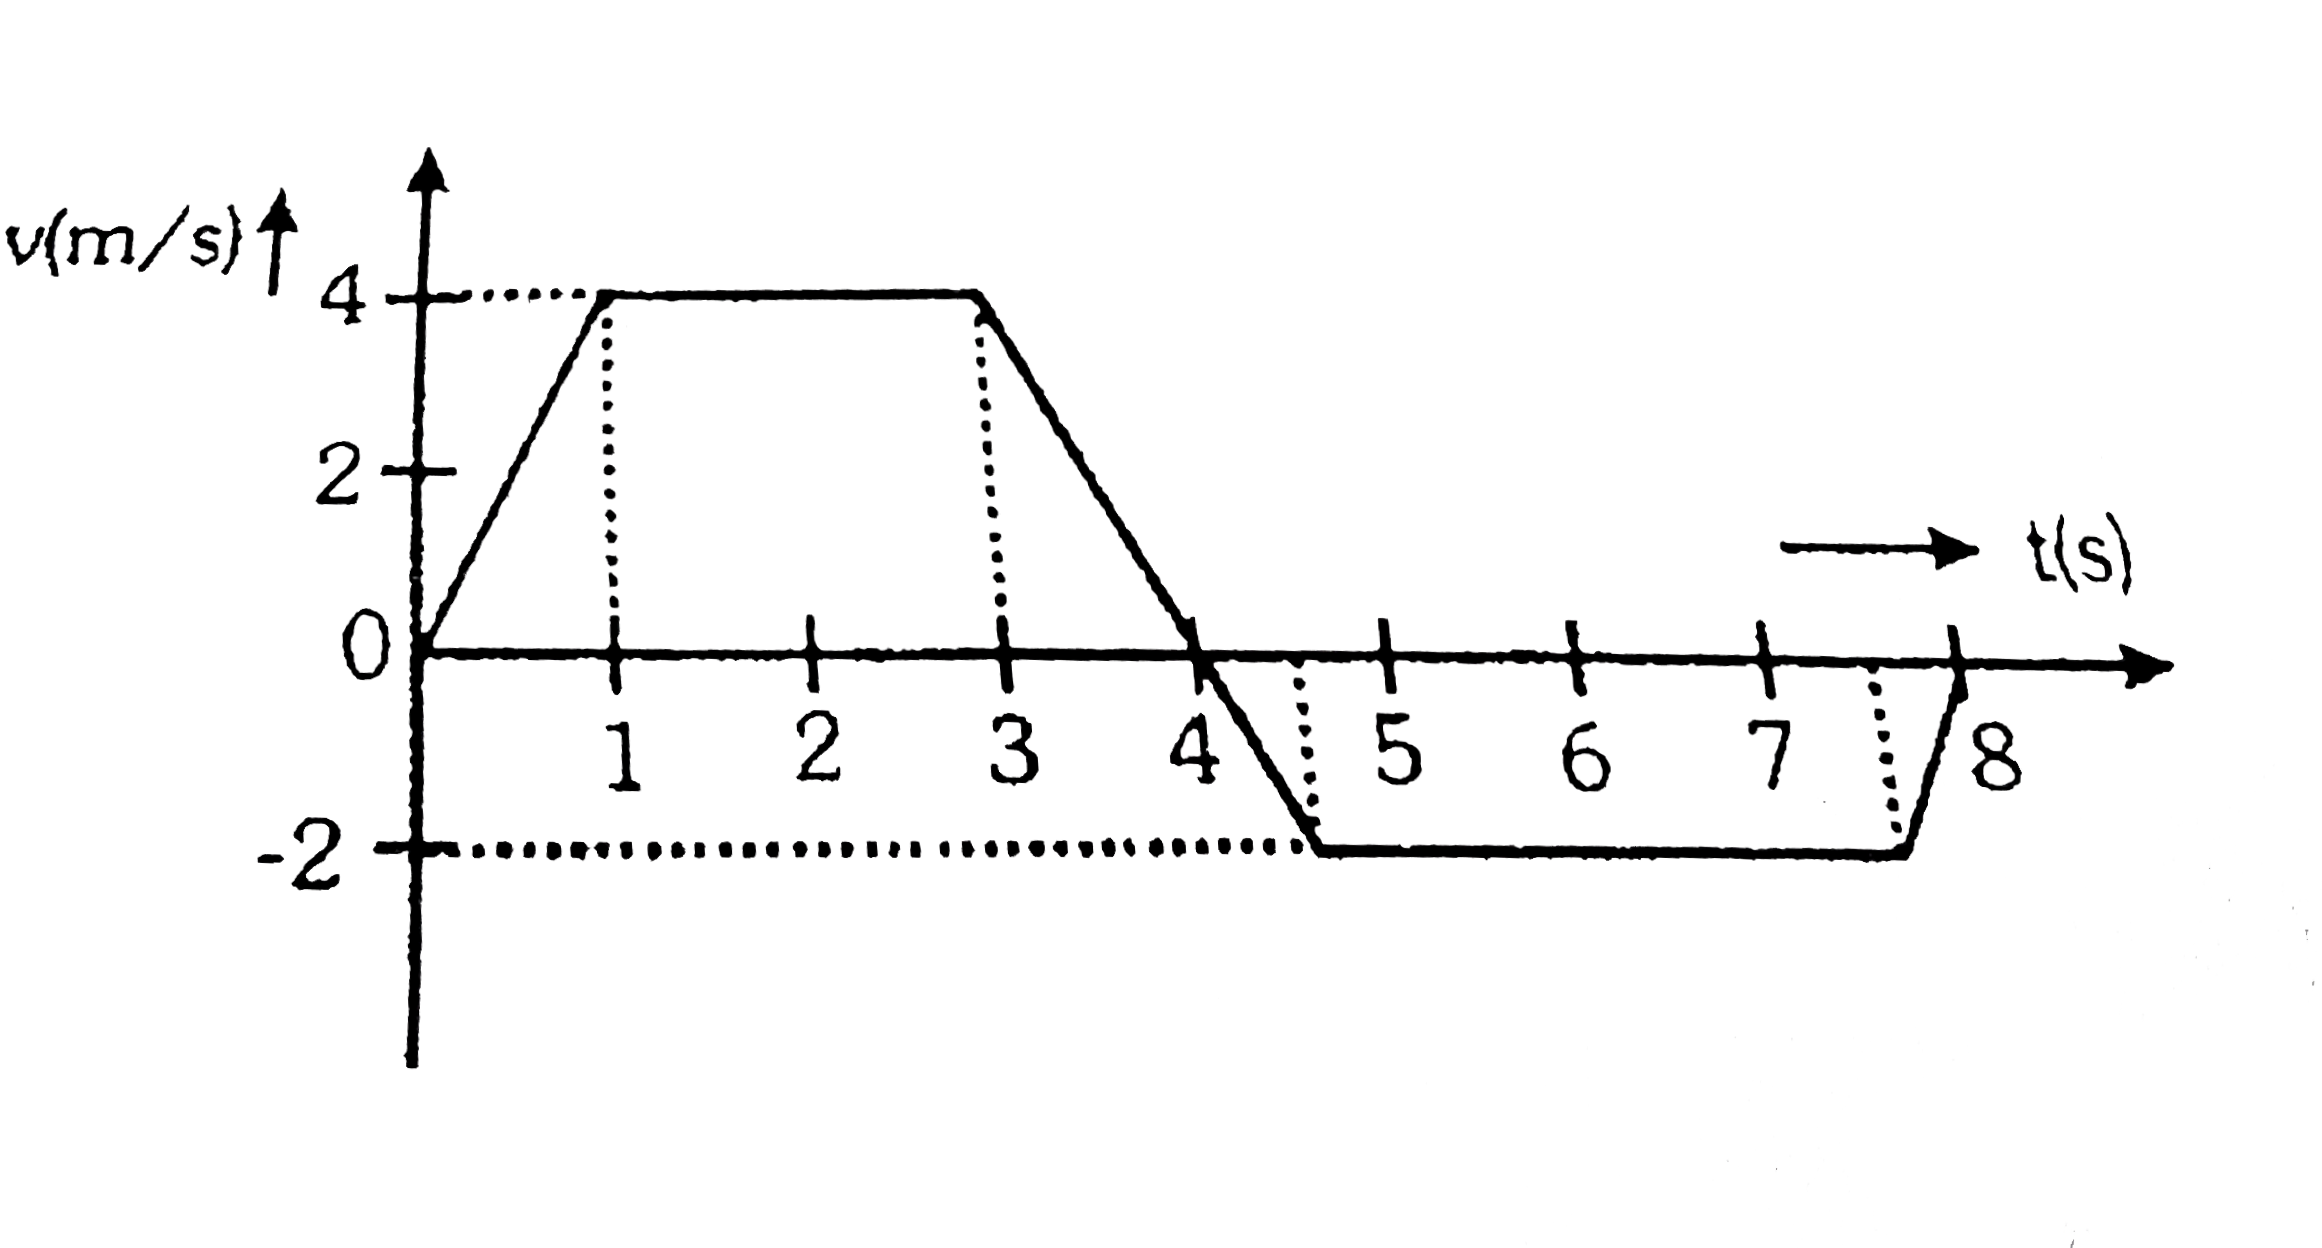
View SolutionThe velocity-time graph of a linear motion is shown in figure. The displacement & distance from the origin after 8 sec is :-
 View Solution
Knowledge Check
- Question 1 - Select One
The v-t graph of a linear motion is shown in adjoining figure. The distance from origin after 8 seconds is -
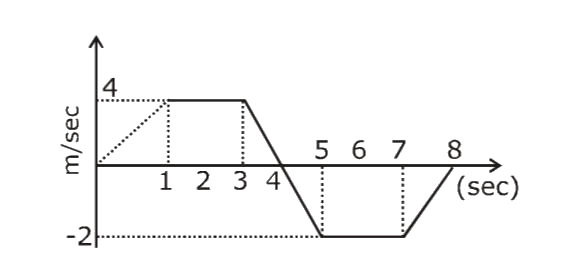 A18 metersB16 metersC8 metersD6 meters
 - Question 2 - Select One
The velocity-time graph of a linear motion is shown below. The distance from the origin after 8 seconds is :
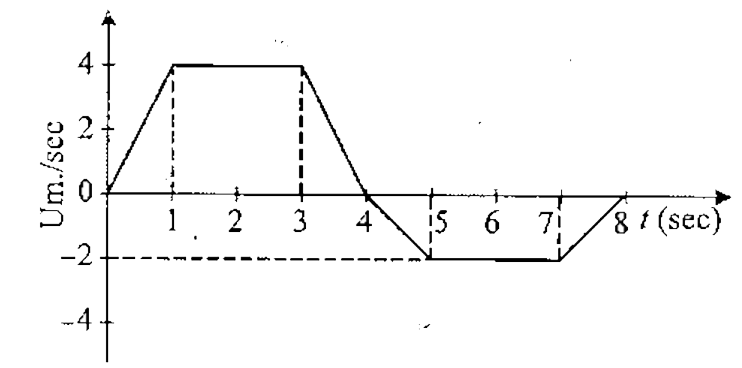 A18 mB16 mC8 mD6 m
 - Question 3 - Select One
The velocity-time graph of a linear motion os shown figure. The distance from the starting point after 8sec is.
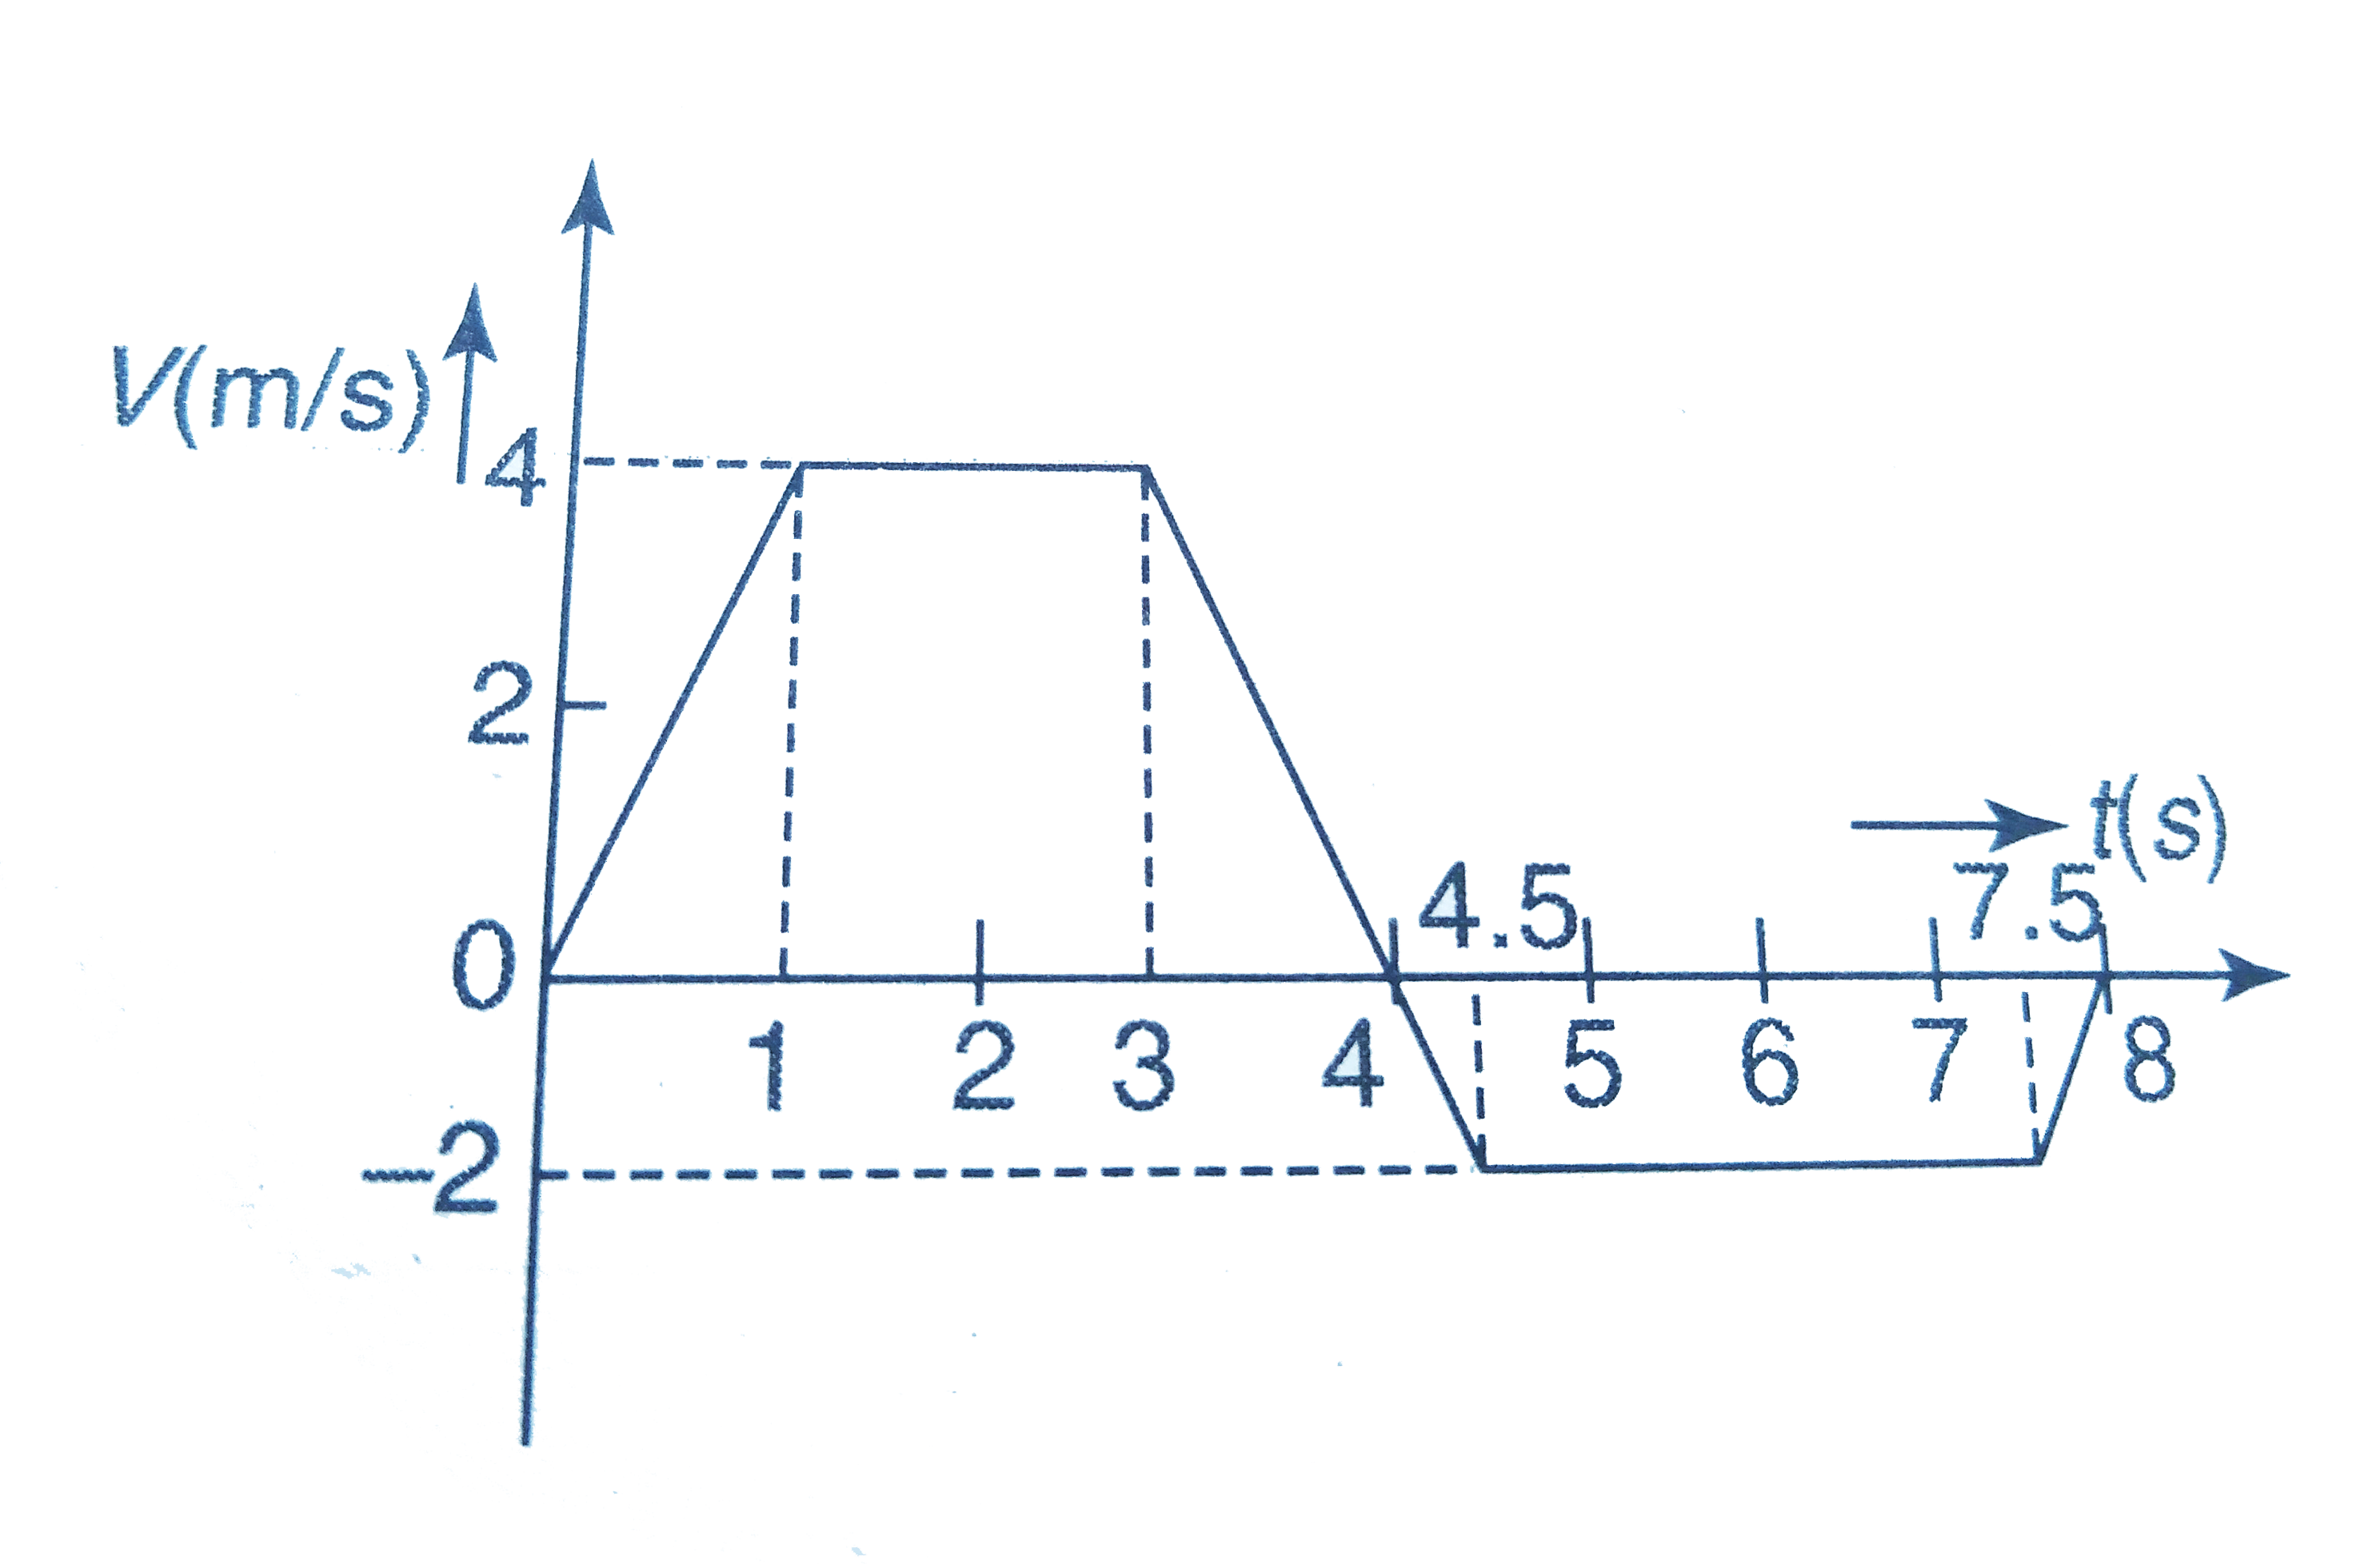 A5 mB16 mC8 mD19 m
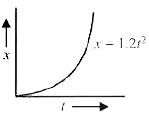
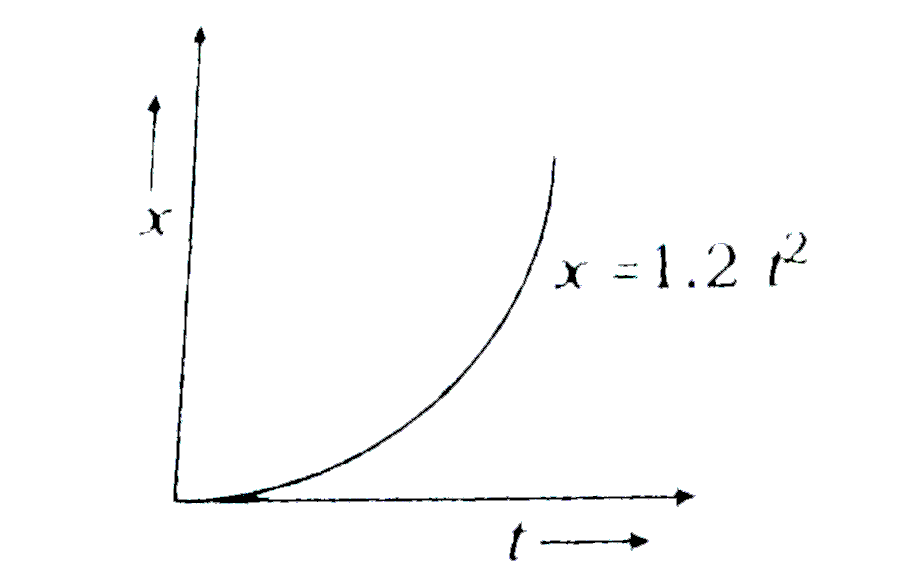
Given figure shows the distance-time graph of the motion of a car. It follows from the,| graph that the car is
 View Solution
Figure given shows the distance - time graph of the motion of a car. It follows from the graph that the car is
 View Solution
The distance-time graph of an object shown in figure 2.E2.
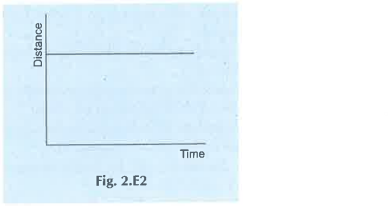
The objectView SolutionThe velocity time graph of a linear motion is shown in the figure. The distance from the starting point after 8 seconds will be
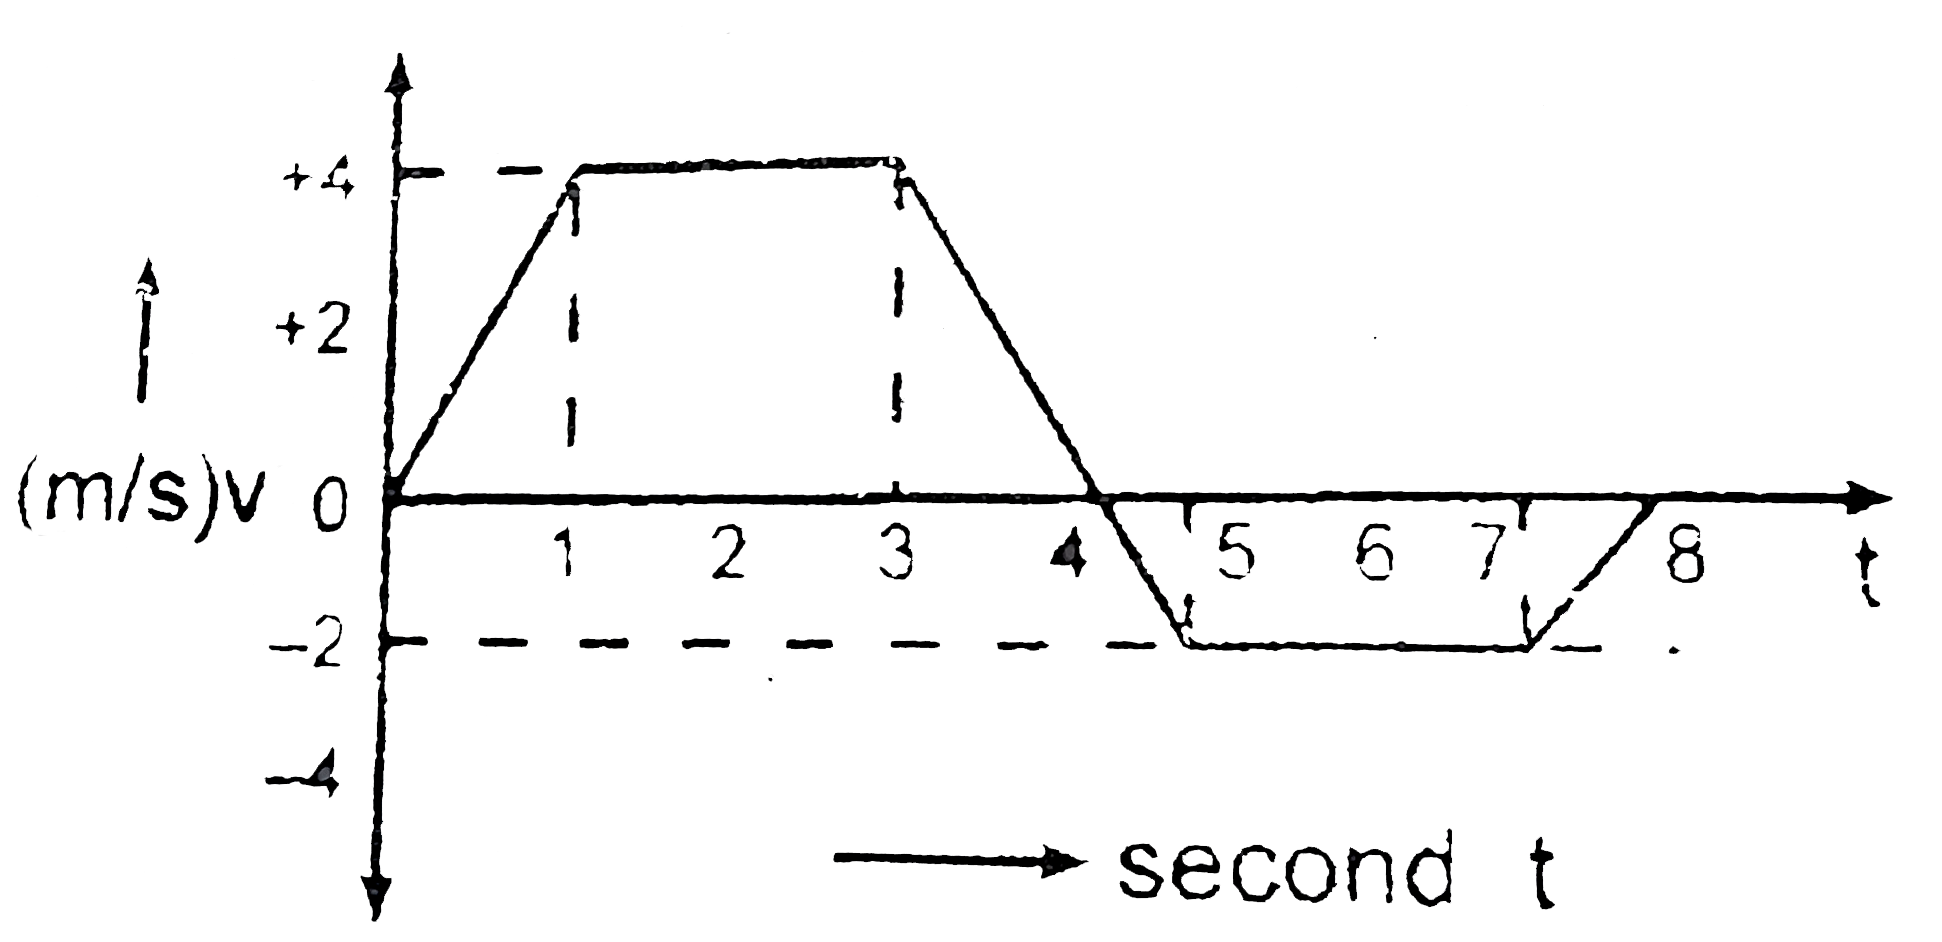 .View Solution
Figure shows that distance-time graph for the motion of two vechicles P and Q. which one of them is moving faster ?
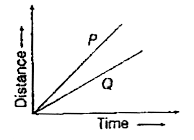 View Solution

