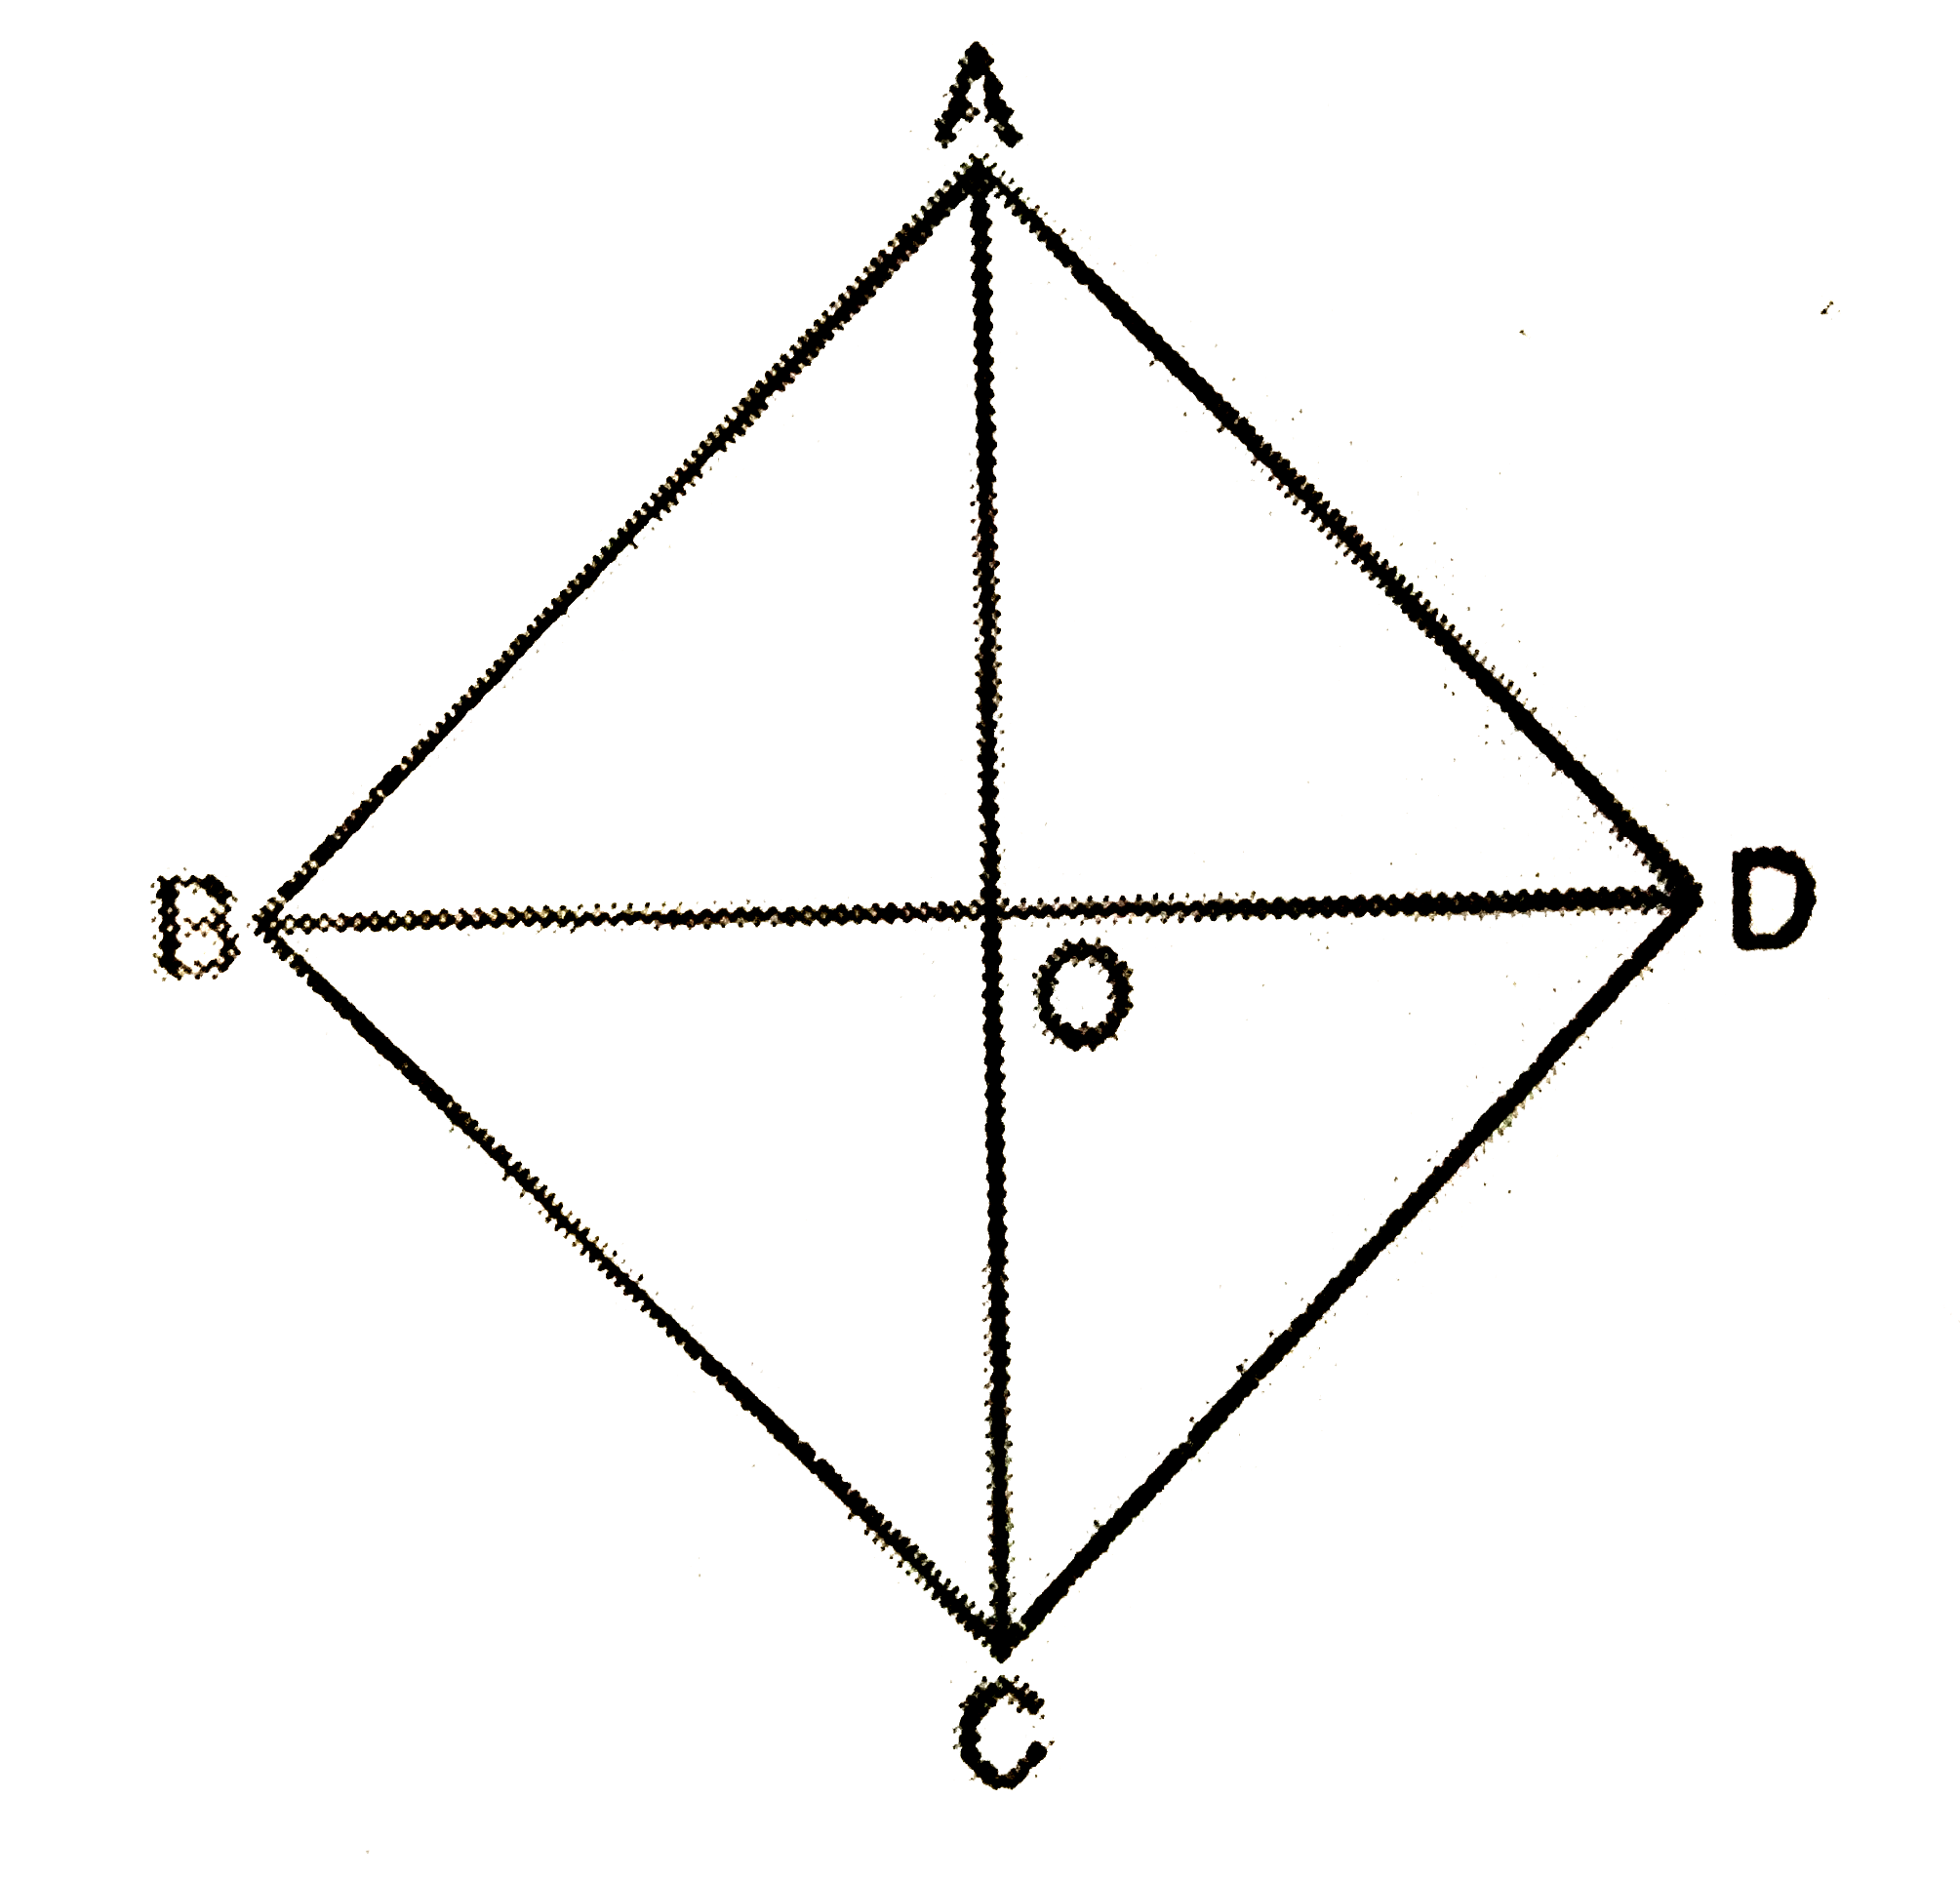
एक समचतुर्भुज के विकर्णों की लम्बाइयाँ 8 सेमी तथा 6 सेमी हैं । इसकी प्रत्येक भुजा की माप होगी :

2 सेमी
3 सेमी
4 सेमी
5 सेमी
The correct Answer is:D
AC =8 सेमी
तब AO=12AC=12×8
AO = 4 सेमी
तथा BD = 6 सेमी
BO=12BD=12×6=3 सेमी
समकोण ΔAOB में , AB=√AO2+BO2=√16+9=√25=5 सेमी |

Topper's Solved these Questions
- त्रिभुज BOOK - MANOHAR RAYCHAPTER - त्रिभुज EXERCISE - उदाहरण
1 Videos
- त्रिभुज BOOK - MANOHAR RAYCHAPTER - त्रिभुज EXERCISE - प्रश्नावली 6(A)
2 Videos
- त्रिकोणमिति के कुछ अनुप्रयोगBOOK - MANOHAR RAYCHAPTER - त्रिकोणमिति के कुछ अनुप्रयोगEXERCISE - लघु उत्तरीय
2 Videos
- दो चार वाले रैखिक समीकरण युग्मBOOK - MANOHAR RAYCHAPTER - दो चार वाले रैखिक समीकरण युग्मEXERCISE - प्रश्नावली 3(I)
20 Videos
Similar Questions
निम्न आकृति में ∠P ज्ञात कीजिए ।

View Solutionनिम्नलिखित युग्मों के दो भिन्न - भिन्न उदाहरण दीजिए :
(i) समरूप आकृतियाँ
(ii) ऐसी आकृतियाँ जो समरूप नहीं हैं
View Solutionएक नहर के एक तट पर एक टीवी टॉवर ऊर्ध्वाधर : खड़ा हैं । टॉवर के ठीक सामने दूसरे के एक अन्य बिंदु से टॉवर शिखर का उन्नयन कोण 60∘ है। इसी तट पर इस बिन्दु से 20 m दूर और इस बिंदु को मीनार के पाद से मिलाने वाली रेखा पर स्थित एक अन्य बिन्दु से टॉवर के शिखर का उन्नयन कोण 30∘ है (देखिए आकृति) । टॉवर की ऊँचाई और नहर की चौड़ाई ज्ञात कीजिए ।

View Solutionसमीकरण 8x+5y=11 को संतुष्ट करने वाले बिन्दु के निर्देशांक है :
View SolutionHow many lines of symmetry does the above figure have ?
View SolutionWhich of the following are correct chain isomers of butane ? (i)
View SolutionDetermine the point of symmetry of a regular hexagon.
View SolutionDtermine the images of the following figure about the given line :
View SolutionMatch the following Column A to Column B

View SolutionMatch the following Column A to Column B

View SolutionMatch the following Column A to Column B

View SolutionFind the area of the figure given below.

View SolutionThe area of the shaded part in the figure given below is ______.

View SolutionThe inequation represented by the graph given below is :
View SolutionThe inequation that best describes the graph given below is _________
View SolutionThe inequation that best describes the following graph is _________
View Solution
