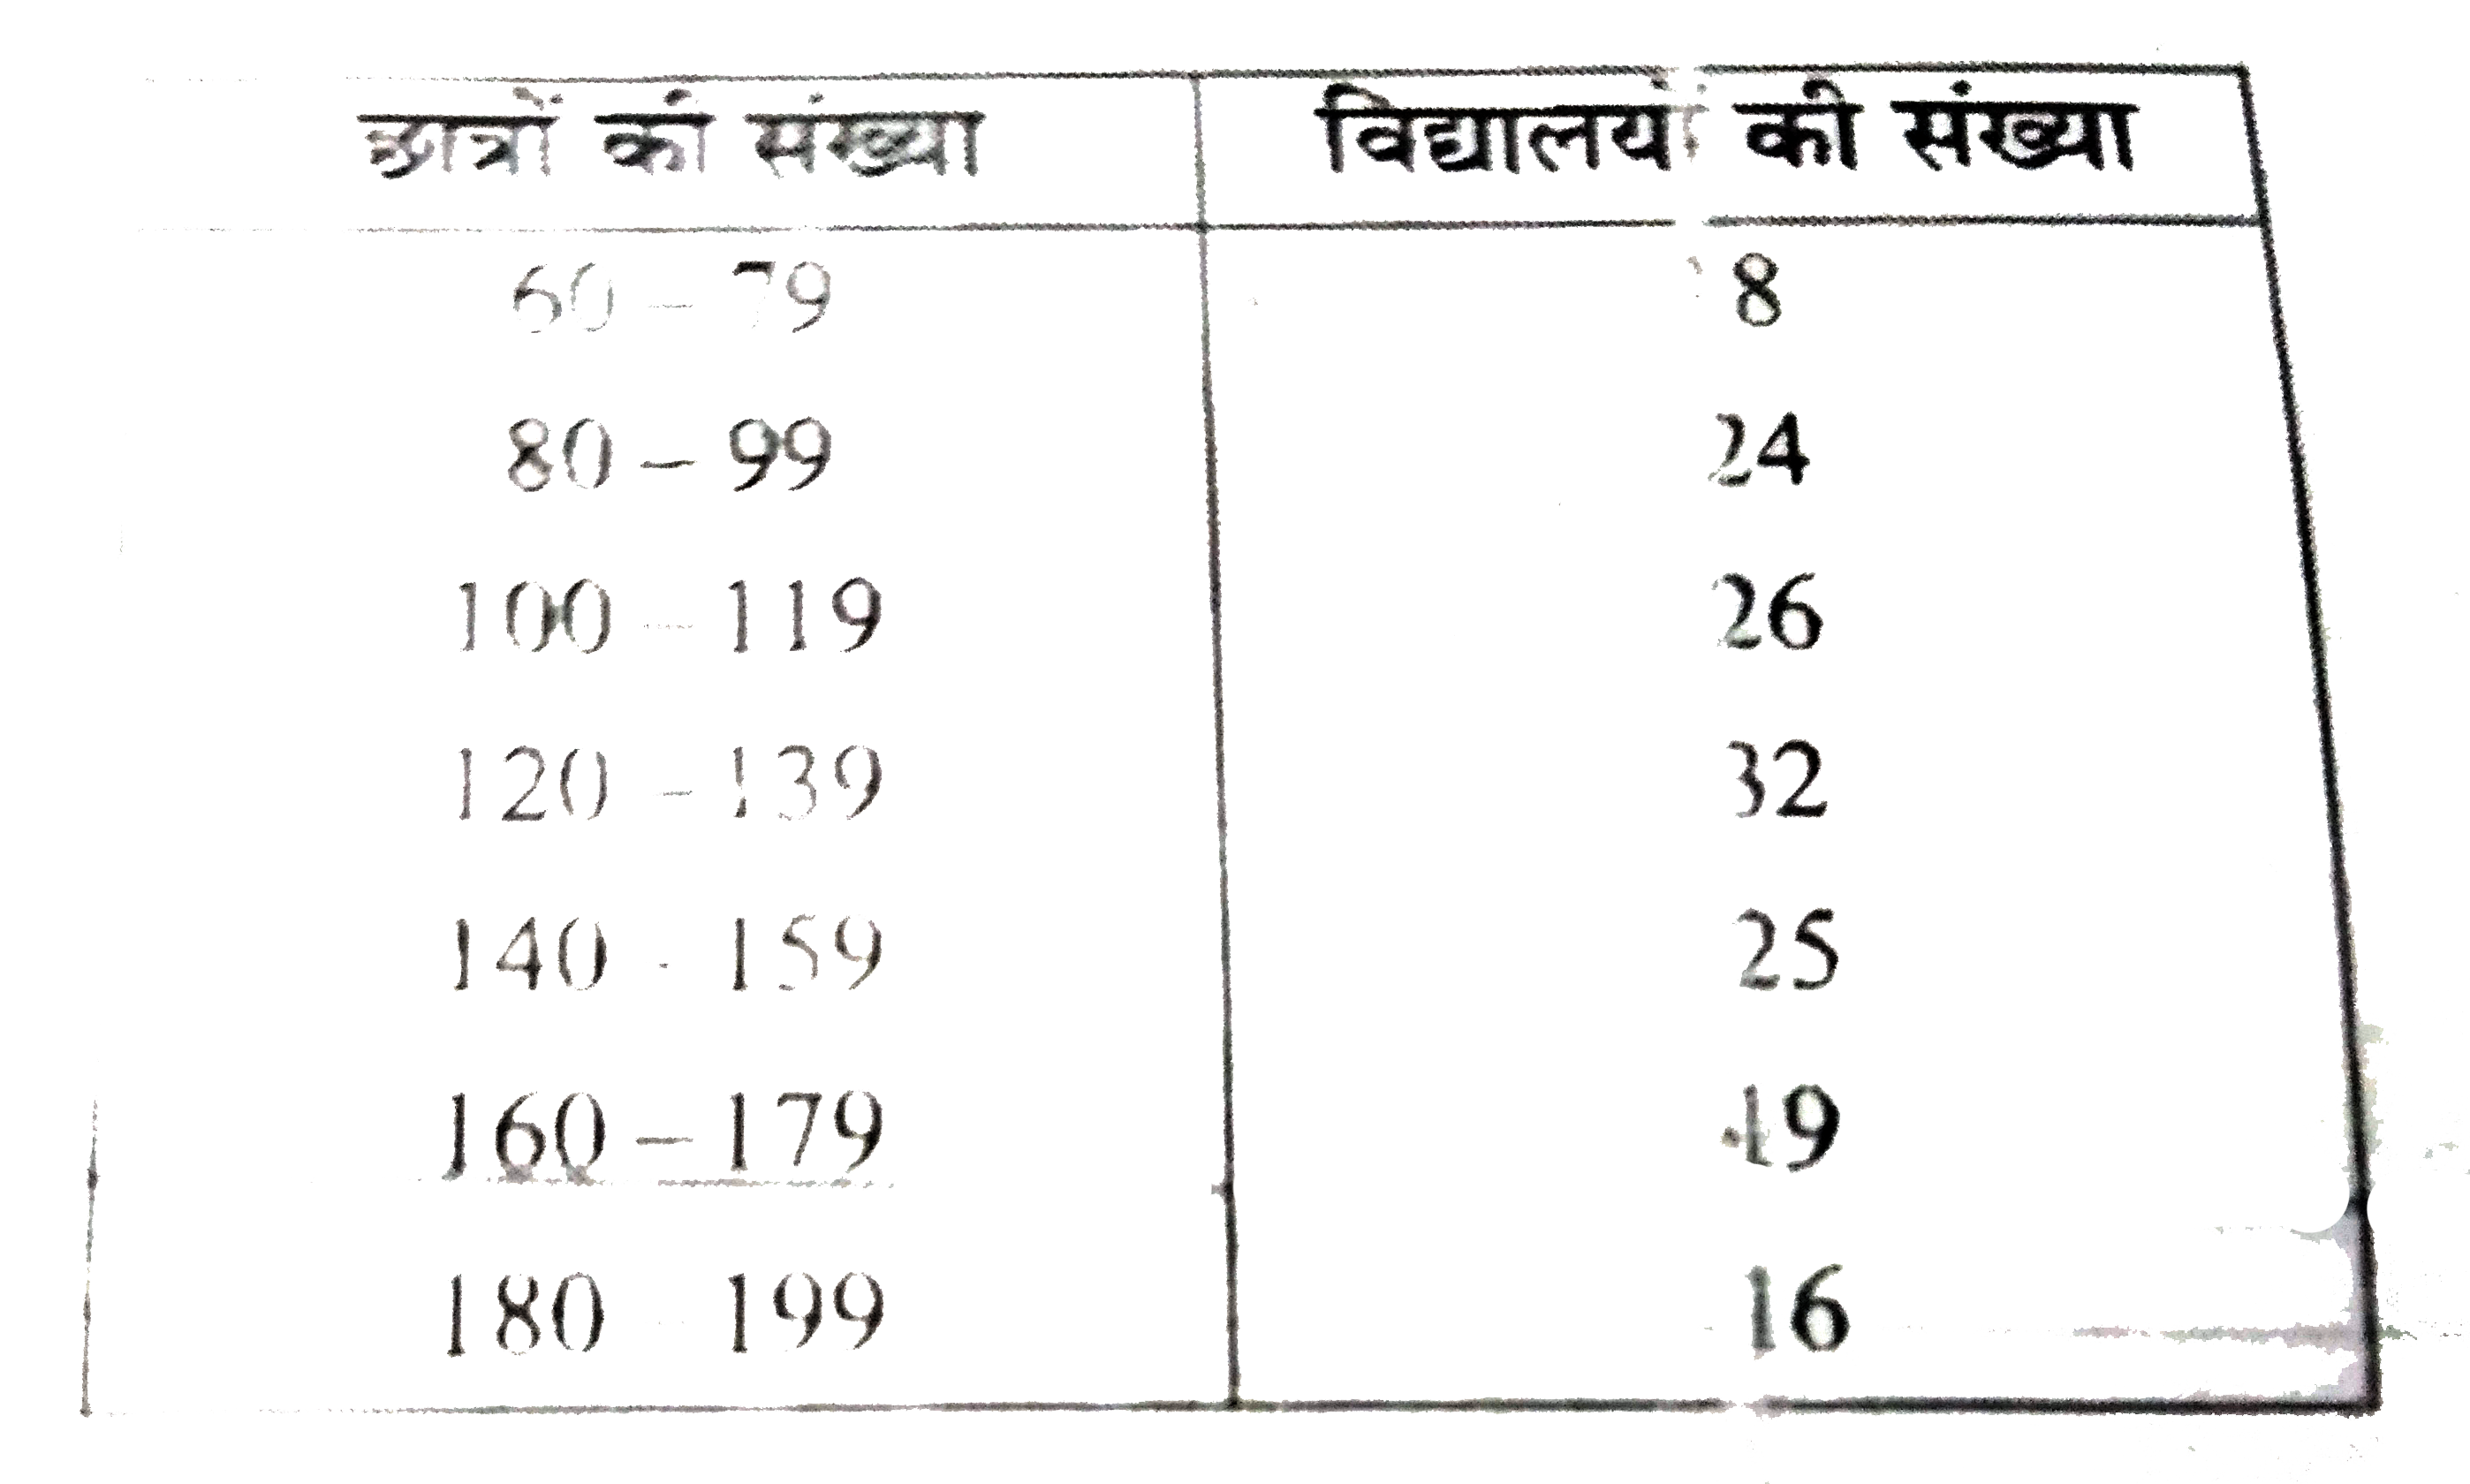
निम्नलिखित सारणी में किसी जनपद के कॉलेजों में प्रवेश दिए गए छात्रों की संख्या दी गई है :

प्रति विद्यालय प्रविष्ट छात्रों की औसत संख्या ज्ञात कीजिए ।
The correct Answer is:137.61
Step by step video & image solution for निम्नलिखित सारणी में किसी जनपद के कॉलेजों में प्रवेश दिए गए छात्रों की संख्या दी गई है : प्रति विद्यालय प्रविष्ट छात्रों की औसत संख्या ज्ञात कीजिए । by Maths experts to help you in doubts & scoring excellent marks in Class 10 exams.
Updated on:21/07/2023Topper's Solved these Questions
- सांखियकीBOOK - MANOHAR RAYCHAPTER - सांखियकीEXERCISE - प्रश्नावली 14(C)
14 Videos
- सांखियकीBOOK - MANOHAR RAYCHAPTER - सांखियकीEXERCISE - प्रश्नावली 14(D)
7 Videos
- सांखियकीBOOK - MANOHAR RAYCHAPTER - सांखियकीEXERCISE - प्रश्नावली 14(A)
18 Videos
- समांतर श्रेणी BOOK - MANOHAR RAYCHAPTER - समांतर श्रेणी EXERCISE - प्रश्नावली 5(E)
18 Videos
Similar Questions
निम्नलिखित बारम्बारता बंटन किसी मोहल्ले के 68 उपभोक्ताओं की बिजली की मासिक खपत दर्शाता है ।

इन आँकड़ों के माधयक तथा माध्य ज्ञात कीजिए ।
View Solutionनिम्नलिखित सारणी किसी अस्पताल में एक विशेष वर्ष में भर्ती हुए रोगियों की आयु को दर्शाती हैं :

उपरोक्त आँकड़ों से बहुलक ज्ञात कीजिए।
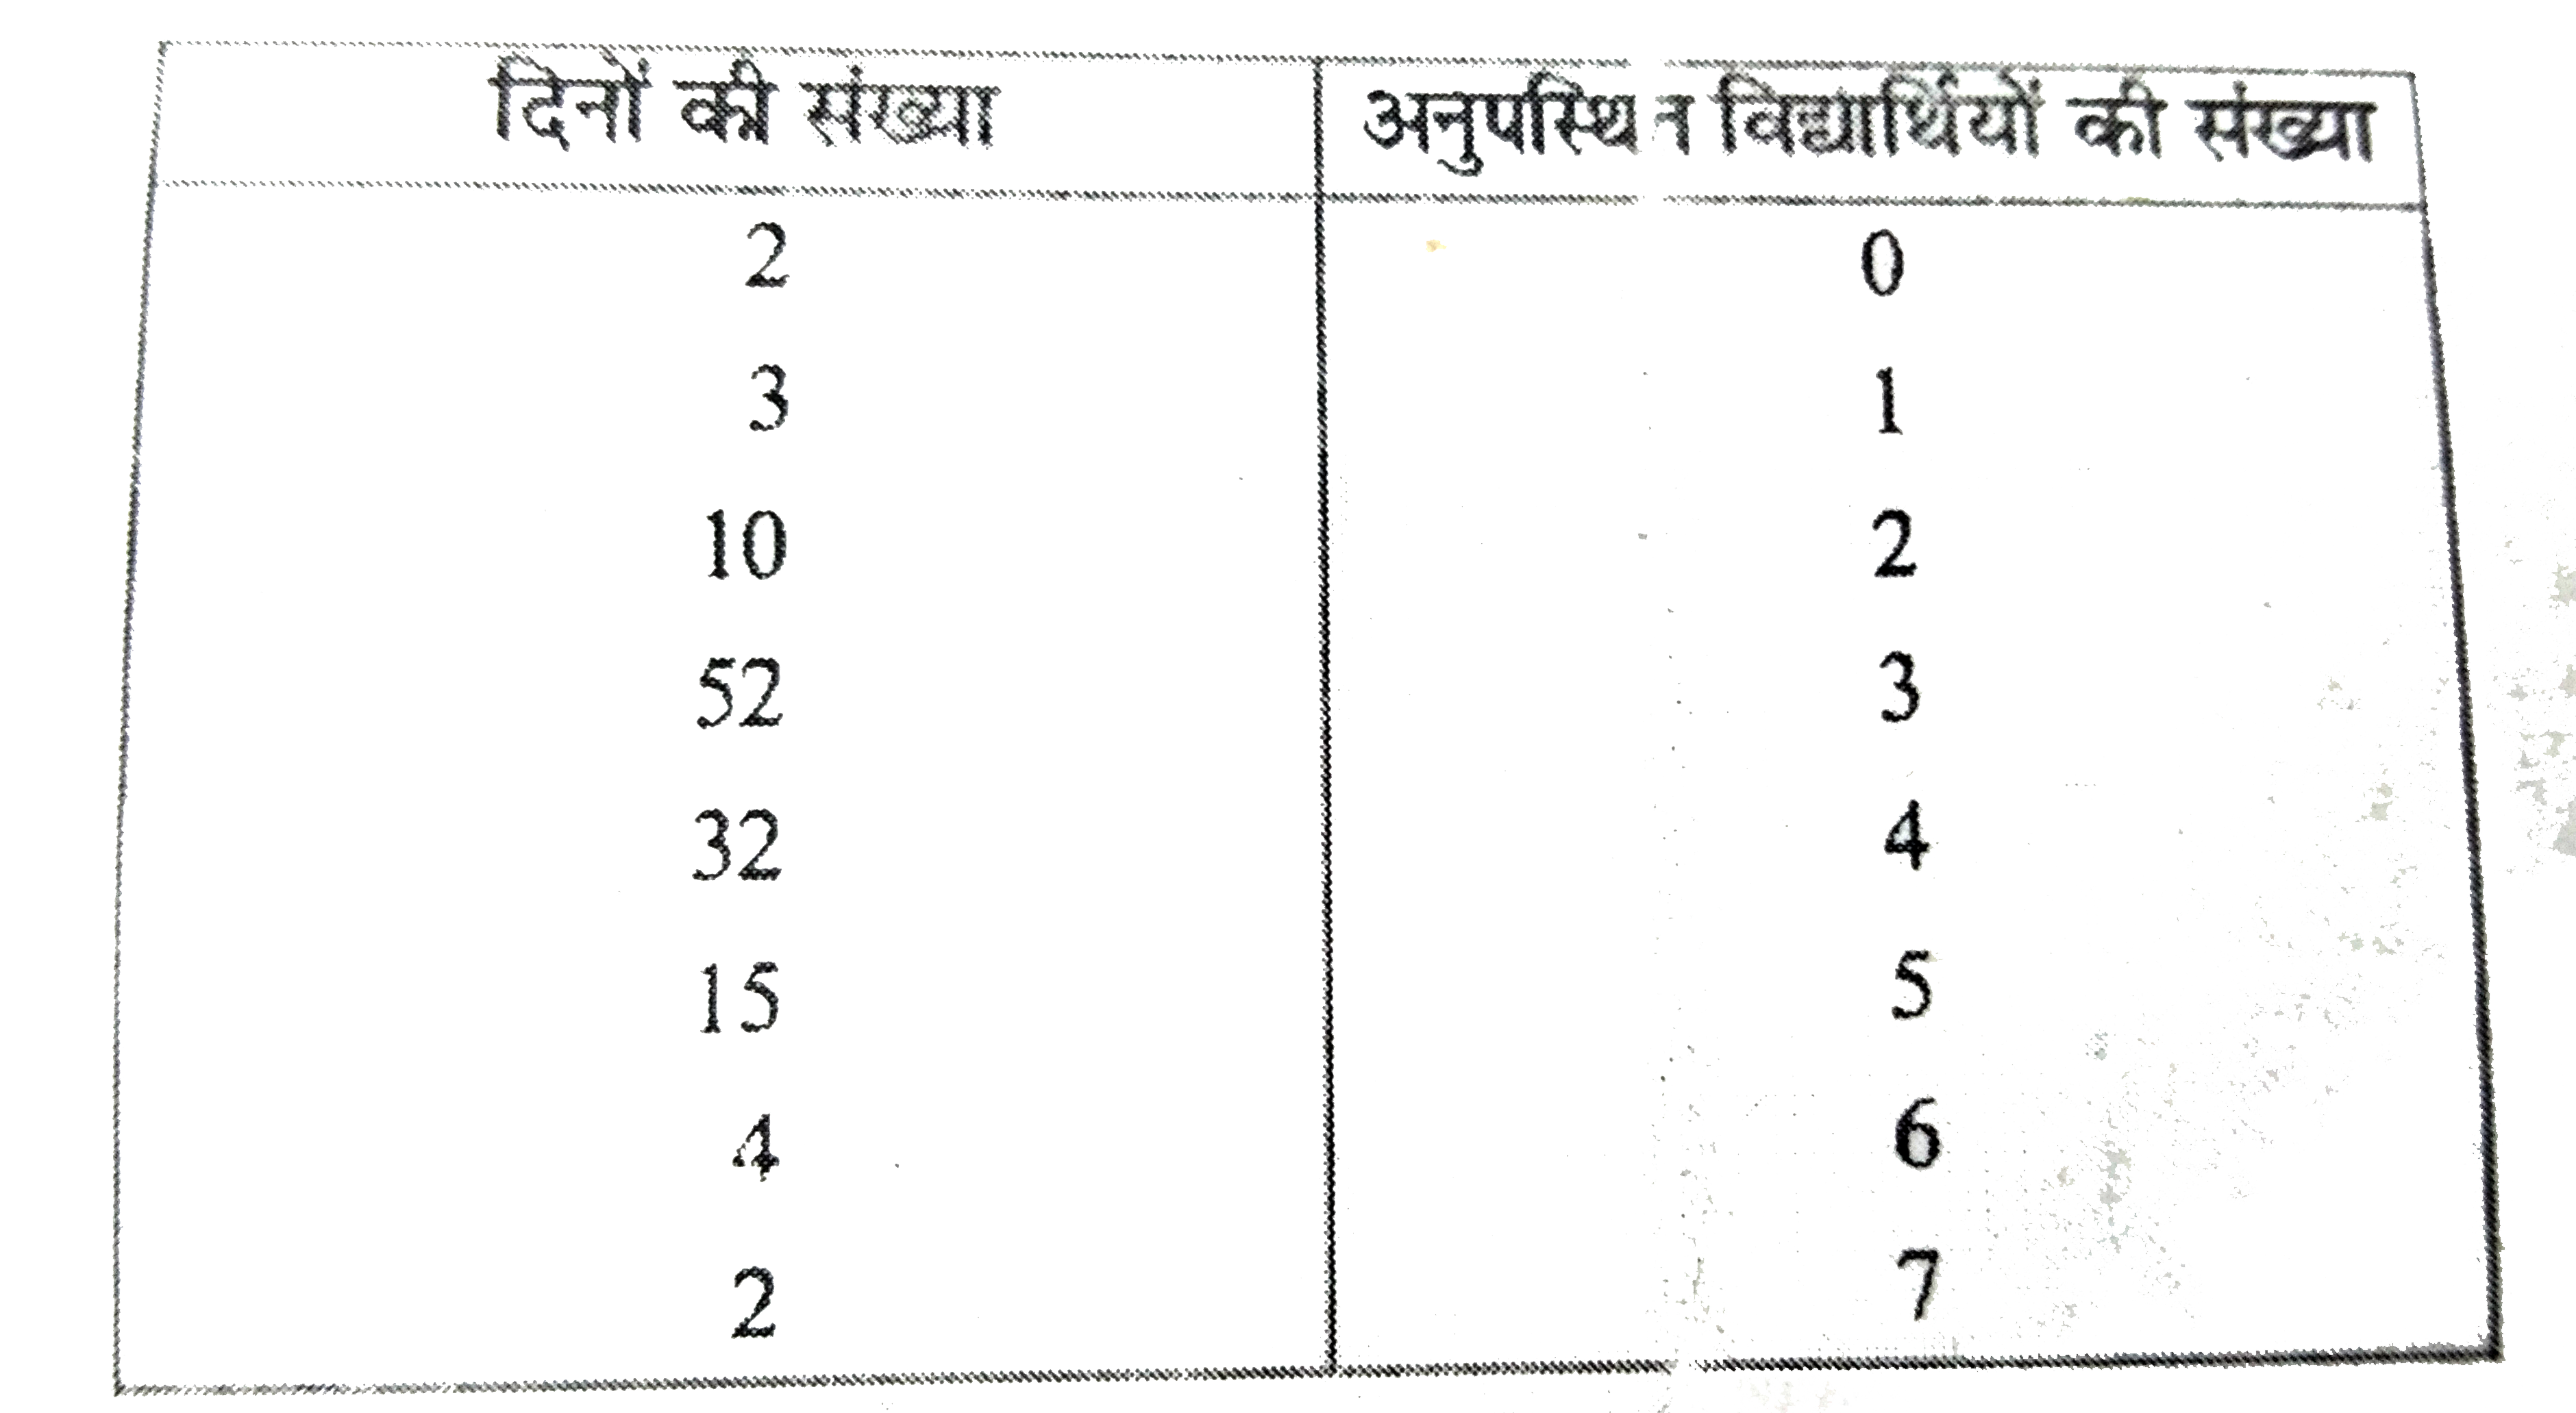
View Solutionकिसी कक्षा में 120 दिनों की अवधि में अनुपस्थित विद्यार्थियों की संख्या निम्नलिखित सारणी में दी है है :

प्रतिदिन अनुपस्थित विद्यार्थियों की औसत संख्या ज्ञात कीजिए ।
View Solutionकिसी स. श्रे. में, यदि d--4, n=7 और an=4 है, तो a का मान है :
View SolutionDetermine the point of symmetry of a regular hexagon.
View SolutionDtermine the images of the following figure about the given line :
View SolutionMatch the following Column A to Column B

View SolutionMatch the following Column A to Column B

View SolutionMatch the following Column A to Column B

View SolutionThe inequation represented by the graph given below is :
View SolutionThe inequation that best describes the graph given below is _________
View SolutionThe inequation that best describes the following graph is _________
View SolutionThe following table shows the number of students of 7 college participating in extra curricular activities: निम्न सारणी उन कॉलेजों के छात्रों की संख्या दर्शाती है, जो पाठ्येत्तर क्रियाकलापों में भाग लेते हैं। Read the table and answer the following question. तालिका पढ़ें और निम्नलिखित प्रश्नों के उत्तर दें। The difference of range of number of students in activity IV and the average of number of students in activity III per college is क्रियाकलाप IV में छात्रों की संख्या के परिसर और क्रियाकलाप III में छात्रों की औसत संख्या प्रति कॉलेज का अंतर है-
View SolutionThe following table shows the number of students of 7 college participating in extra curricular activities: निम्न सारणी उन कॉलेजों के छात्रों की संख्या दर्शाती है, जो पाठ्येत्तर क्रियाकलापों में भाग लेते हैं। Read the table and answer the following question. तालिका पढ़ें और निम्नलिखित प्रश्नों के उत्तर दें। Percentage of the number of students in activity II to that of IV is क्रियाकलाप II में छात्रों की संख्या का क्रियाकलाप IV में छात्रों की संख्या के साथ प्रतिशत है-
View SolutionThe total number of students in section A and B of a class is 110. The number of students in section A is 10 more than that of section B. The average score of the students in B, in a test, is 20% more than that of students in A. If the average score of all the students in the class is 72, then what is the average score of the students in A?
किसी कक्षा के खंड A और खंड B के छात्रों की कुल संख्या 110 है | खंड A में छात्रों की संख्या खंड 9 के छात्रों की संख्या से 10 अधिक है| किसी परीक्षा में B के छात्रों का औसत प्राप्तंक A के छात्रों के औसत प्राप्तंक से 20% अधिक है | यदि सभी छात्रों का औसत प्राप्तांक 72 है, तो A के छात्रों का औसत प्राप्तांक ज्ञात करें |
View SolutionThe number of students in classes A and B are 60 and 70, respectively. The average score in mathematics of students in B is 57 and that of all students in A and B is 63. What is the average score of students in A?
कक्षा A और B में छात्रों की संख्या क्रमश: 60 और 10 है | B में गणित में छात्रों का औसत अंक 57 तथा A और B के सभी छात्रों का गणित में औसत अंक 63 है |A के छात्रों का औसत अंक ज्ञात करें |
View Solution
