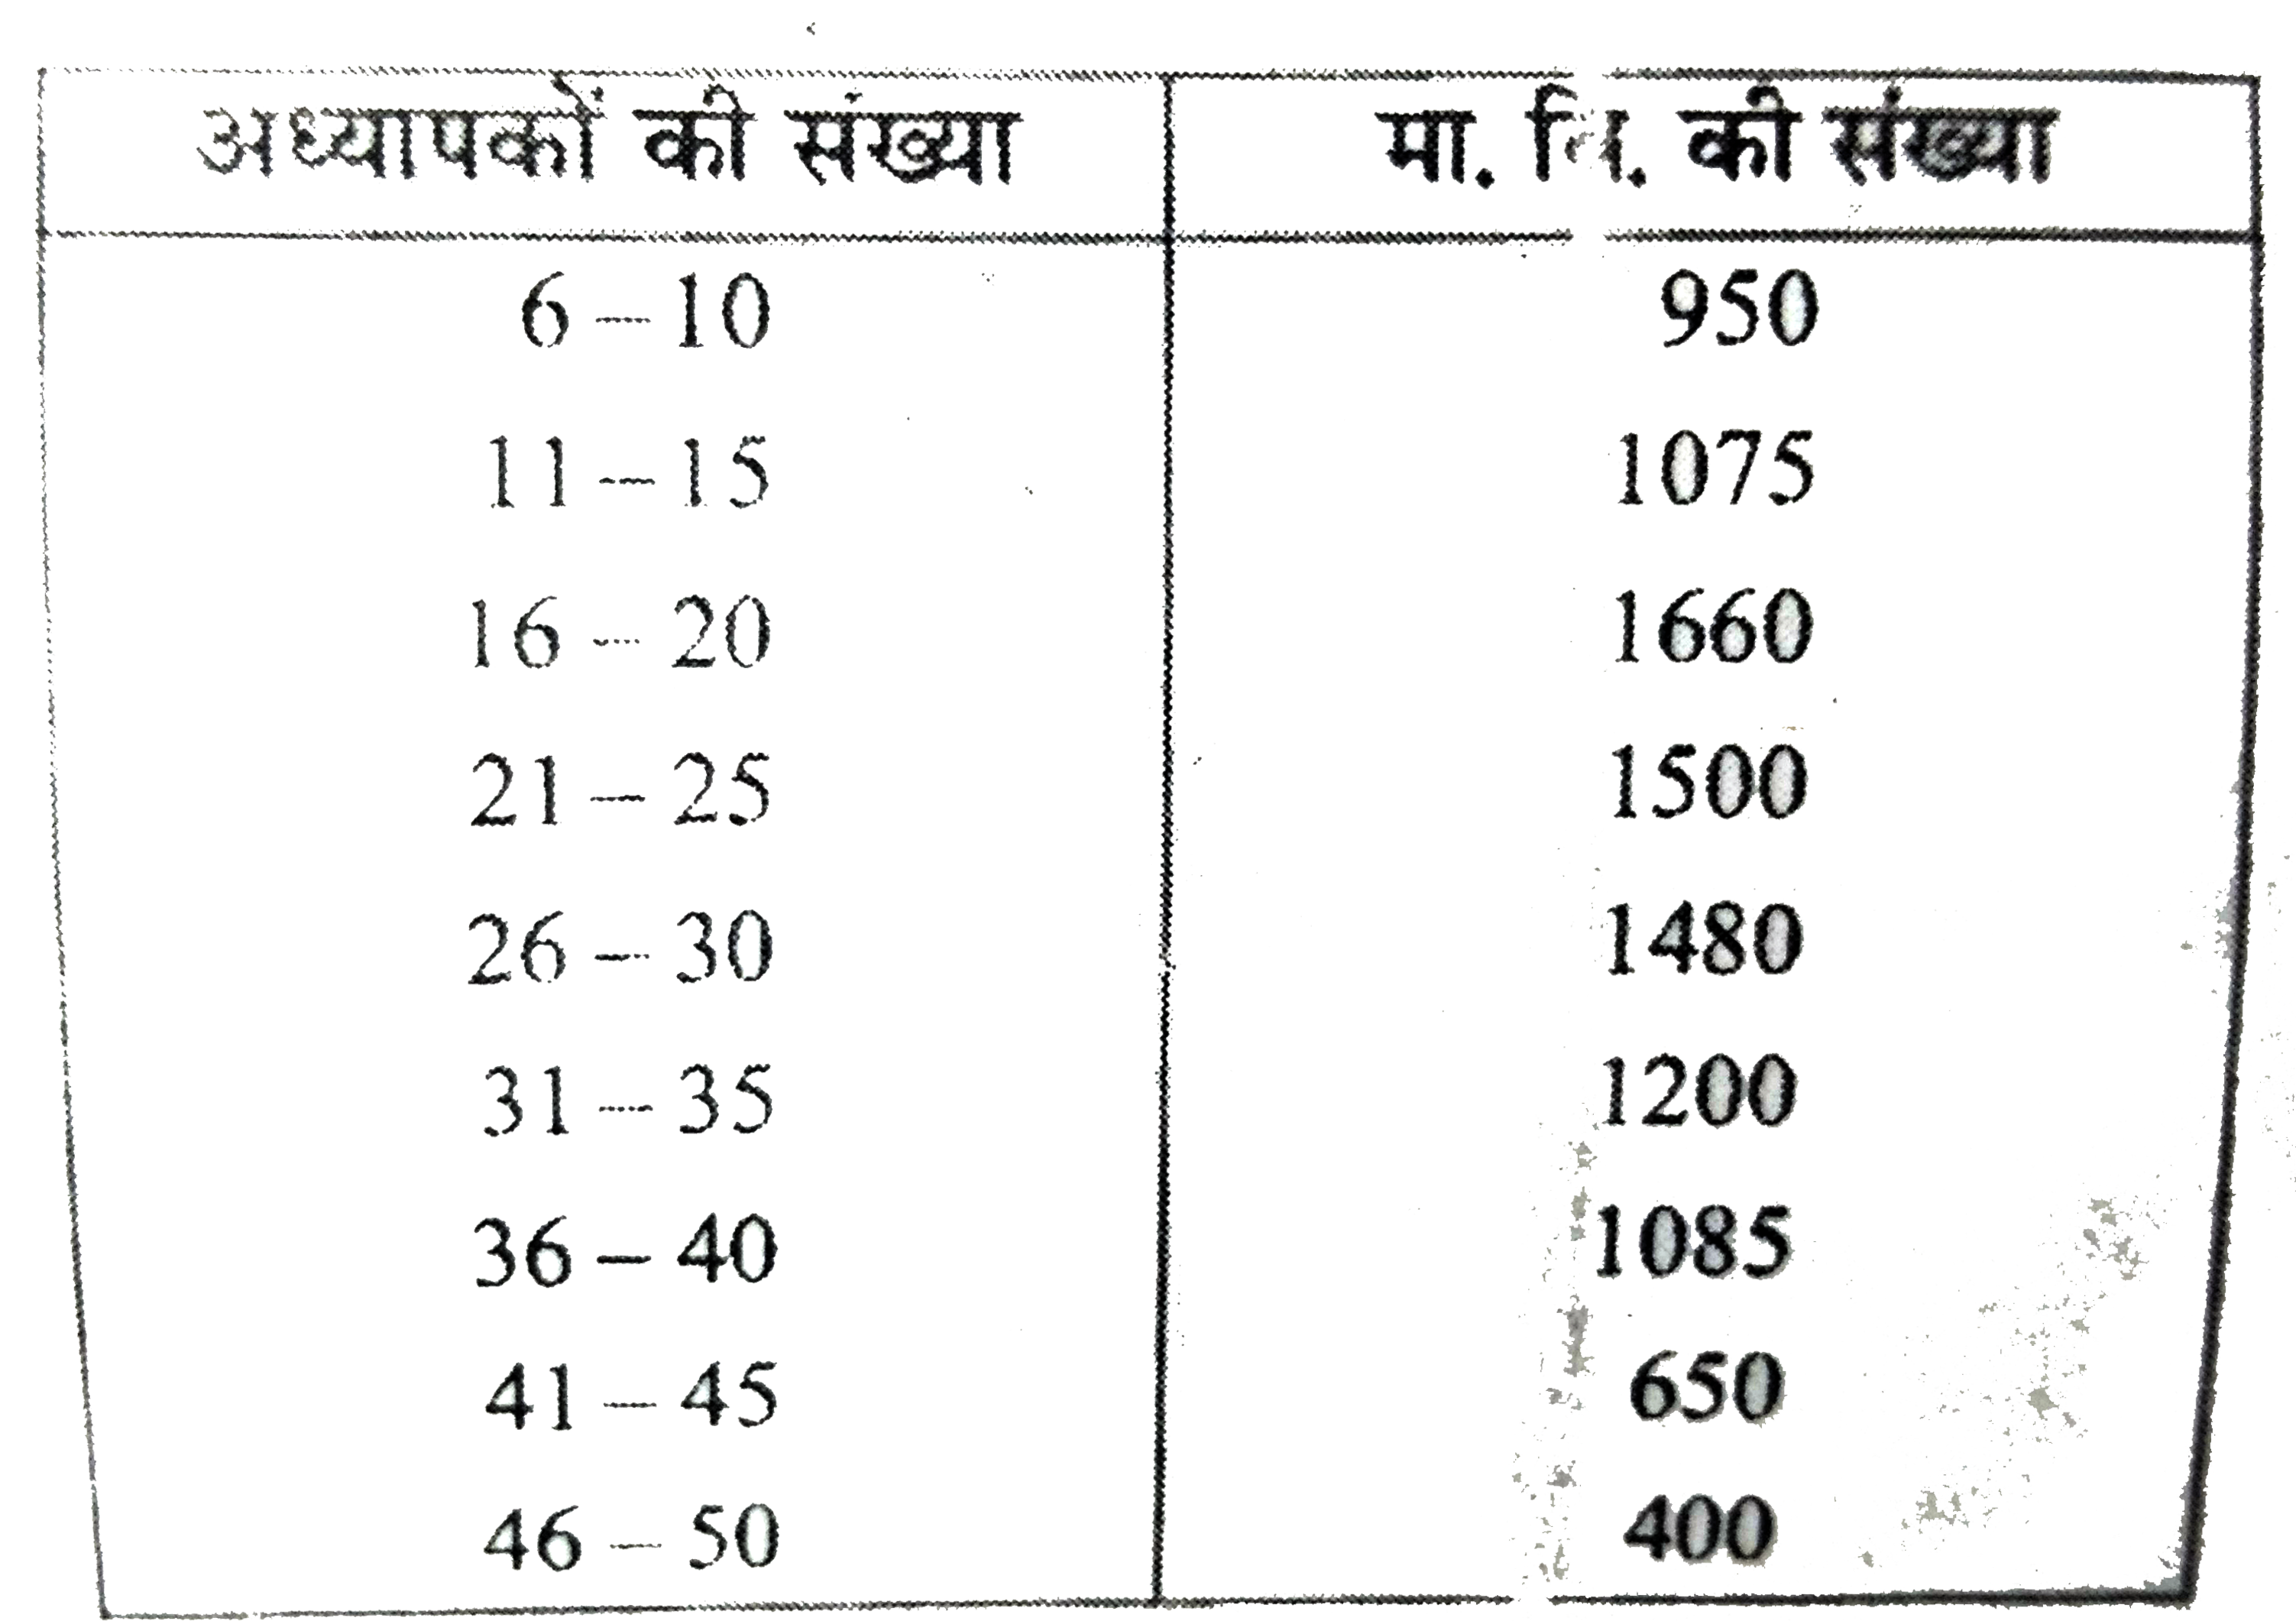
निम्नलिखित सारणी में किसी वर्ष की माध्यमिक विद्यालयों के अध्यापकों की संख्या का बारम्बारता बंटन दिया गया है। उस वर्ष की प्रतिमाध्यमिक विद्यालय में अध्यापकों की औसत संख्या ज्ञात कीजिए ।

The correct Answer is:25.5 लगभग
Step by step video & image solution for निम्नलिखित सारणी में किसी वर्ष की माध्यमिक विद्यालयों के अध्यापकों की संख्या का बारम्बारता बंटन दिया गया है। उस वर्ष की प्रतिमाध्यमिक विद्यालय में अध्यापकों की औसत संख्या ज्ञात कीजिए । by Maths experts to help you in doubts & scoring excellent marks in Class 10 exams.
Updated on:21/07/2023Topper's Solved these Questions
- सांखियकीBOOK - MANOHAR RAYCHAPTER - सांखियकीEXERCISE - प्रश्नावली 14(C)
14 Videos
- सांखियकीBOOK - MANOHAR RAYCHAPTER - सांखियकीEXERCISE - प्रश्नावली 14(D)
7 Videos
- सांखियकीBOOK - MANOHAR RAYCHAPTER - सांखियकीEXERCISE - प्रश्नावली 14(A)
18 Videos
- समांतर श्रेणी BOOK - MANOHAR RAYCHAPTER - समांतर श्रेणी EXERCISE - प्रश्नावली 5(E)
18 Videos
Similar Questions
निम्नलिखित बारम्बारता बंटन किसी मोहल्ले के 68 उपभोक्ताओं की बिजली की मासिक खपत दर्शाता है ।

इन आँकड़ों के माधयक तथा माध्य ज्ञात कीजिए ।
View Solutionनिम्नलिखित सारणी किसी अस्पताल में एक विशेष वर्ष में भर्ती हुए रोगियों की आयु को दर्शाती हैं :

उपरोक्त आँकड़ों से बहुलक ज्ञात कीजिए।
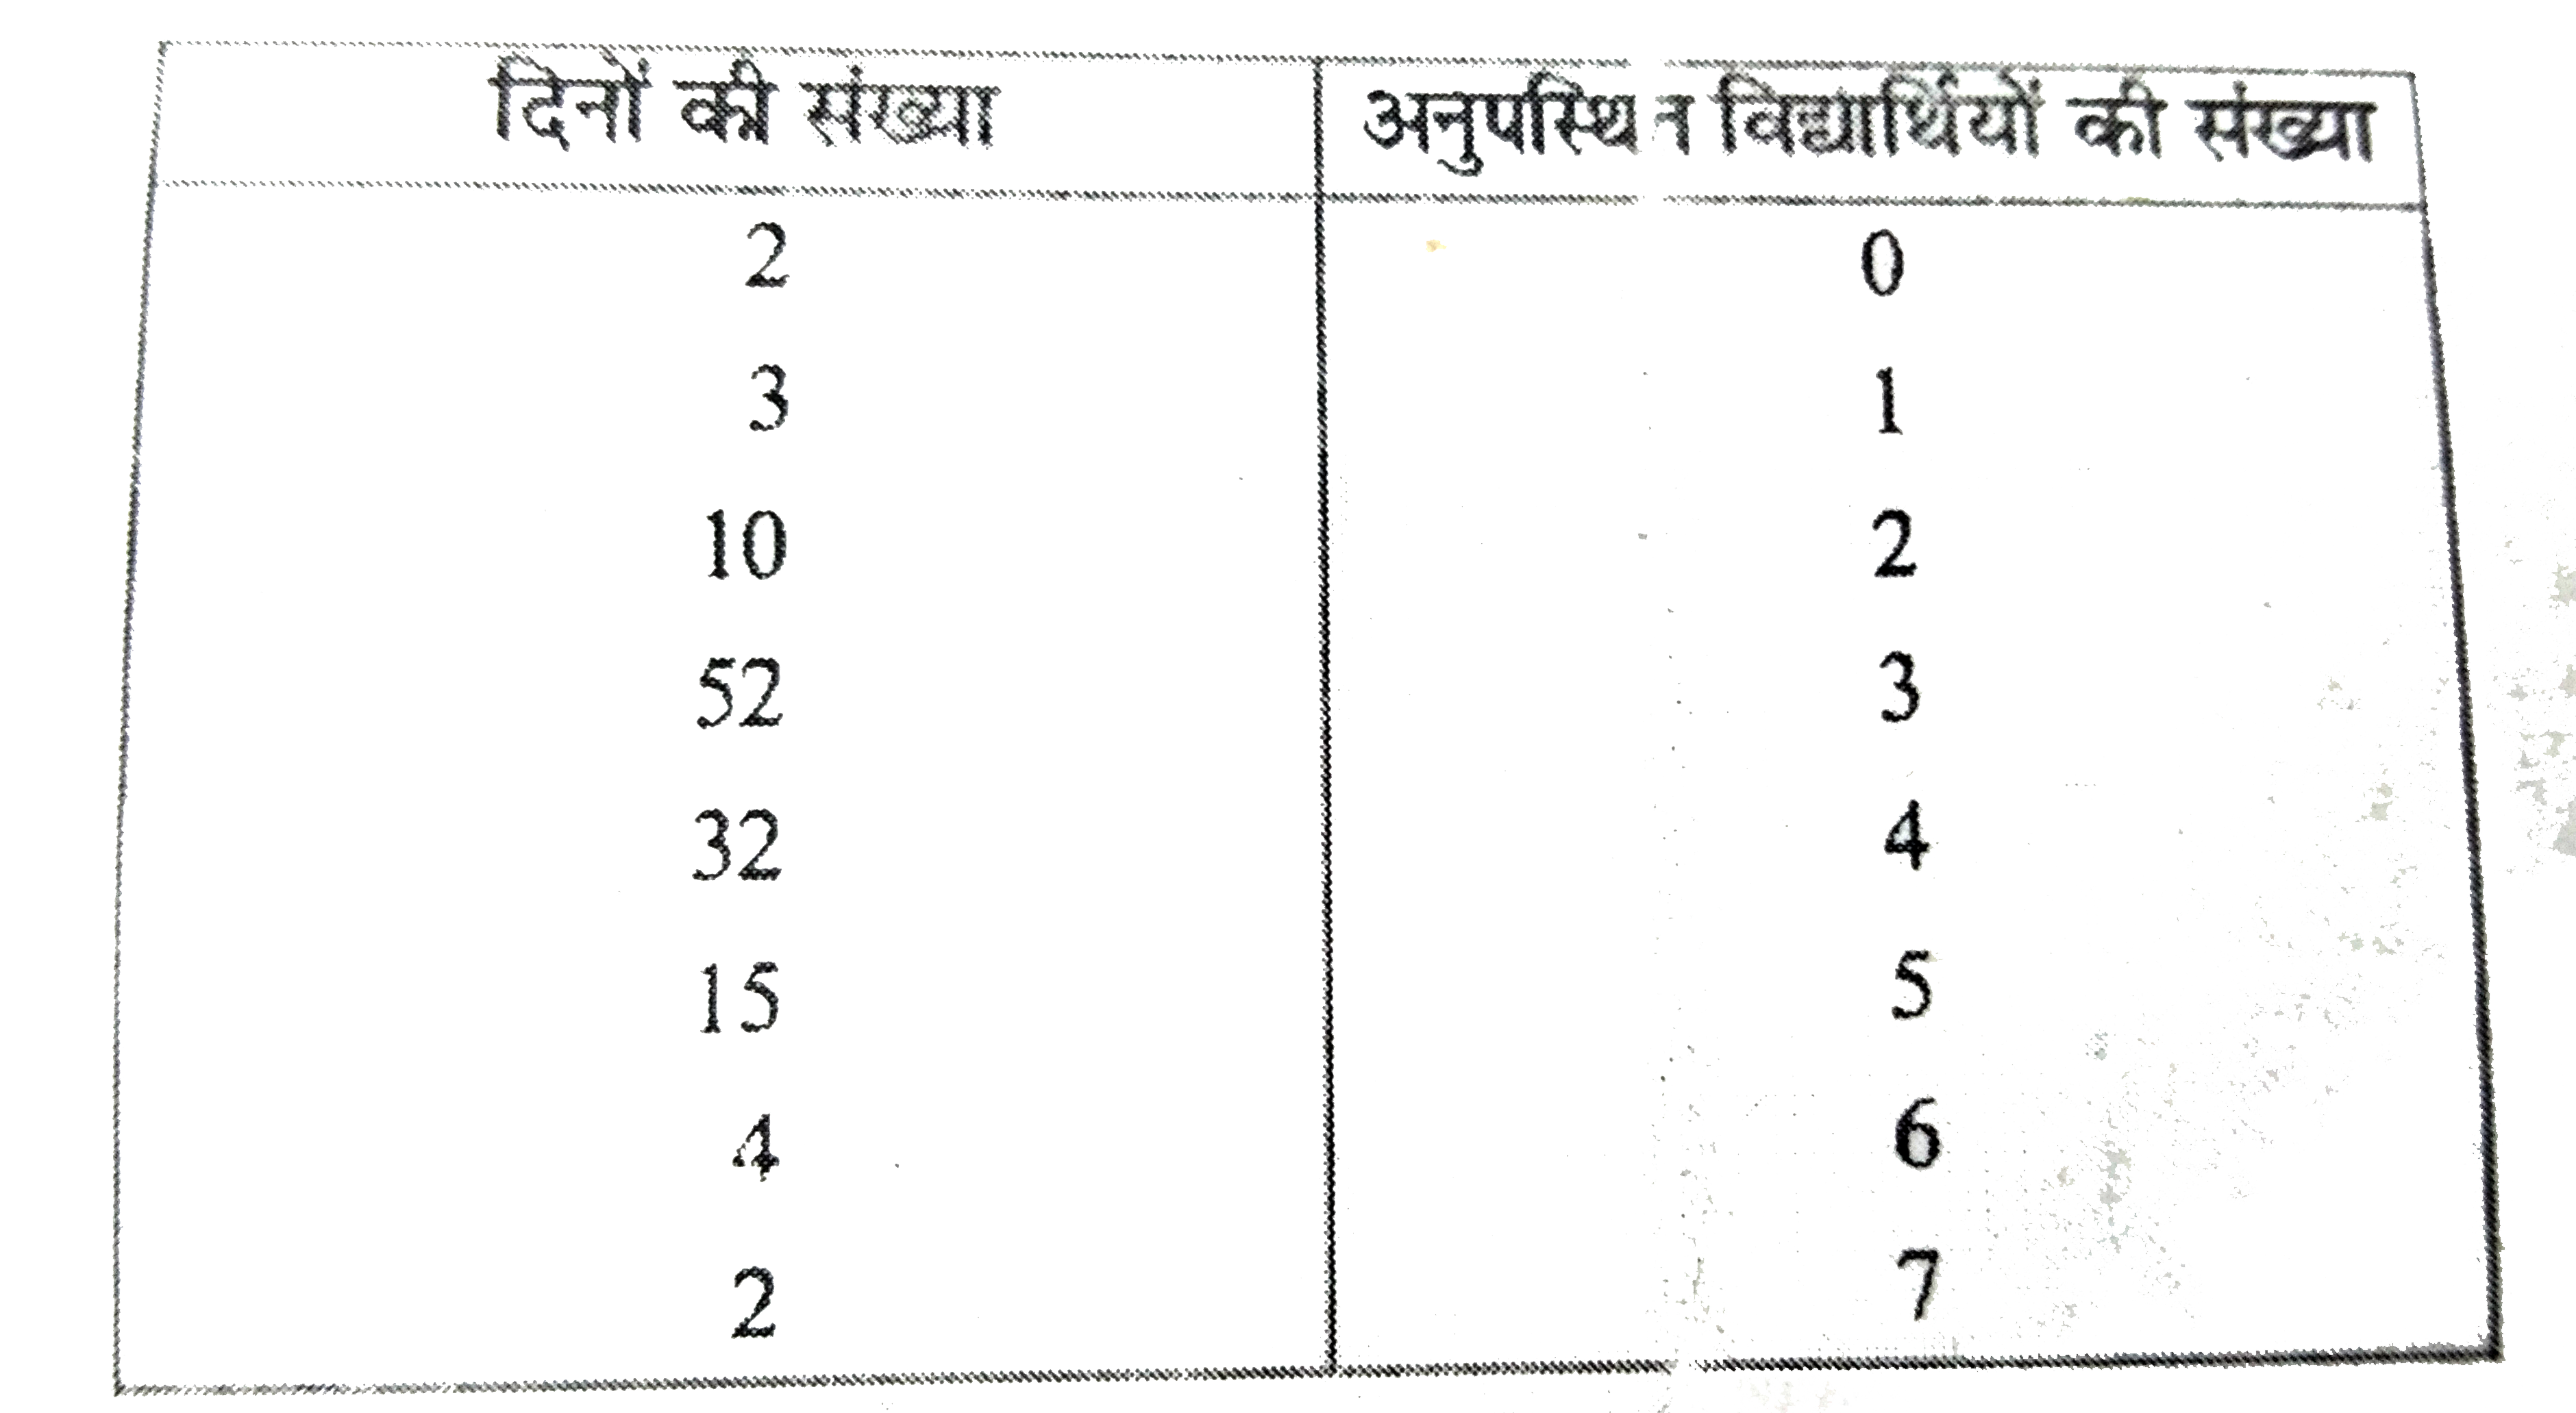
View Solutionकिसी कक्षा में 120 दिनों की अवधि में अनुपस्थित विद्यार्थियों की संख्या निम्नलिखित सारणी में दी है है :

प्रतिदिन अनुपस्थित विद्यार्थियों की औसत संख्या ज्ञात कीजिए ।
View Solutionकिसी स. श्रे. में, यदि d--4, n=7 और an=4 है, तो a का मान है :
View SolutionDetermine the point of symmetry of a regular hexagon.
View SolutionMatch the following Column A to Column B

View SolutionIn a school, 38 of the number of students are girls and the rest are boys, One -third of the number of boys are below 10 years and 23 of the number of girls are also below 10 years. If the number of students of age 10 Or more years is 260, then the number of boys in the school is:
किसी विद्यालय में छात्रों की संख्या का 38 भाग लड़कियाँ और शेष लड़के है| लड़को की संख्या का एक तिहाई 10 वर्ष से कम है और लड़कियों की संख्या का 23भी 10 वर्ष से कम है| यदि 10 वर्ष या उससे अधिक आयु वाले छात्रों की संख्या 260 है, तो विद्यालय में लड़को की संख्या ज्ञात कीजिए |
View SolutionThe given Bar Graph presents the number of students of two schools for six years. दिया गया दंड आरेख छः वर्ष की अवधि में दो विद्यालयों में छात्रों की संख्या को दर्शाता है | In which year, the absolute difference between the numbers of students in two schools is the highest? किस वर्ष में, दोनों विद्यालयों में छात्रों की संख्या के बीच पूर्ण अंतर सबसे अधिक है ?
View SolutionThe given Bar Graph presents the number of students of two schools for six years. दिया गया दंड आरेख छः वर्ष की अवधि में दो विद्यालयों में छात्रों की संख्या को दर्शाता है | What is the average number of students from school B during the six year period (correct to two decimal places)? छः वर्षों की अवधि में विद्यालय B के छात्रों की औसत संख्या कितनी रही है? (दशमलव के दो स्थान तक )
View SolutionThe given Bar Graph presents the number of students of two schools for six years. दिया गया दंड आरेख छः वर्ष की अवधि में दो विद्यालयों में छात्रों की संख्या को दर्शाता है | In which year, the percentage increase in students in school B is the highest in comparison to its previous year? किस वर्ष में, विद्यालय B में छात्रों की संख्या में प्रतिशत वृद्धि इसके पिछले वर्ष की तुलना में सबसे अधिक रही है?
View SolutionThe given Bar Graph presents the number of students of two schools for six years. दिया गया दंड आरेख छः वर्ष की अवधि में दो विद्यालयों में छात्रों की संख्या को दर्शाता है | What is the average of the number of students from school A during the six year period? छः वर्षों की अवधि में विद्यालय A के छात्रों की संख्या का औसत ज्ञात करें |
View SolutionThe given Bar Graph presents the number of students of two schools for six years. दिया गया दंड आरेख छः वर्ष की अवधि में दो विद्यालयों में छात्रों की संख्या को दर्शाता है | In which year, the percentage increase of students in school A is the highest in comparison to its previous year? किस वर्ष, विद्यालय A में छात्रों की संख्या में प्रतिशत वृद्धि पिछले वर्ष की तुलना में सर्वाधिक है ?
View SolutionThe given Bar Graph presents the number of students of two schools for six years. दिया गया दंड आरेख छः वर्ष की अवधि में दो विद्यालयों में छात्रों की संख्या को दर्शाता है | What is the ratio of the number of students taken for all years together from school A to that from school B? सभी वर्षों को मिलाकर विद्यालय A और विद्यालय B के छात्रों की संख्या में अनुपात ज्ञात करें |
View SolutionThe given Bar Graph presents the number of students of two schools for six years. दिया गया दंड आरेख छः वर्ष की अवधि में दो विद्यालयों में छात्रों की संख्या को दर्शाता है | What is the ratio of the number of students taken together for the years 2008, 2012 and 2013 in School A to the number of students taken together for the years 2008, 2012 and 2013 in school B? विद्यालय A में 2008, 2012 तथा 2013 को मिलाकर छात्रों की संख्या का विद्यालय B में 2008, 2012 तथा 2013 को मिलाकर होने वाले छात्रों की संख्या के साथ अनुपात ज्ञात करें |
View SolutionThe given Bar Graph presents the number of students of two schools for six years. दिया गया दंड आरेख छः वर्ष की अवधि में दो विद्यालयों में छात्रों की संख्या को दर्शाता है | In which year the percentage increase in the number of total students in schools A and B taken together is the highest in comparison to its previous year? किस वर्ष विद्यालय A और B को मिलाकर कुल छात्रों की संख्या में प्रतिशत वृद्धि पिछले वर्ष की तुलना में सर्वाधिक है ?
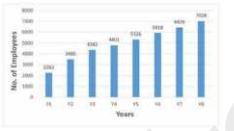
View SolutionThe Bar graph shown below presents the number of employees in an office during eight consecutive years.
नीचे दिया गया दंड आरेख किसी कार्यालय में आठ लगातार वर्षों के दौरान कर्मचारियों की संख्या को दर्शाता है |
The number of employees in year Y2 is how much percent less than the average number of employees per year?
वर्ष Y2 में कर्मचारियों की संख्या प्रति वर्ष कर्मचारियों की औसत संख्या से कितना प्रतिशत कम है ?
View Solution
