दो वर्ष की द्वितीयक्र वृद्धि के पश्चात् द्वियोजपत्री जड़ में वल्कुट
पूर्ववत् रहता है
पूर्णतया उतर जाता है
पूर्णतया नहीं उतरता है
इनमें से कोई नहीं
The correct Answer is:B
Step by step video, text & image solution for दो वर्ष की द्वितीयक्र वृद्धि के पश्चात् द्वियोजपत्री जड़ में वल्कुट by Biology experts to help you in doubts & scoring excellent marks in Class 11 exams.
Updated on:21/07/2023Topper's Solved these Questions
- जड़ तने तथा पत्ती की शारीरिक (आन्तरिक संरचना तथा द्वितीयक वृद्धि)BOOK - NOOTAN HINDICHAPTER - जड़ तने तथा पत्ती की शारीरिक (आन्तरिक संरचना तथा द्वितीयक वृद्धि)EXERCISE - व्रिस्तित उतरिये प्रश्न(Long Answer Questions)
8 Videos
- जैविक अणु BOOK - NOOTAN HINDICHAPTER - जैविक अणु EXERCISE - बहुविकल्पीय प्रश्न
170 Videos
- तान्त्रिकीय नियंत्रण एवं समन्वयन BOOK - NOOTAN HINDICHAPTER - तान्त्रिकीय नियंत्रण एवं समन्वयन EXERCISE - बहुविकल्पीय
136 Videos
Similar Questions
एक द्विबीजपत्री तने की अनुप्रस्थ काट का कोशिकीय एवं नामांकित चित्र बनाइए। यह किन चार बातों में एकबीजपत्री तने की आन्तरिक संरचना से भिन्न है?
View Solutionवह पदार्थ जो कोशिकाओं के कोशिकाद्रव्य का 80% से अधिक भाग बनाता है:
View Solutionतन्त्रिकीय-पेशीय सिनेप्स किनके बीच में होता है?
View Solutionयदि 10 संख्याओं के आंकड़ों को आरोही क्रम में रखा जाए और 7वें प्रेक्षेण में 4 की वृद्धि का जाए तो बताइए कि माध्यिका में कितनी वृद्धि होगी?
View Solutionसजीवों के शरीर में वृद्धि आंतरिक वृद्धि के कारण होता है। ( )
View SolutionSalary of A increased by 8% in the year 2015 as compared to 2014 and decreased by 6% in the year 2016 as compared to 2015. If his salary was Rs.2,34,778 in 2016, his salary (round off to nearest whole number) in 2014 was :
A के वेतन में वर्ष 2014 के मुकाबले वर्ष 2015 में 8% की वृद्धि हुई और 2015 के मुकाबले वर्ष 2016 में 6% की कमी हुई | यदि वर्ष 2016 में उसका वेतन रु 2, 34, 778 था तो 2014 में उसका वेतन (निकटतम संपूर्ण संख्या में पूर्णाकित) कितना था?
View SolutionThe given Bar Graph presents the number of students of two schools for six years. दिया गया दंड आरेख छः वर्ष की अवधि में दो विद्यालयों में छात्रों की संख्या को दर्शाता है | What is the average number of students from school B during the six year period (correct to two decimal places)? छः वर्षों की अवधि में विद्यालय B के छात्रों की औसत संख्या कितनी रही है? (दशमलव के दो स्थान तक )
View SolutionThe given Bar Graph presents the number of students of two schools for six years. दिया गया दंड आरेख छः वर्ष की अवधि में दो विद्यालयों में छात्रों की संख्या को दर्शाता है | In which year, the percentage increase in students in school B is the highest in comparison to its previous year? किस वर्ष में, विद्यालय B में छात्रों की संख्या में प्रतिशत वृद्धि इसके पिछले वर्ष की तुलना में सबसे अधिक रही है?
View SolutionThe given Bar Graph presents the number of students of two schools for six years. दिया गया दंड आरेख छः वर्ष की अवधि में दो विद्यालयों में छात्रों की संख्या को दर्शाता है | In which year, the percentage increase of students in school A is the highest in comparison to its previous year? किस वर्ष, विद्यालय A में छात्रों की संख्या में प्रतिशत वृद्धि पिछले वर्ष की तुलना में सर्वाधिक है ?
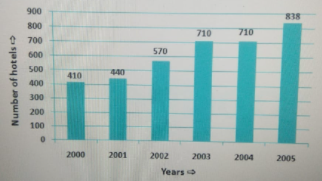
View SolutionStudy the chart and answer the questions:
In which of the given years is the percentage increase in the number of hotels in comparison to the previous year, is the maximum?
चार्ट का अध्ययन करें और प्रश्नों का उत्तर दें:पिछले वर्ष की तुलना में होटलों की संख्या में किस वर्ष में अधिकतम प्रतिशत वृद्धि हुई है?
View Solutionदोहरान | पैनिसिलिन की खोज |वेक्सिन |मिट्टी के उर्वरता में वृद्धि |सारांश
View SolutionThe given Bar Graph presents the number of students of two schools for six years. दिया गया दंड आरेख (बार ग्राफ) छह वर्षो के दौरान दो स्कूलों में विद्यार्थियों की संख्या को दर्शाता है| In which year, the percentage increase in students in school B is the highest in comparison to its previous year? किस वर्ष में, स्कूल B के विद्यार्थियों की संख्या में प्रतिशत वृद्धि इसके पिछले वर्ष की तुलना में सबसे अधिक है?
View SolutionThe given Bar Graph presents the number of students of two schools for six years. दिया गया दंड आरेख (बार ग्राफ) छह वर्षो के दौरान दो स्कूलों में विद्यार्थियों की संख्या को दर्शाता है| In which year, percentage increase of students in school A is the highest in comparison to its previous year ? किस वर्ष में, स्कूल A की विद्याथियों की संख्या में प्रतिशत वृद्धि इसके पिछले वर्ष की तुलना में सबसे अधिक है?
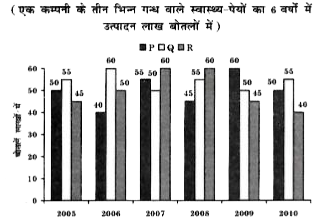
View SolutionIn which of the following years the percentage of rise or fall in production from the previous year is maximum for the flavour of Q ?
निम्न में से किस वर्ष में, पिछले वर्ष की तुलना में गन्ध Q के उत्पादन में वृद्धि या हास अधिकतम रहा है?

View SolutionThe speed of light with the rise in the temperature of the medium.
माध्यम के तापमान में वृद्धि के साथ प्रकाश की गति-
View SolutionThe following figure shows the number of students (in thousands) admitted and passed out per your in a college during years 2000 to 2004, study the figure and answer the questions : : निम्नलिखित आकृति में किसी कॉलेज में वर्ष 2000 से वर्ष 2004 तक प्रति वर्ष भर्ती हुए और उर्तीण हुए छात्रों की संख्या (हजार में) दर्शायी गई है। आकृति का अध्ययन कर प्रश्नों के उत्तर दीजिए : The percent increase in the number of students admitted in the year 2003 over that in 2001 is वर्ष 2001 की तुलना में वर्ष 2003 में भर्ती हुए छात्रों की संख्या में हुई प्रतिशत वृद्धि कितनी है ?
View Solution
