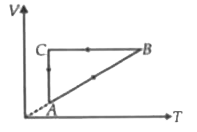
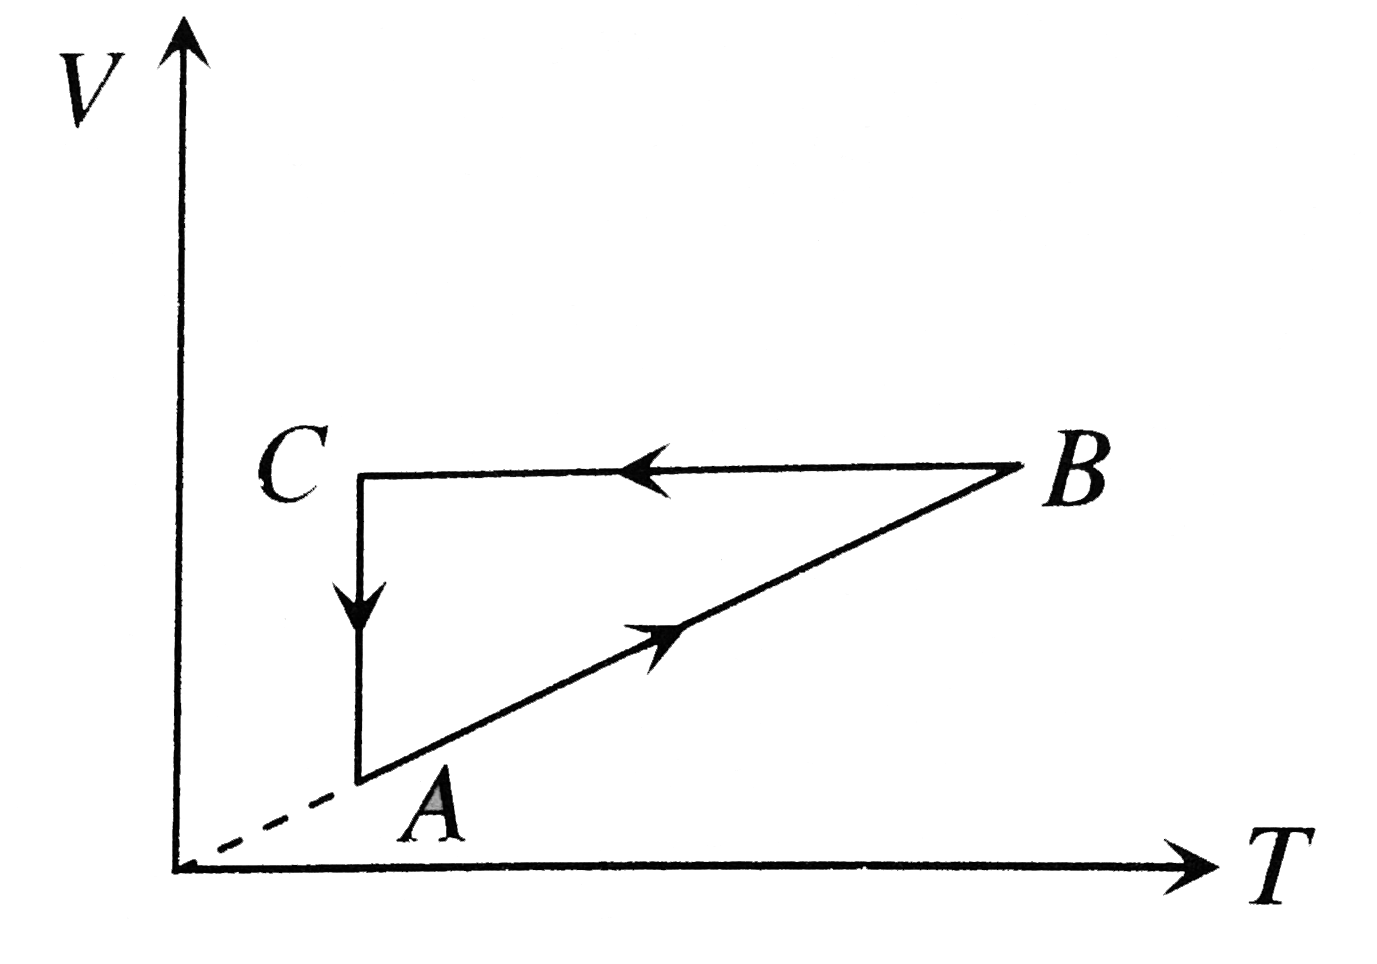
A thermodynamic cycle xyzx is shown on a V-T diagram.
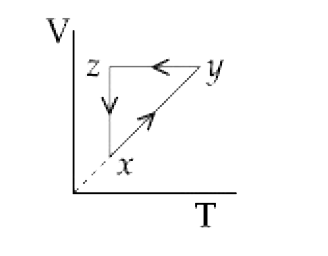
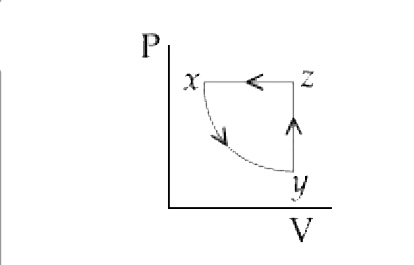
The P-V diagram that best describe this cycle is: (Diagrams are schematic and not to scale).
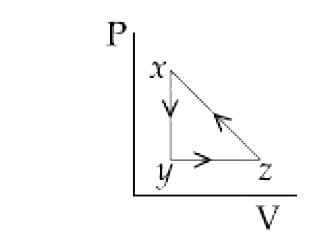
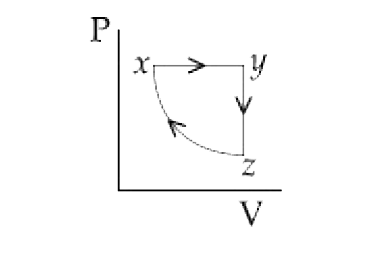
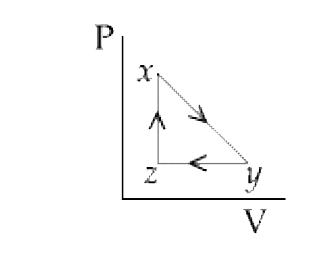
Step by step video & image solution for A thermodynamic cycle xyzx is shown on a V-T diagram. The P-V diagram that best describe this cycle is: (Diagrams are schematic and not to scale). by Physics experts to help you in doubts & scoring excellent marks in Class 12 exams.
Updated on:21/07/2023Topper's Solved these Questions
Similar Questions
Knowledge Check
In P−V diagram shown below,
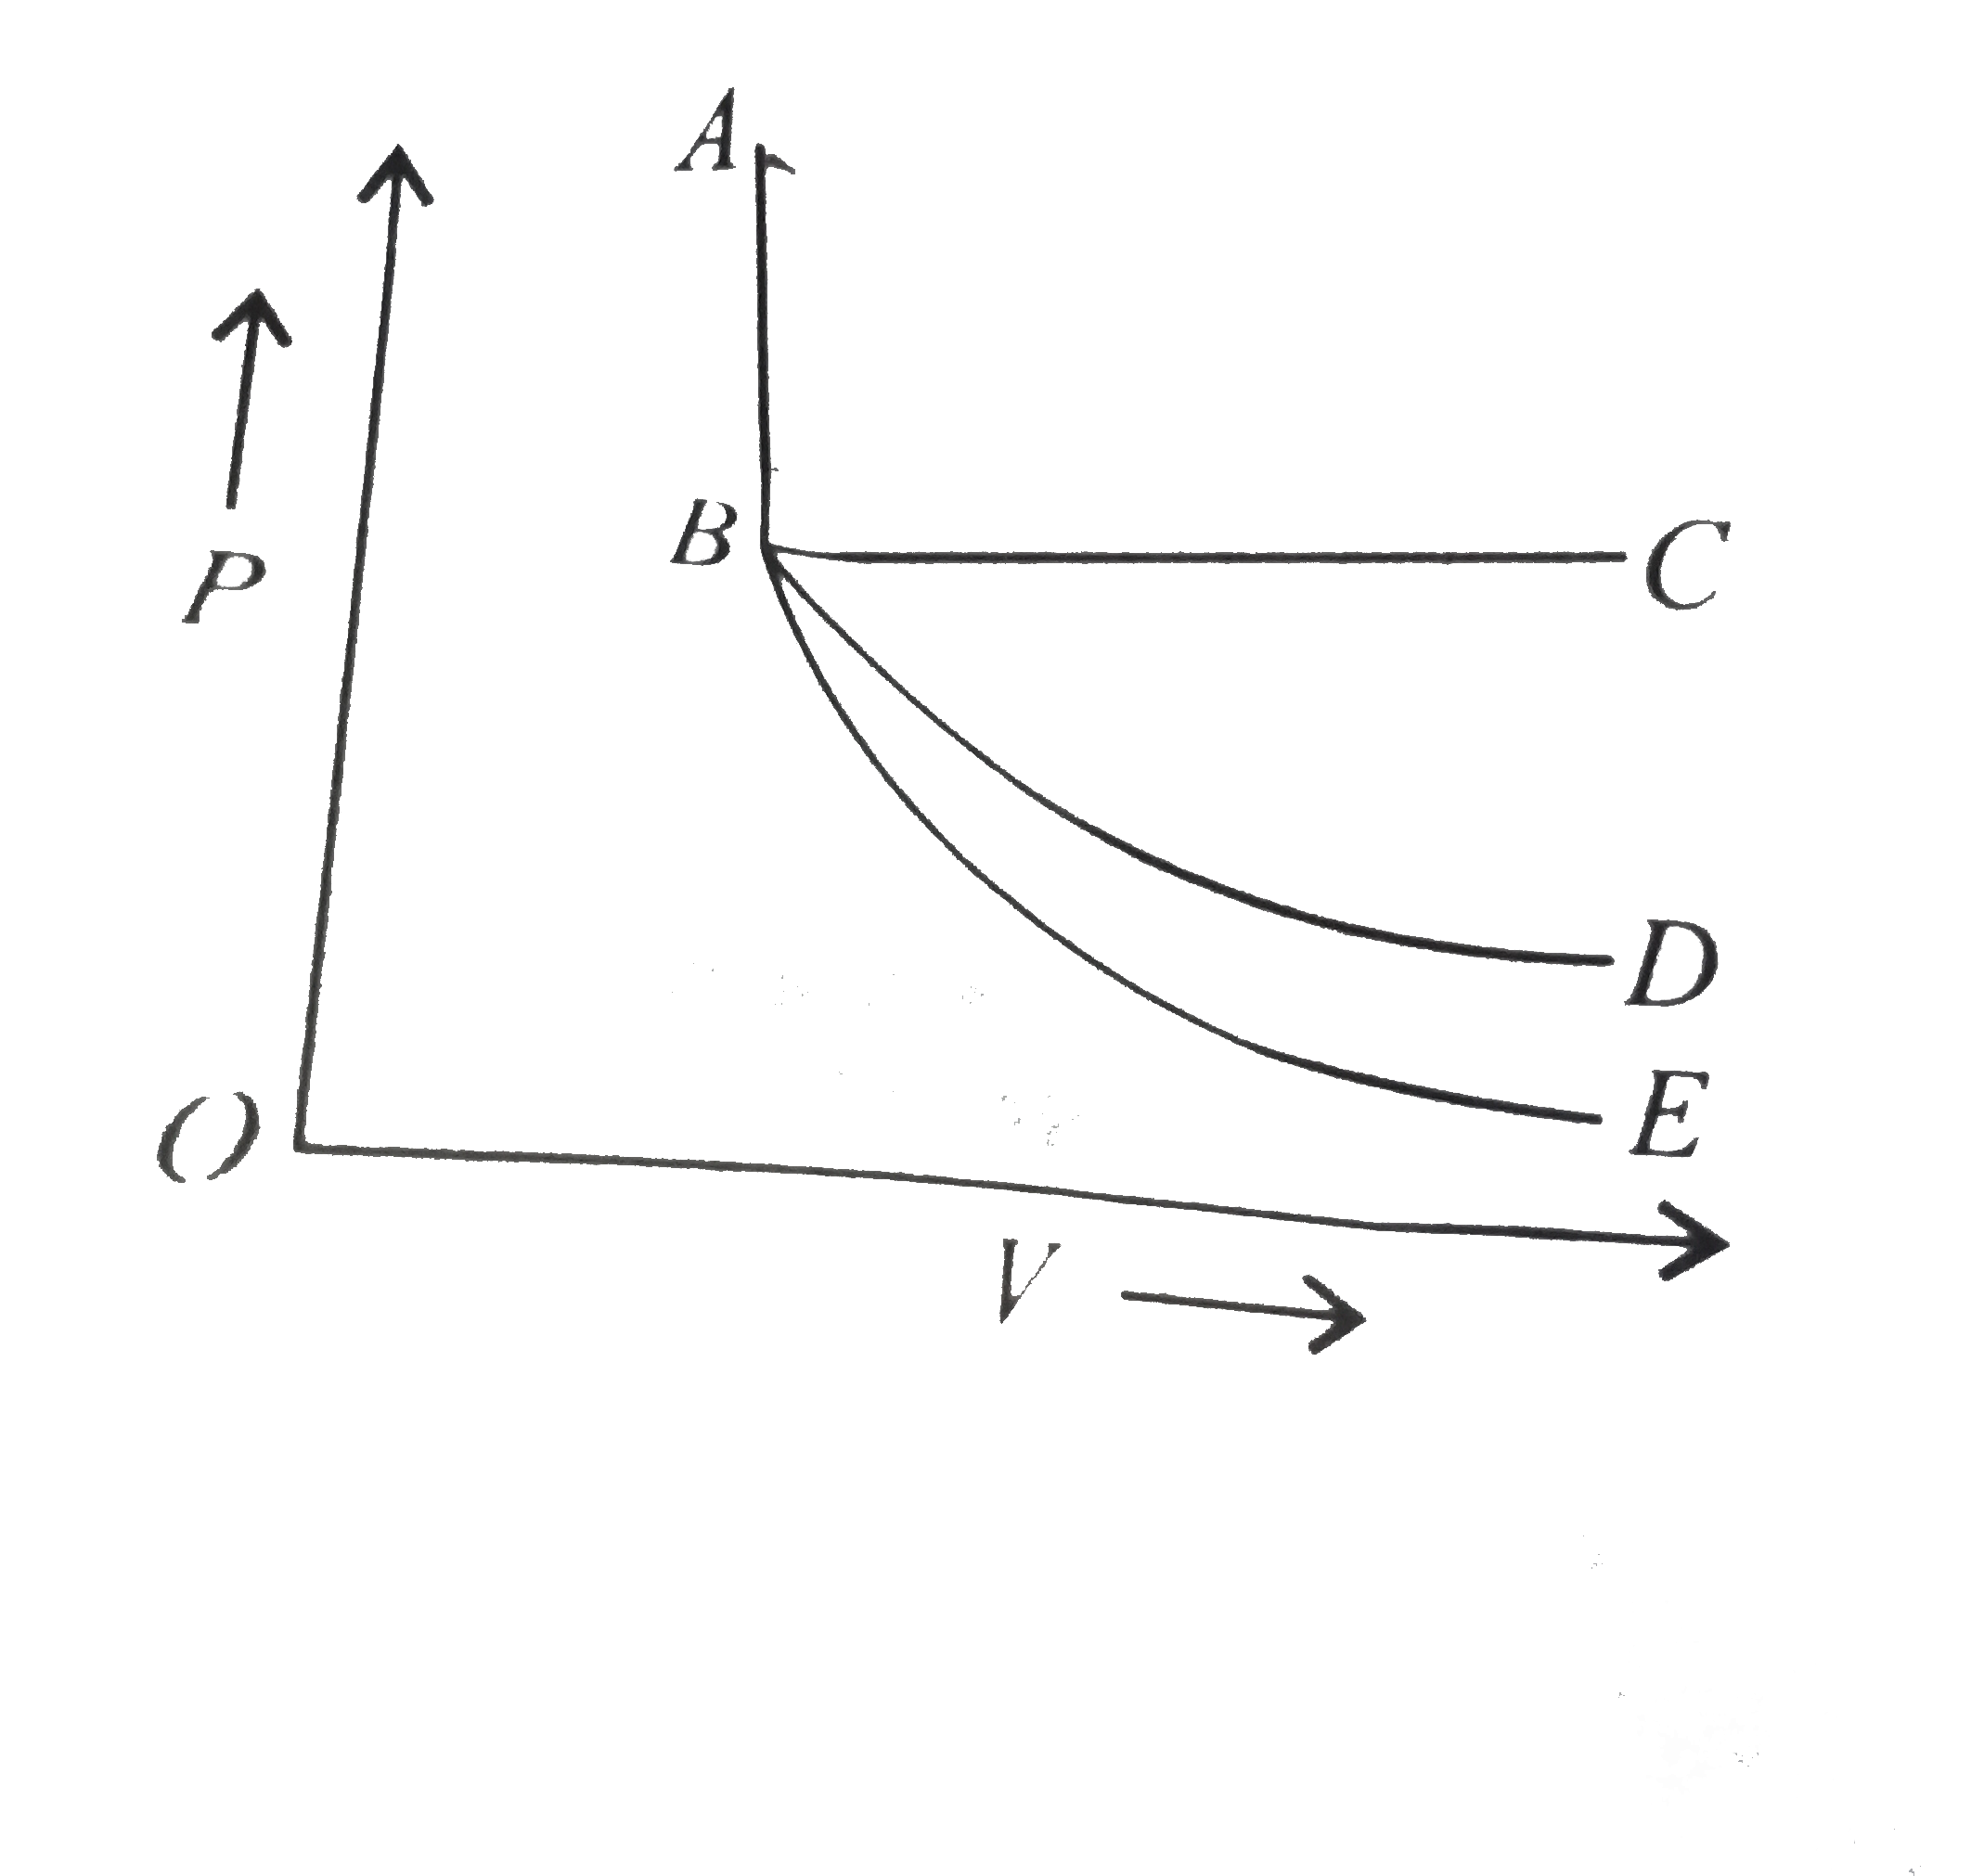 AAB represents adiabatic process.BAB represents isothermal process.CAB represents isobaric process.DAB represents isochoric process.
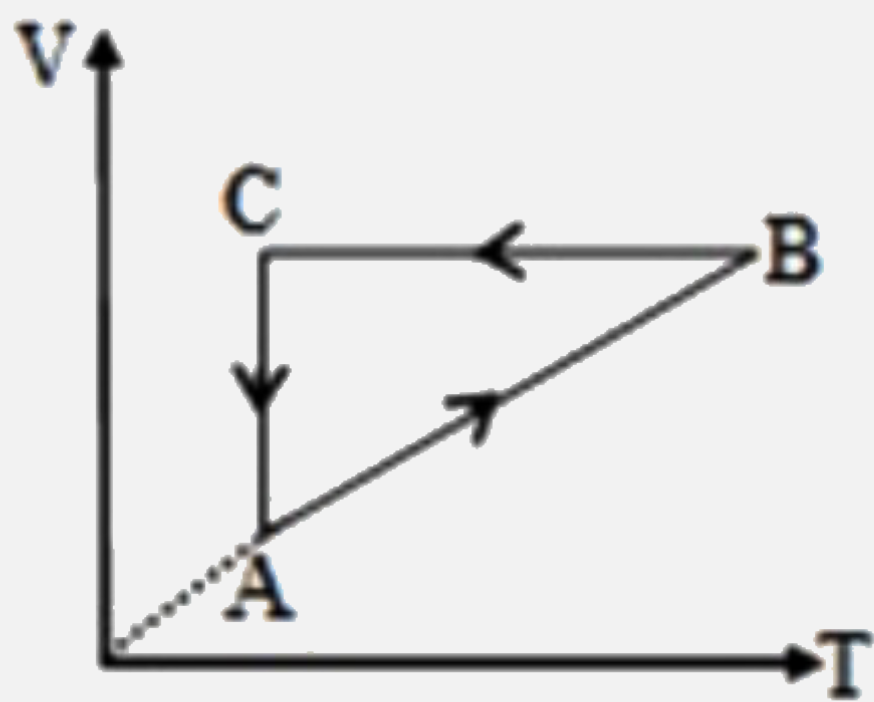
A cyclic process ABCA is shown in the given V-T diagram. Process in the P-V diagram will be
 A
A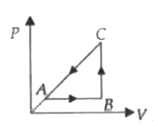 B
B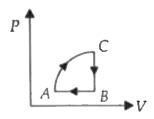 C
C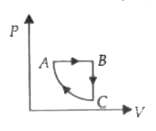 D
D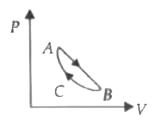
A cyclic process ABCA is shown in the V−T diagram process on the P−V
 A
A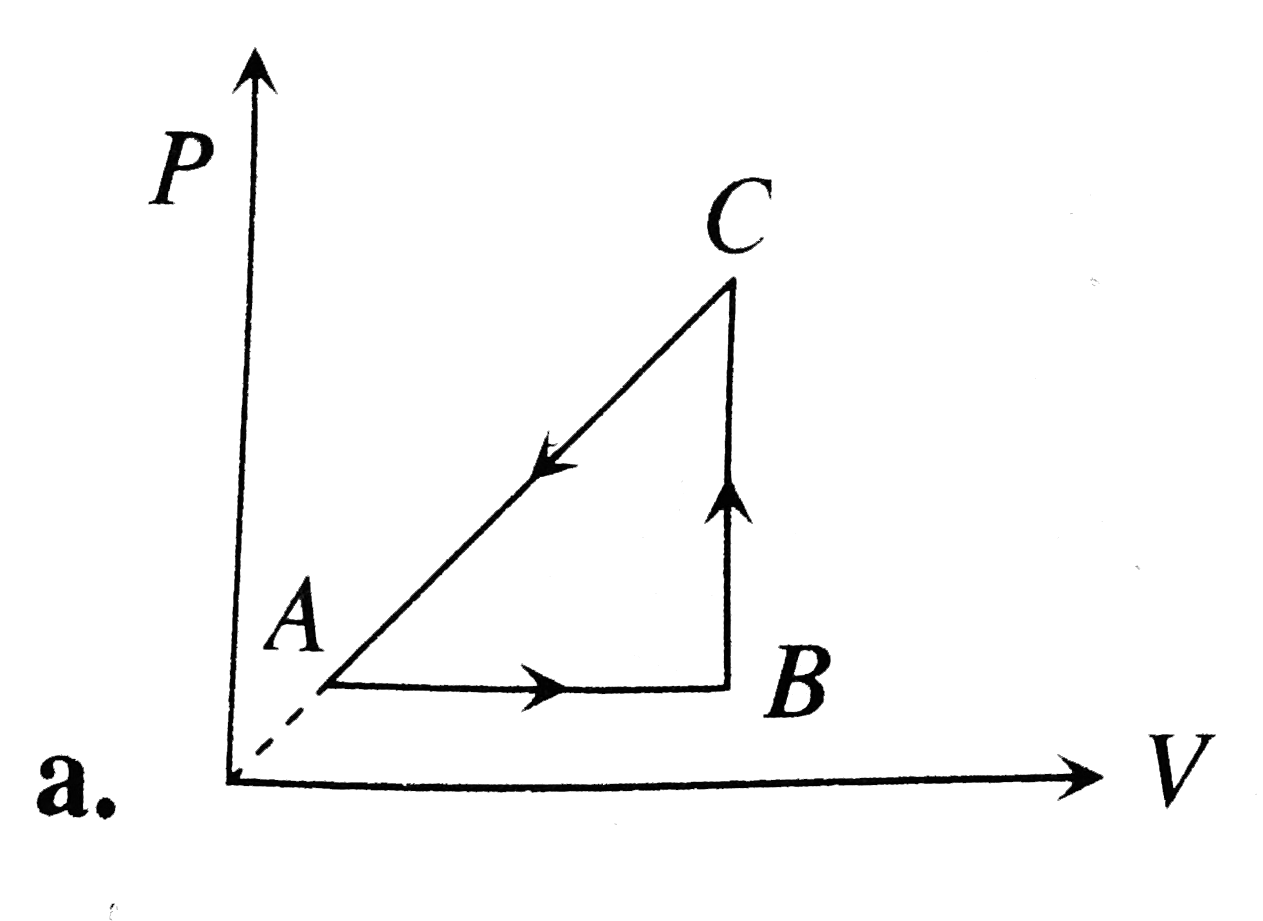 B
B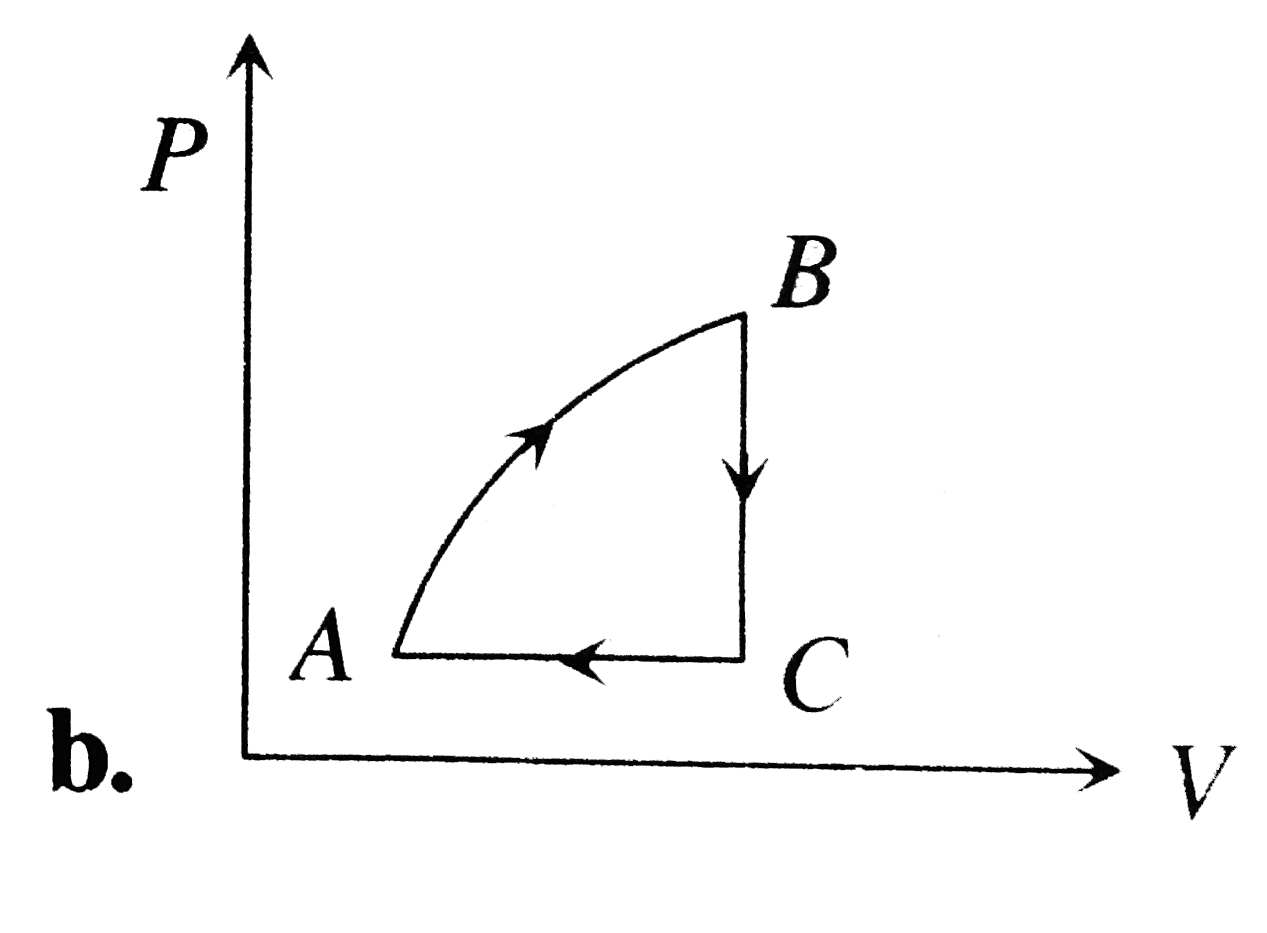 C
C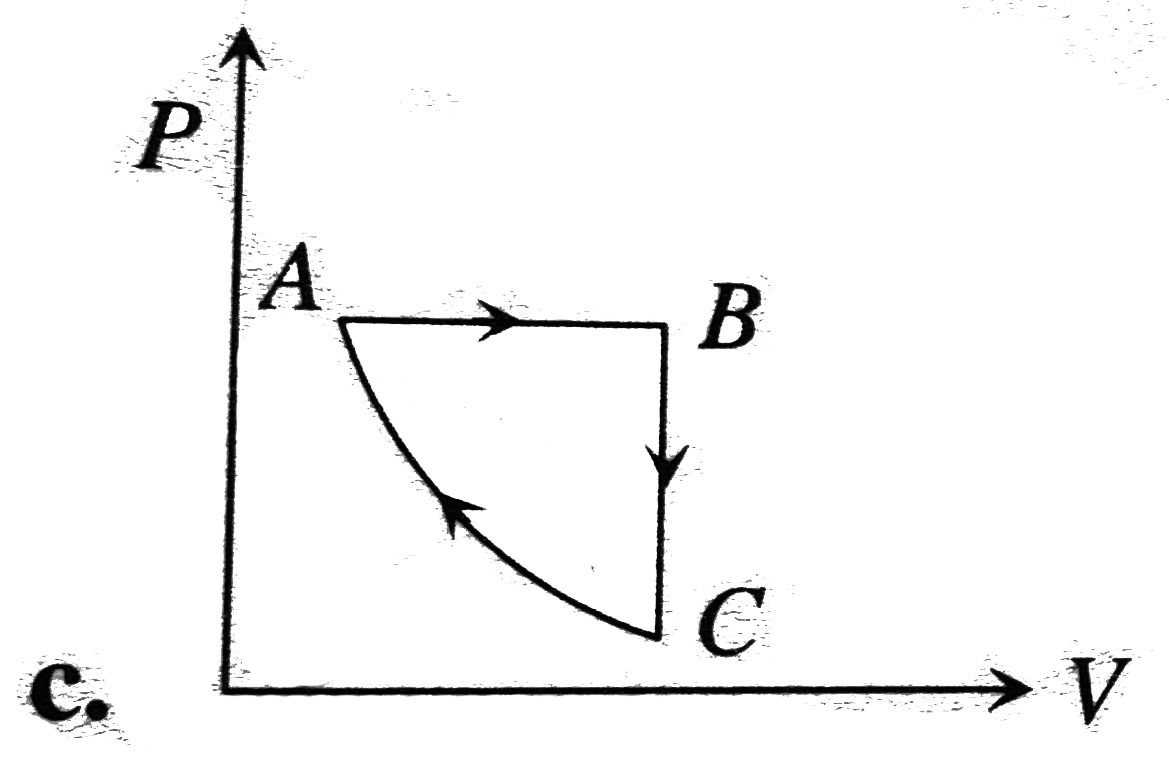 D
D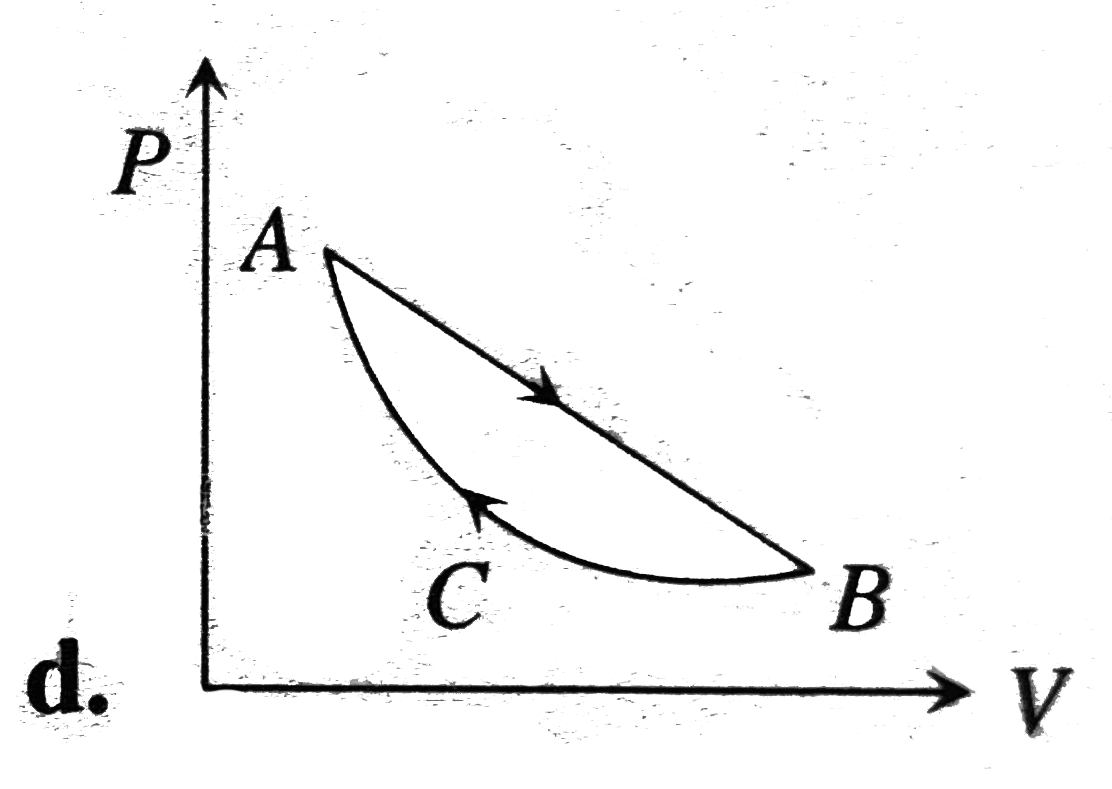
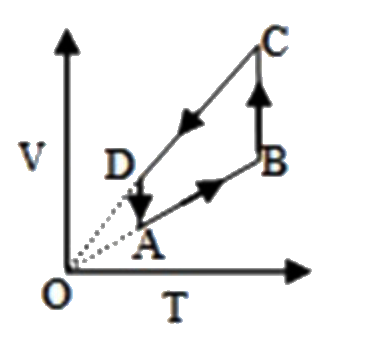
A cyclie process ABCD is shwon in a V−T diagram. The corresponding P−V diagram is

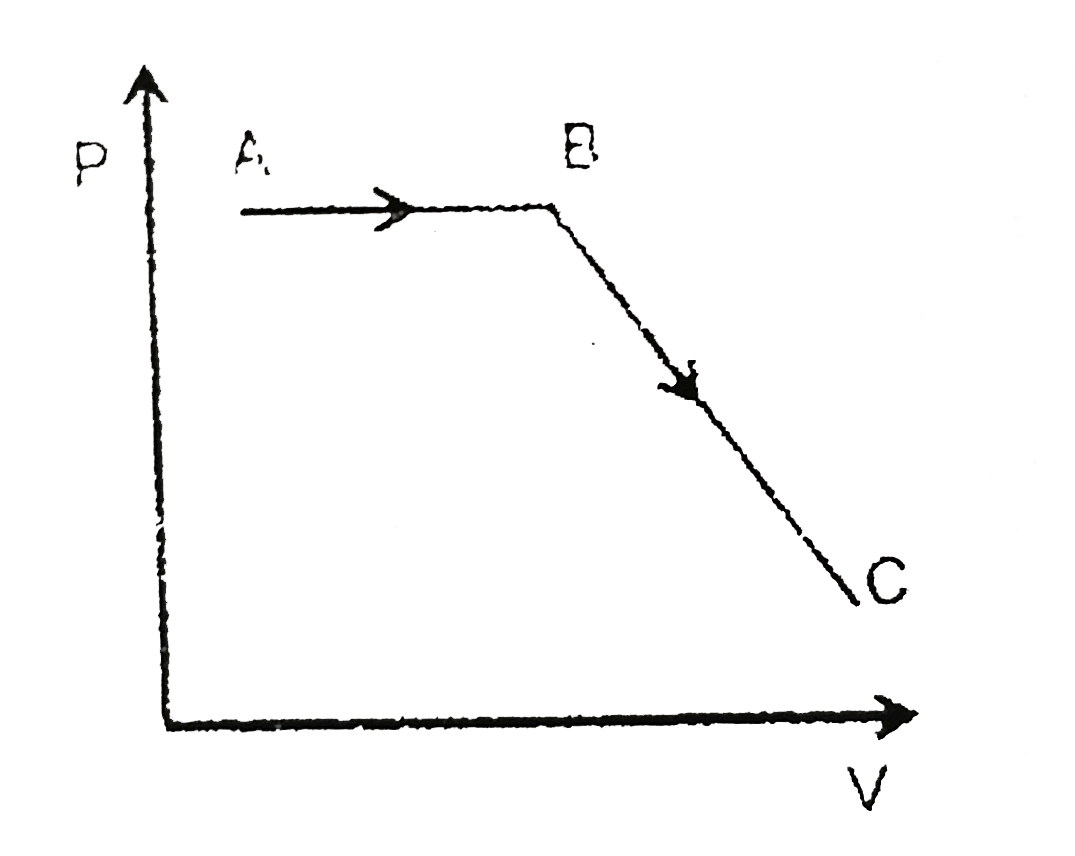
View SolutionA thermodynamic process shown in P−V diagram. Draw this processes on TV-diagram qualitaively.
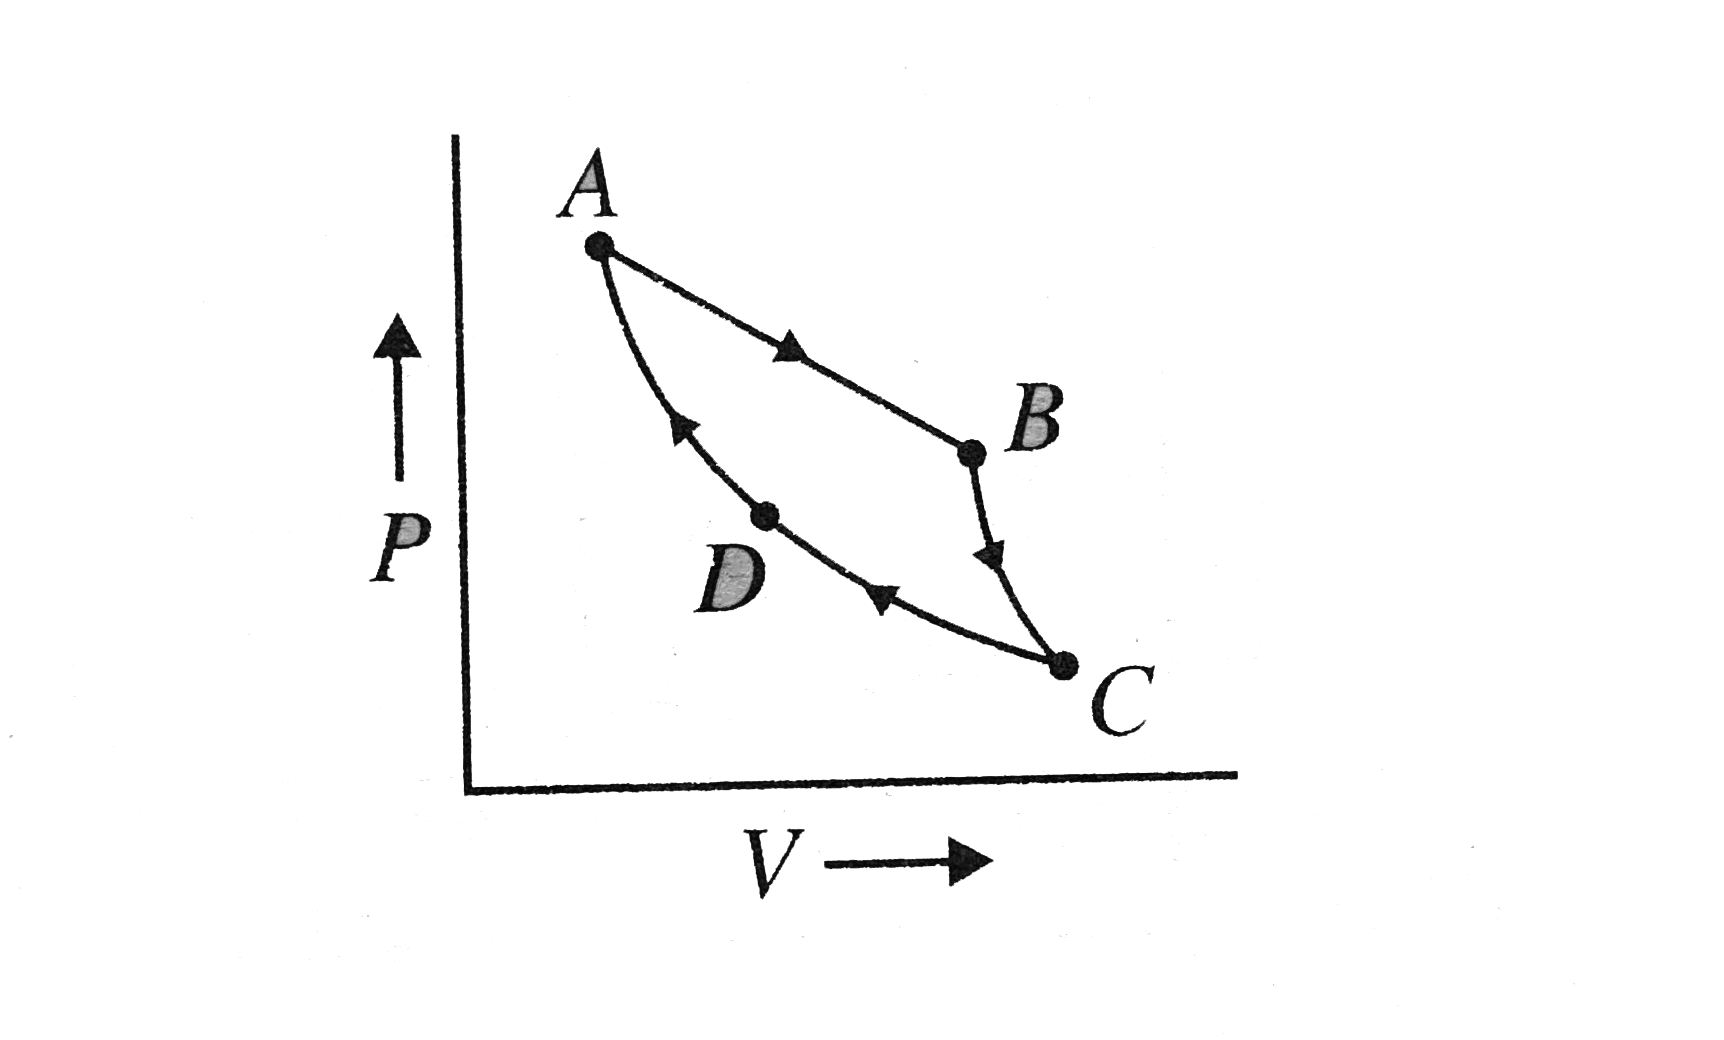
View SolutionFigure. Shows the P−V diagram for a Carnot cycle. In this diagram
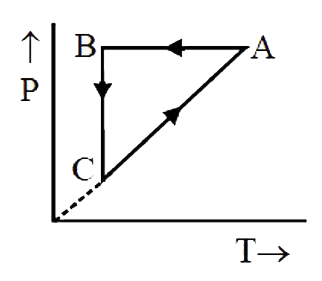
View SolutionA cyclic process ABC A is shown in P - T diagram. What would be its P – V graph:
View SolutionAn ideal gas goes through a reversible cycle a→B→c→d has the V-T diagram shown below. Process d→a and b→c are adiabatic
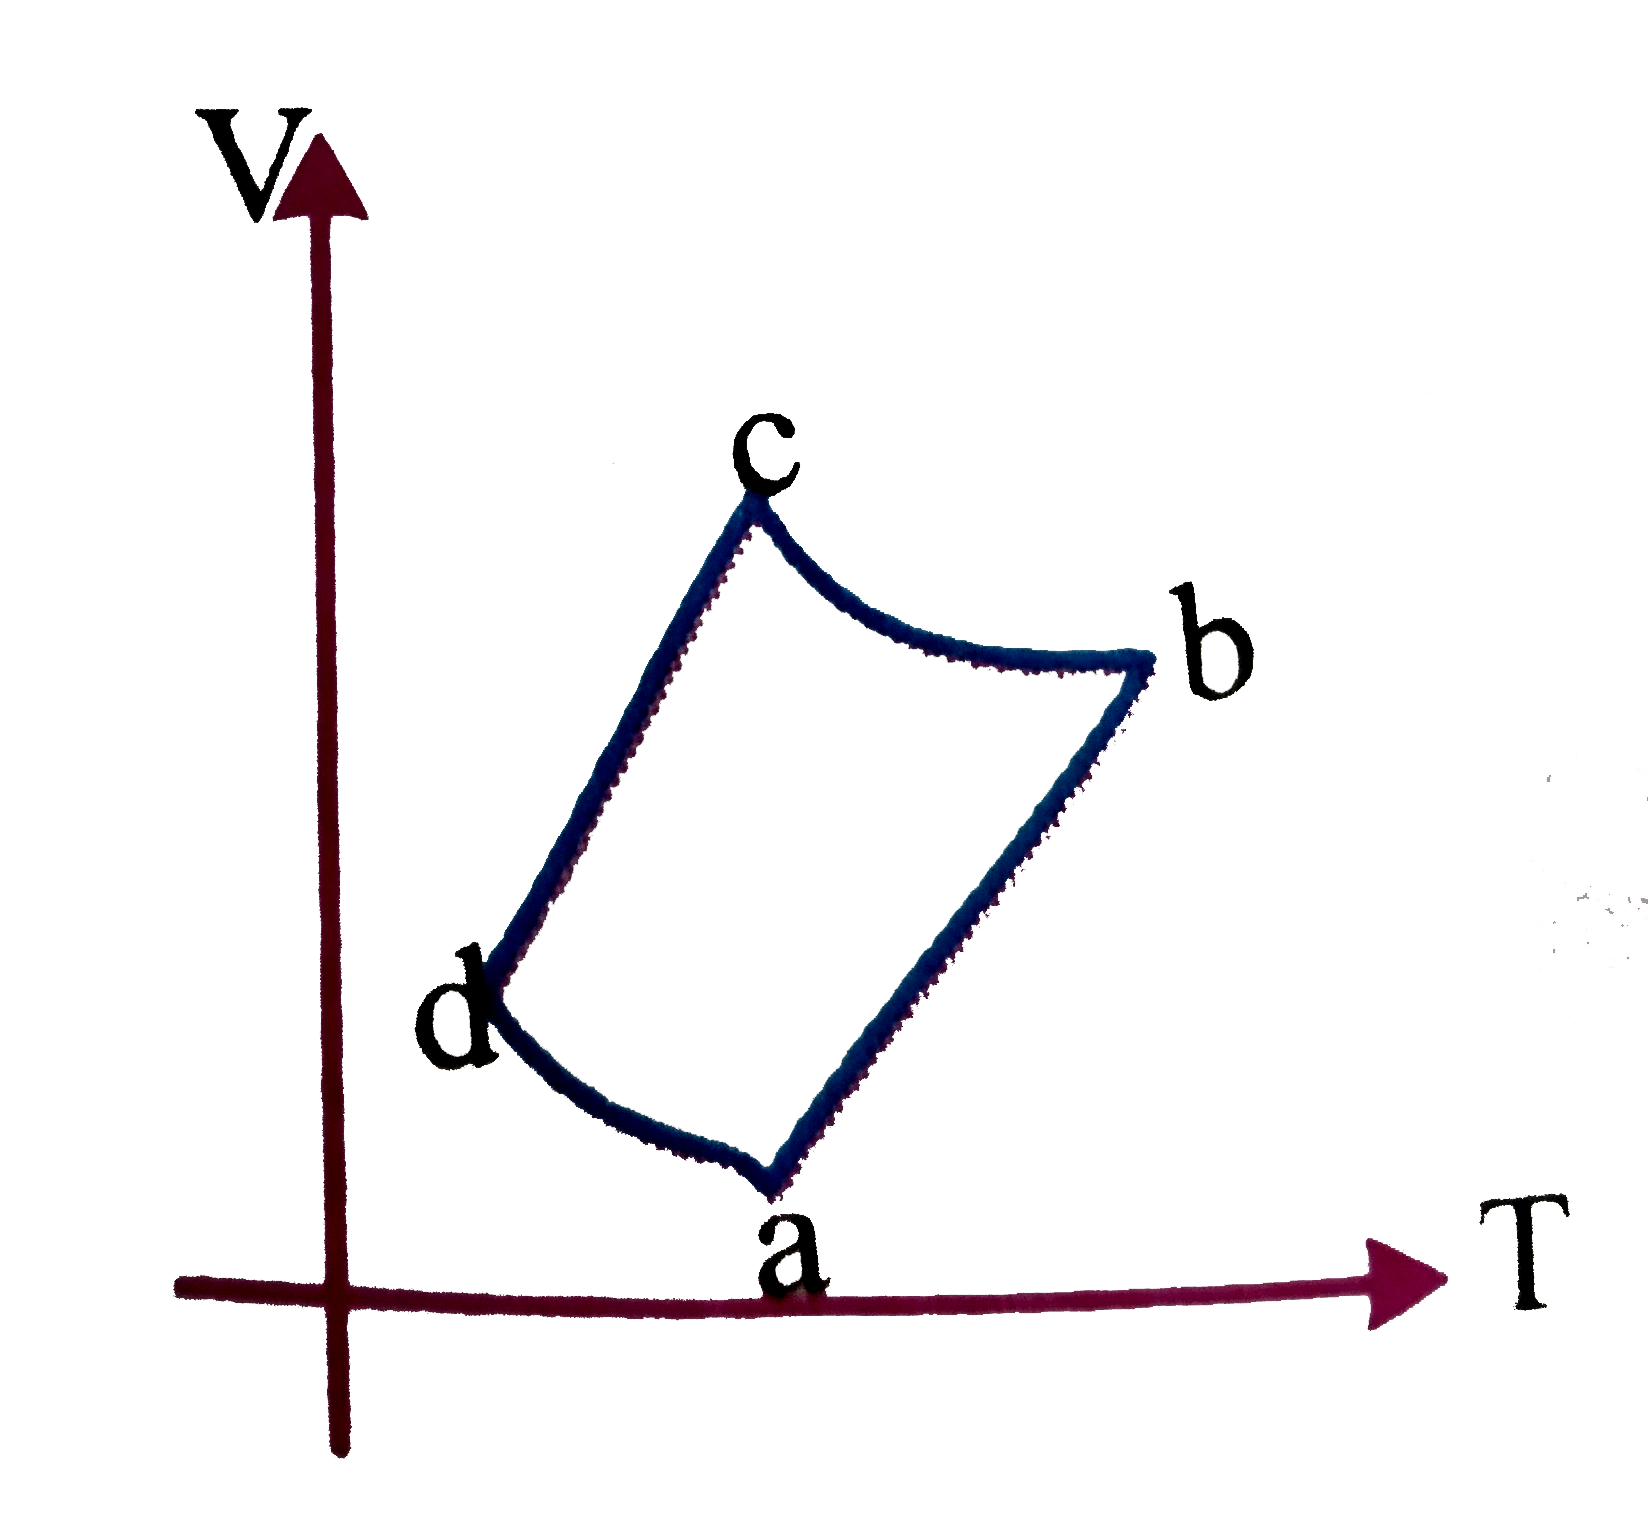
The corresponding P-V diagram for the process is(all figures are schematic and not drawn to scale)
View Solution

