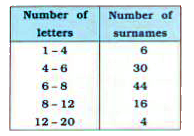
Draw a histogram of the following frequency distribution and use it to calculate the mode
Step by step video & image solution for Draw a histogram of the following frequency distribution and use it to calculate the mode by Maths experts to help you in doubts & scoring excellent marks in Class 10 exams.
Updated on:21/07/2023Similar Questions
Draw a histogram for the frequency distribution of the following data:

View SolutionDraw a histogram for the frequency distribution of the following data:

View SolutionDraw a histogram for the frequency distribution :

View Solution100 surnames were randomly picked up from a local telephone directory and a frequency distribution of the number of letters in the English alphabet in the surnames was found as follows:

(i) Draw a histogram to depict the given information, (ii) Write the class interval in which the maximum number of surnames lie.
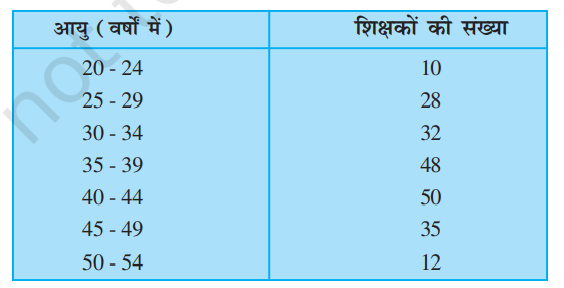
View Solutionनिम्नलिखित वर्गीकृत बारंबारता बंटन को निरूपित करने के लिए एक आयतचित्र खींचिए :

View SolutionDraw a histogram for the following frequency distribution and find the mode from the graph :

View SolutionDraw frequency polygons for each of the following frequency distributions :
using histogram

View SolutionDraw frequency polygons for each of the following frequency distributions :
without using histogram.

View Solution
