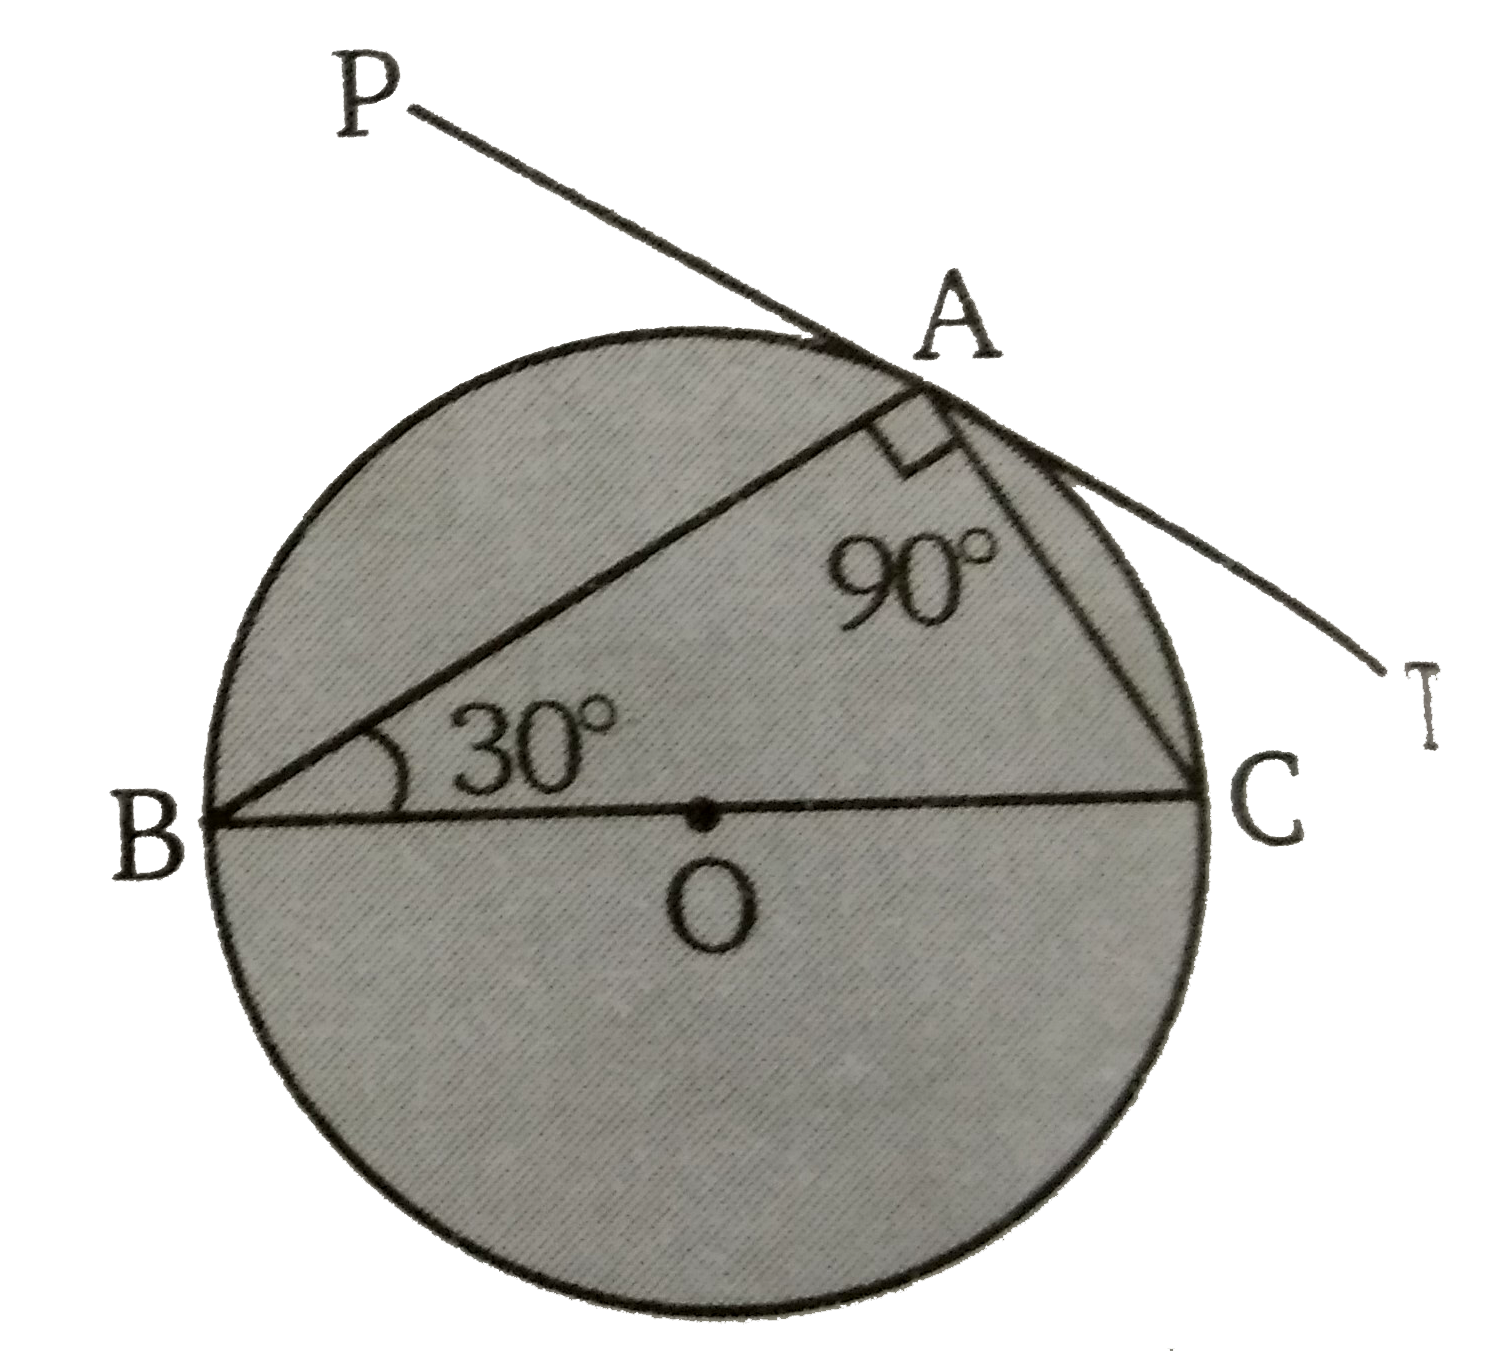
दिये गये चित्र में, वृत्त के बिन्दु A पर PAT एक स्पर्शी है। BC वृत्त का व्यास है तथा ∠ABC=30∘ तब ∠PAB व ∠TAC के मान ज्ञात कीजिए ।

The correct Answer is:∠PAB=60∘,∠TAC=30∘
Step by step video & image solution for दिये गये चित्र में, वृत्त के बिन्दु A पर PAT एक स्पर्शी है। BC वृत्त का व्यास है तथा angleABC = 30^(@) तब angle PAB व angle TAC के मान ज्ञात कीजिए । by Maths experts to help you in doubts & scoring excellent marks in Class 10 exams.
Updated on:21/07/2023Topper's Solved these Questions
- वृत्त BOOK - BALAJI PUBLICATIONCHAPTER - वृत्त EXERCISE - अभ्यास प्रश्न 8.2 (लघु उत्तरीय प्रश्न)
4 Videos
- वृत्त BOOK - BALAJI PUBLICATIONCHAPTER - वृत्त EXERCISE - बहुविकल्पीय प्रश्न (सही विकल्प का चयन कीजिए ।)
8 Videos
- वृत्त BOOK - BALAJI PUBLICATIONCHAPTER - वृत्त EXERCISE - अभ्यास प्रश्न 8.2 (अतिलघु उत्तरीय प्रश्न)
11 Videos
- वास्तविक संख्याऐंBOOK - BALAJI PUBLICATIONCHAPTER - वास्तविक संख्याऐंEXERCISE - स्वमूल्यांकन परीक्षण
18 Videos
- वृत्तों से समबन्धित क्षेत्रफल BOOK - BALAJI PUBLICATIONCHAPTER - वृत्तों से समबन्धित क्षेत्रफल EXERCISE - स्वमूल्यांकन परीक्षण
15 Videos
Similar Questions
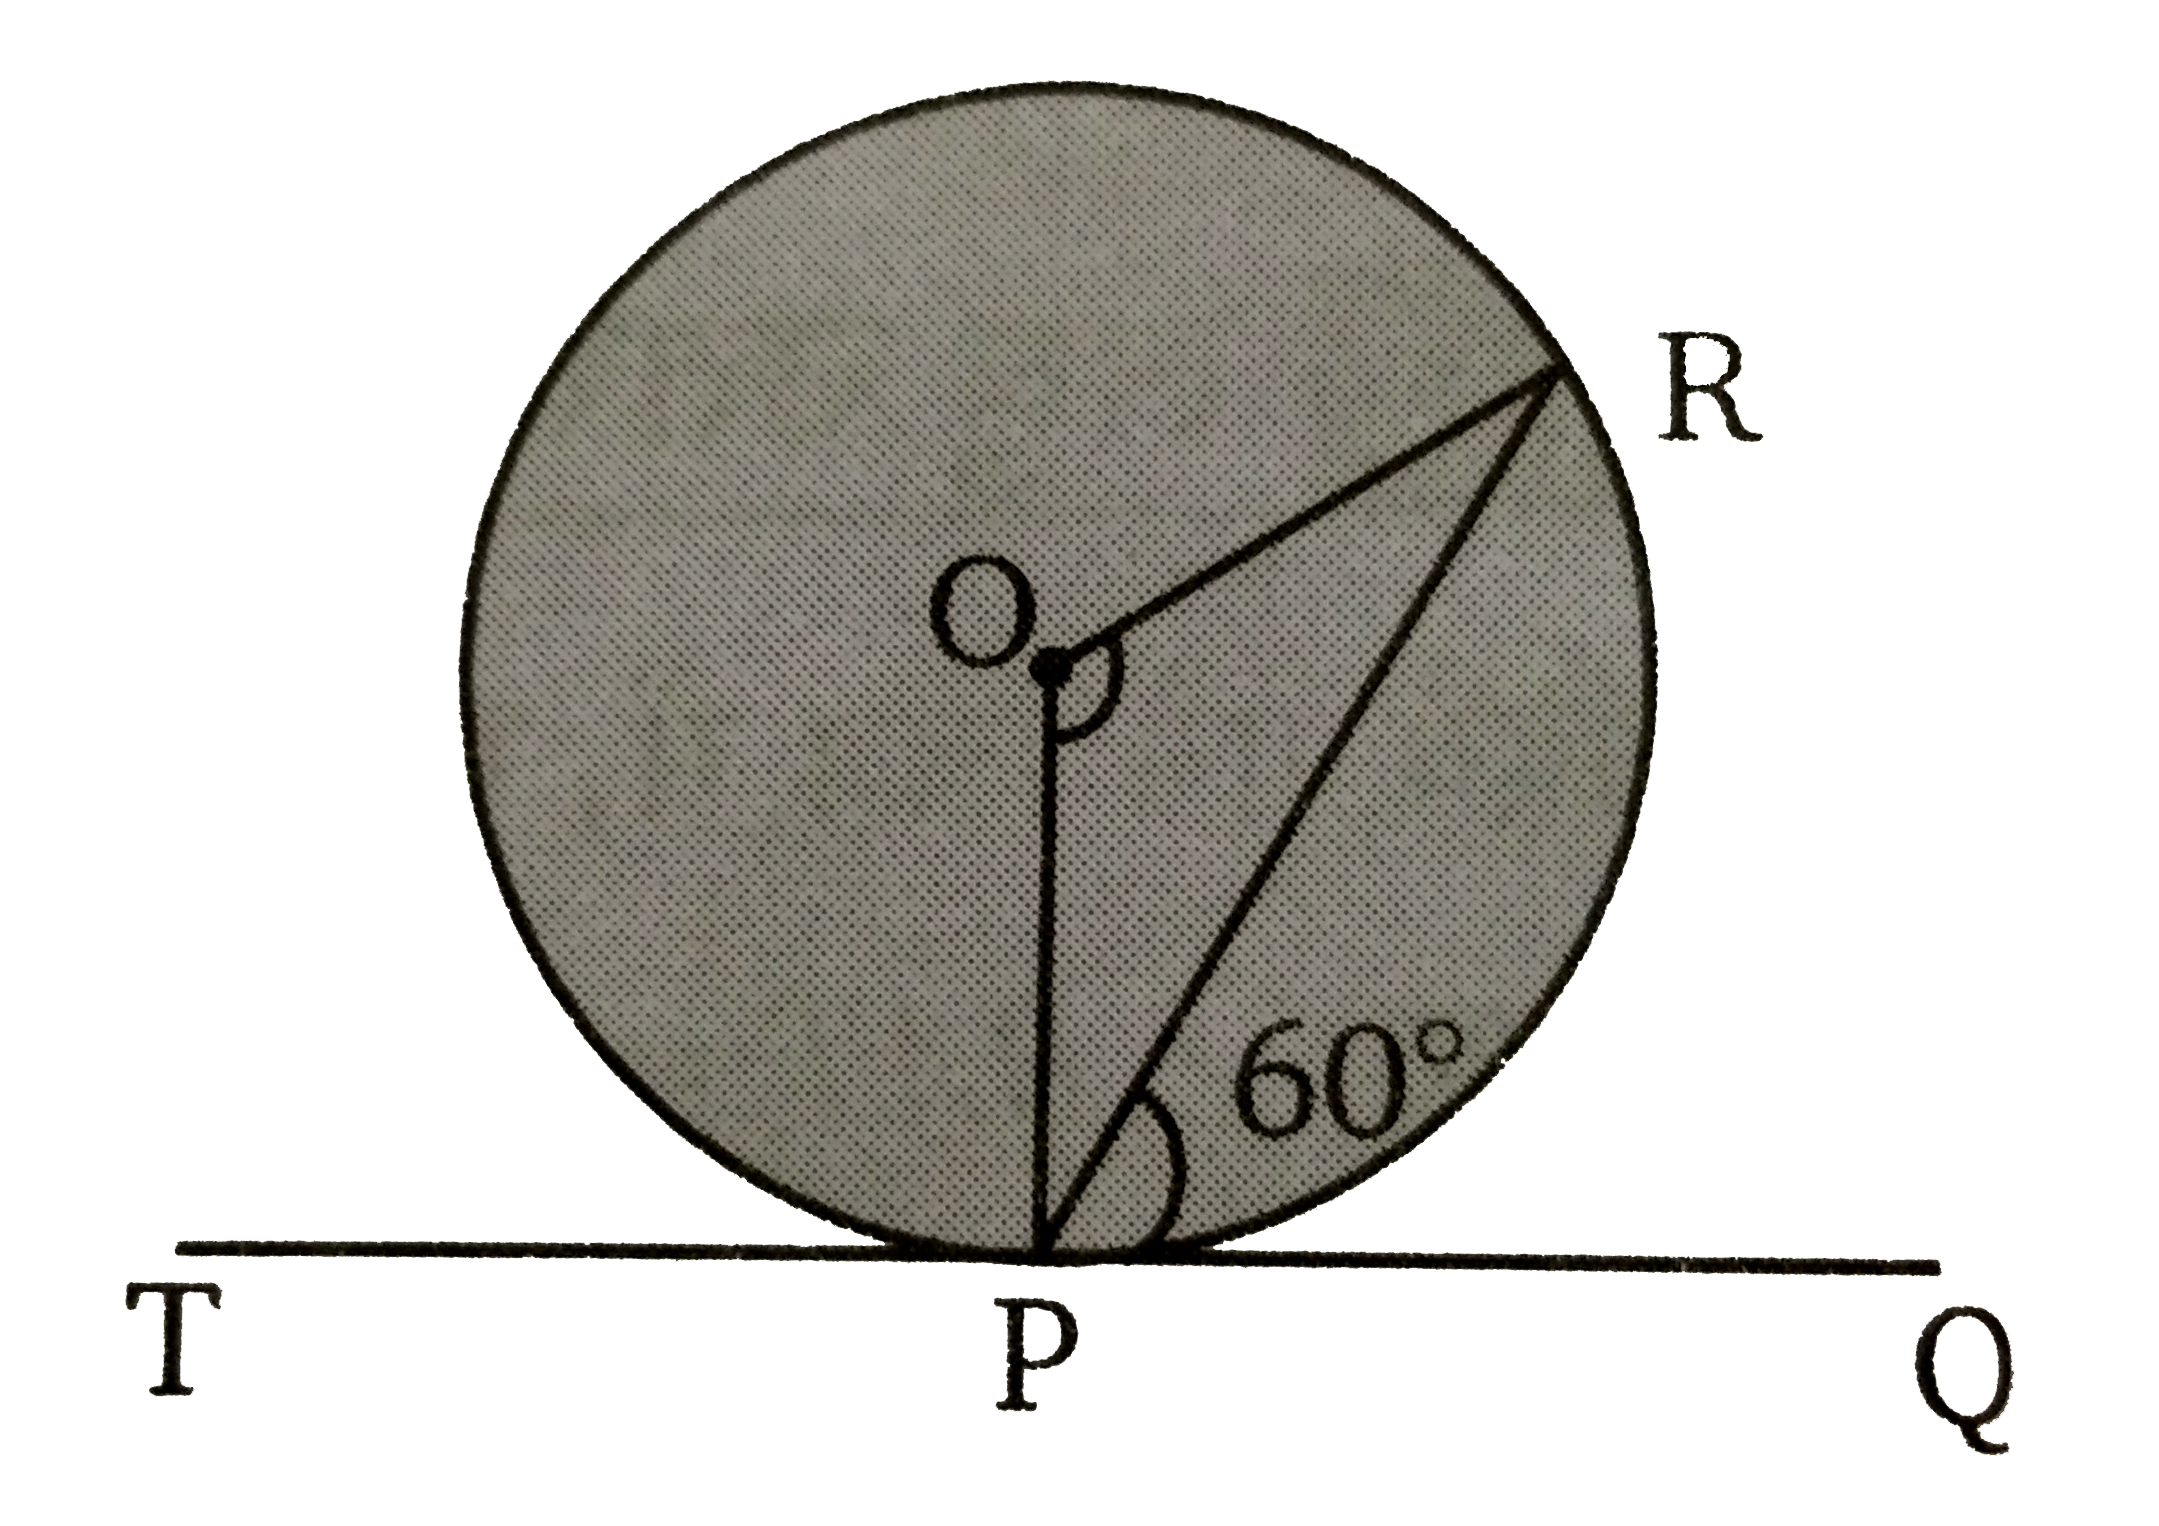
चित्र में, O वृत्त का केन्द्र है और TPQ इसकी स्पर्श रेखा है। यदि ∠RPQ=60∘ है तो ∠POR का मान ज्ञात कीजिए ।

View Solution7 सेमी त्रिज्या वाले वृत्त पर बिंदु P से 24 सेमी लम्बी स्पर्श रेखा PT खींची गई है। यदि O वृत्त का केंद्र है तो OP की माप है-
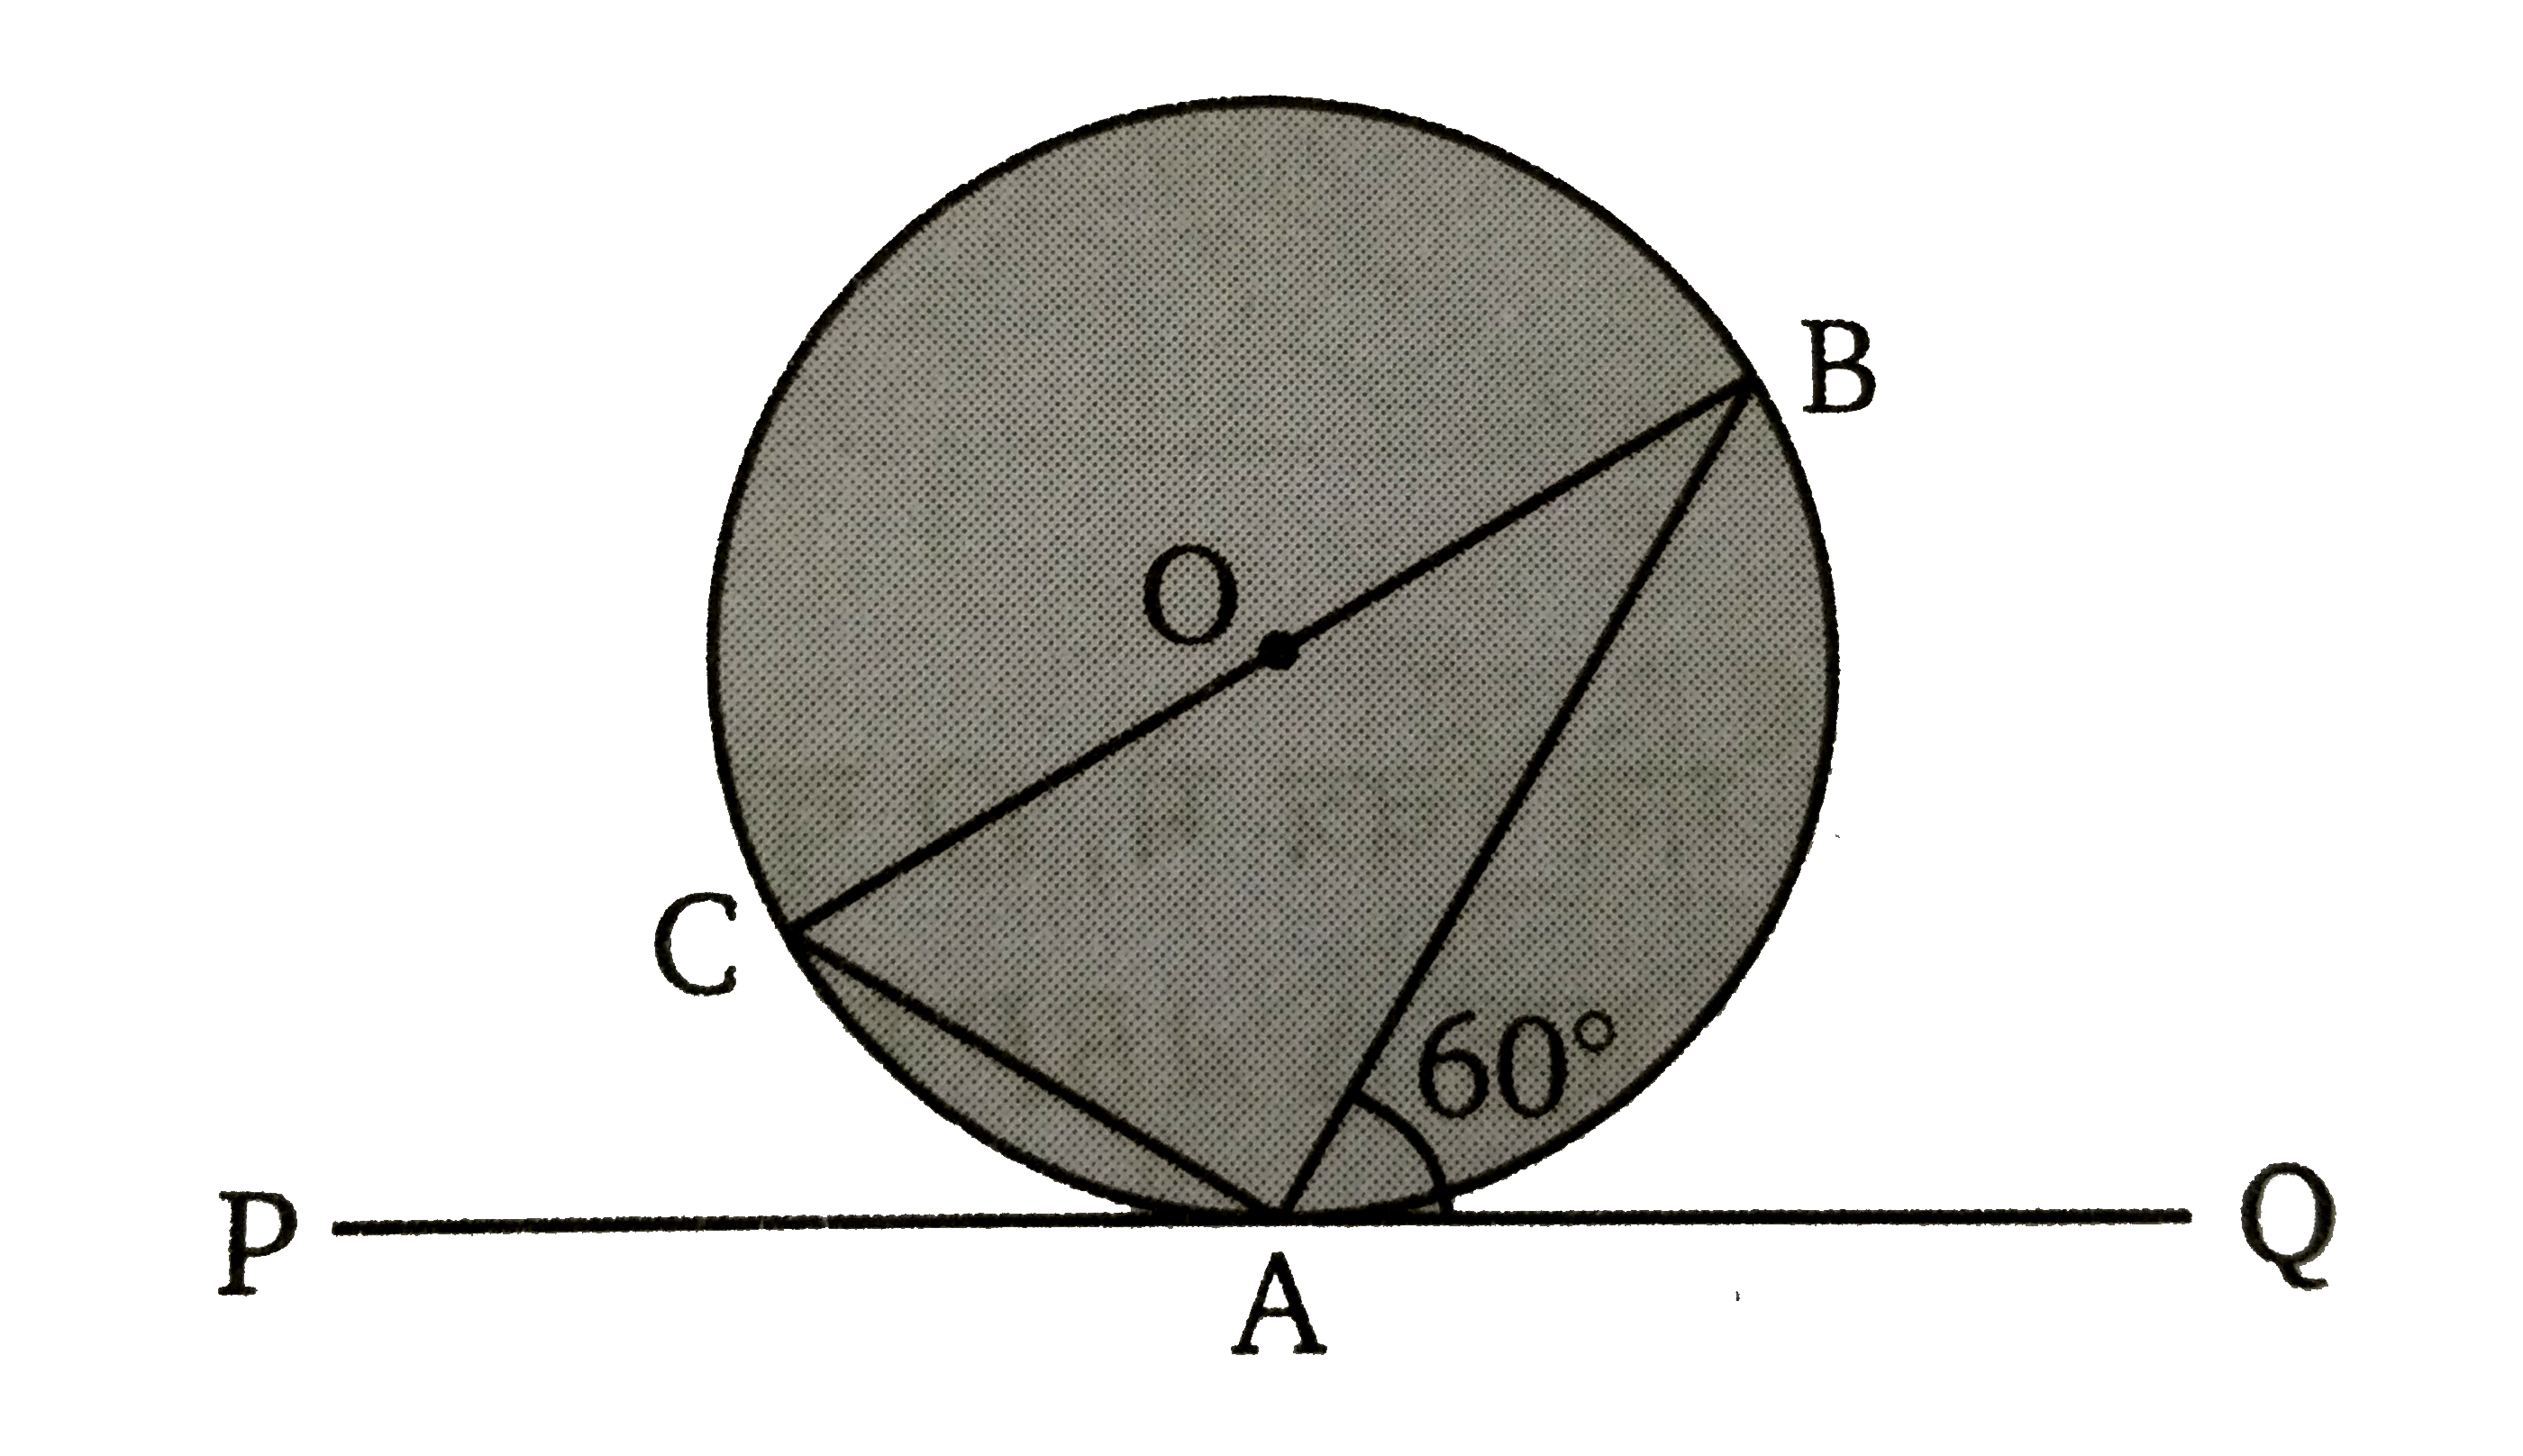
View Solutionदिये गए चित्र में O केन्द्र वाले एक वृत्त के बिन्दु A पर PAQ एक स्पर्शी है तथा ∠BAQ=60∘ तब ∠ABC का मान ज्ञात कीजिए ।

View Solutionनिम्नलिखित संख्या-युग्मो के HCF ज्ञात कीजिए ।
(i) 156, 13
(ii) 1001, 385
(iii) 81445, 687897
View Solution6 सेमी त्रिज्या वाले वृत्त पर 60∘ पर त्रिज्यखण्ड का क्षेत्रफल व परिमाप ज्ञात कीजिए ।
View SolutionHow many lines of symmetry does the above figure have ?
View SolutionWhich of the following are correct chain isomers of butane ? (i)
View SolutionDetermine the point of symmetry of a regular hexagon.
View SolutionDtermine the images of the following figure about the given line :
View SolutionMatch the following Column A to Column B

View SolutionMatch the following Column A to Column B

View SolutionMatch the following Column A to Column B

View SolutionThe inequation represented by the graph given below is :
View SolutionThe inequation that best describes the graph given below is _________
View SolutionThe inequation that best describes the following graph is _________
View SolutionWhich inequations represent the shaded region in the given figure
View Solution
