The graph shows the variation of lnRv/s1T2, where R is resistance and T is temperature. Then find R as function T.
_2019_CBT5_E01_037_Q01.png)
R−R0eT02/T2
R−R0e−T2/T02
R−R0eT3/T0
R−R0e−T3/T03
The correct Answer is:A
Step by step video, text & image solution for The graph shows the variation of l nR v//s (1)/(T^(2)), where R is resistance and T is temperature. Then find R as function T. by Physics experts to help you in doubts & scoring excellent marks in Class 12 exams.
Topper's Solved these Questions
Similar Questions
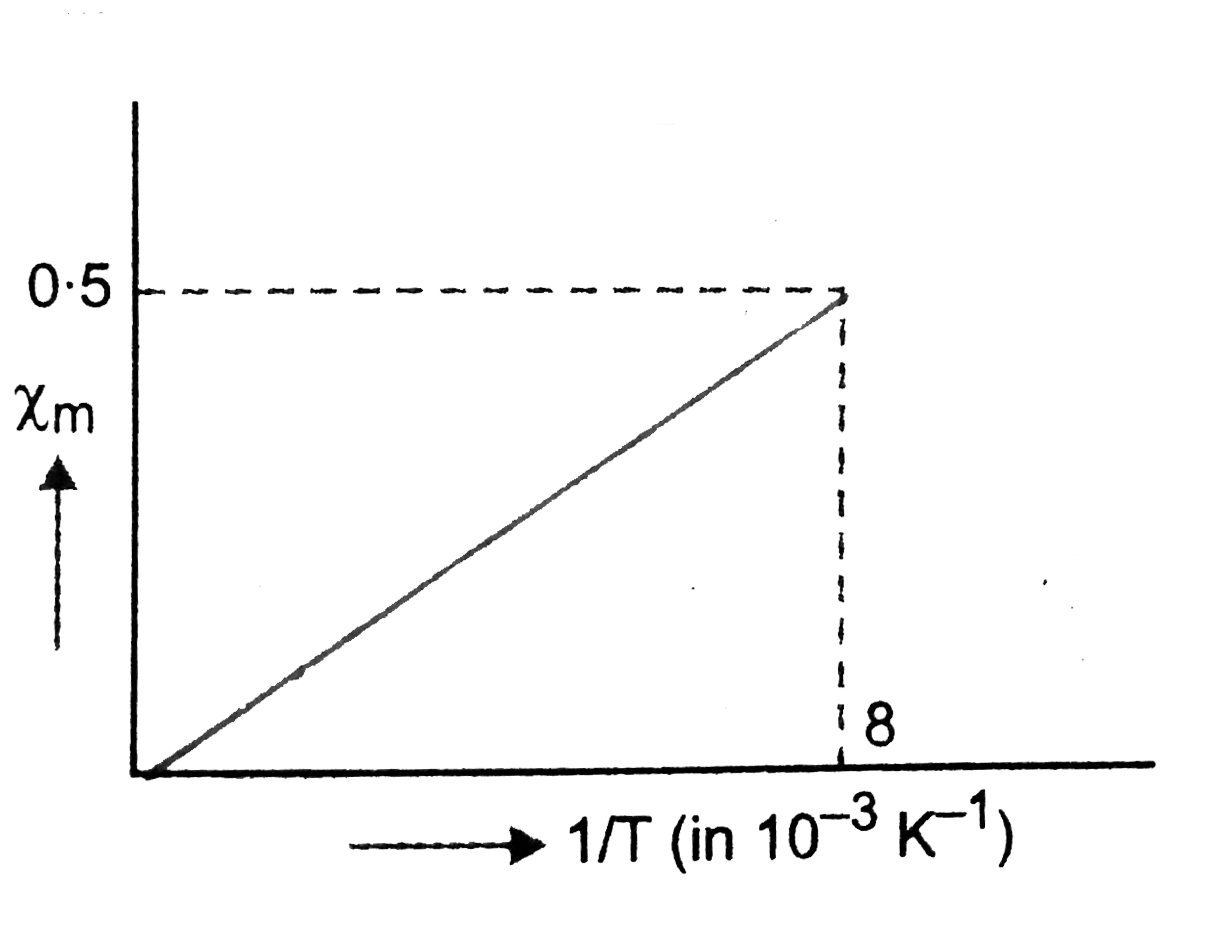
Figure shows the variation of susceptibility of a material with 1/T, where T is the temperature. Calculate curie constant of the material.
 View Solution
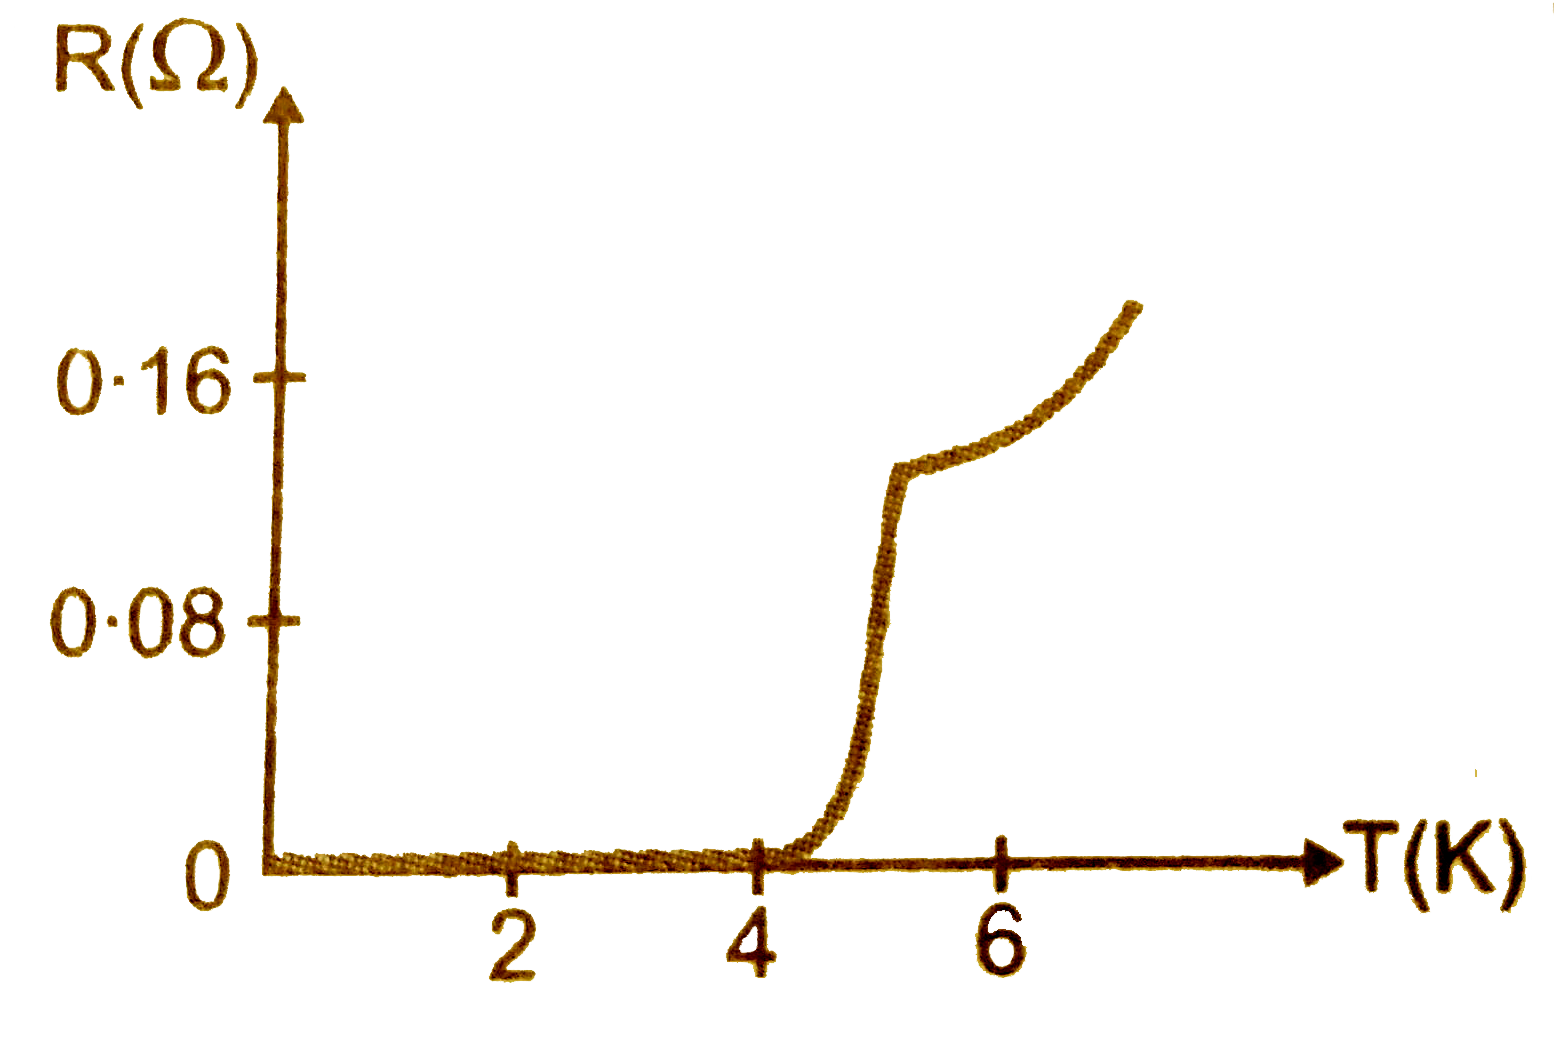
The given graph shows the variation of resistance of mercury in the temperature range 0 lt T lt 4 K. Name the phenomeon shown by the graph.
 View Solution
Knowledge Check
- Question 1 - Select One
Resistance of a resistor at temperature t∘CisRt=R0(1+αt+βt2), where R0 is the resistance at 0∘C. The temperature coefficient of resistance at temperature t∘C is
A(1+αt+βt2)α+2βtB(α+2βt)Cα+2βt(1+αt+βt2)Dα+2βt2(1+alpaht+βr2) - Question 2 - Select One
The correct graph which shows the variation of paramagnetic susceptibility S with temperature T is
A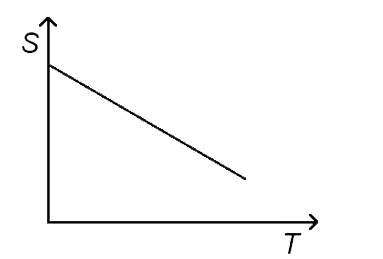 B
B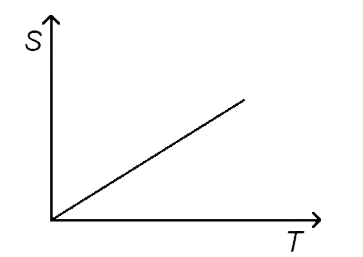 C
C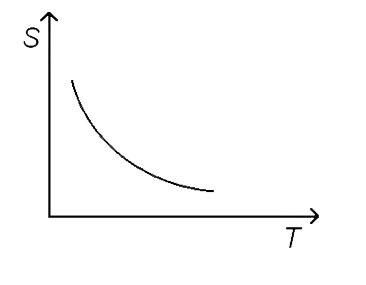 D
D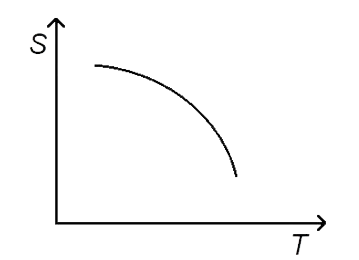
- Question 3 - Select One
The figure shows the variation of V with i at temperatures T1 and T2. Then T1−T2 is proportional to
 Atan2αBtanαCsinαDcos2α
which of the following graph represents the variation of resistivity (ρ) with temperature (T) for copper?
View SolutionA rod of length l with thermally insulated lateral surface consists of material whose heat conductivity coefficient varies with temperature as k=a/T, where a is a constant. The ends of the rod are kept at temperatures T1andT2. Find the function T(x), where x is the distance from the end whose temperature is T1.
View SolutionFind out the unit and dimensions of the constants aandb in the van der Waal's equation (P+aV2)(V−b)=Rt, where P is pressure , v is volume , R is gas constant , and T is temperature.
View SolutionWhich one of the following graphs represents the variation of electric field with distance r from the centre of a charged spherical conductor of radius R?
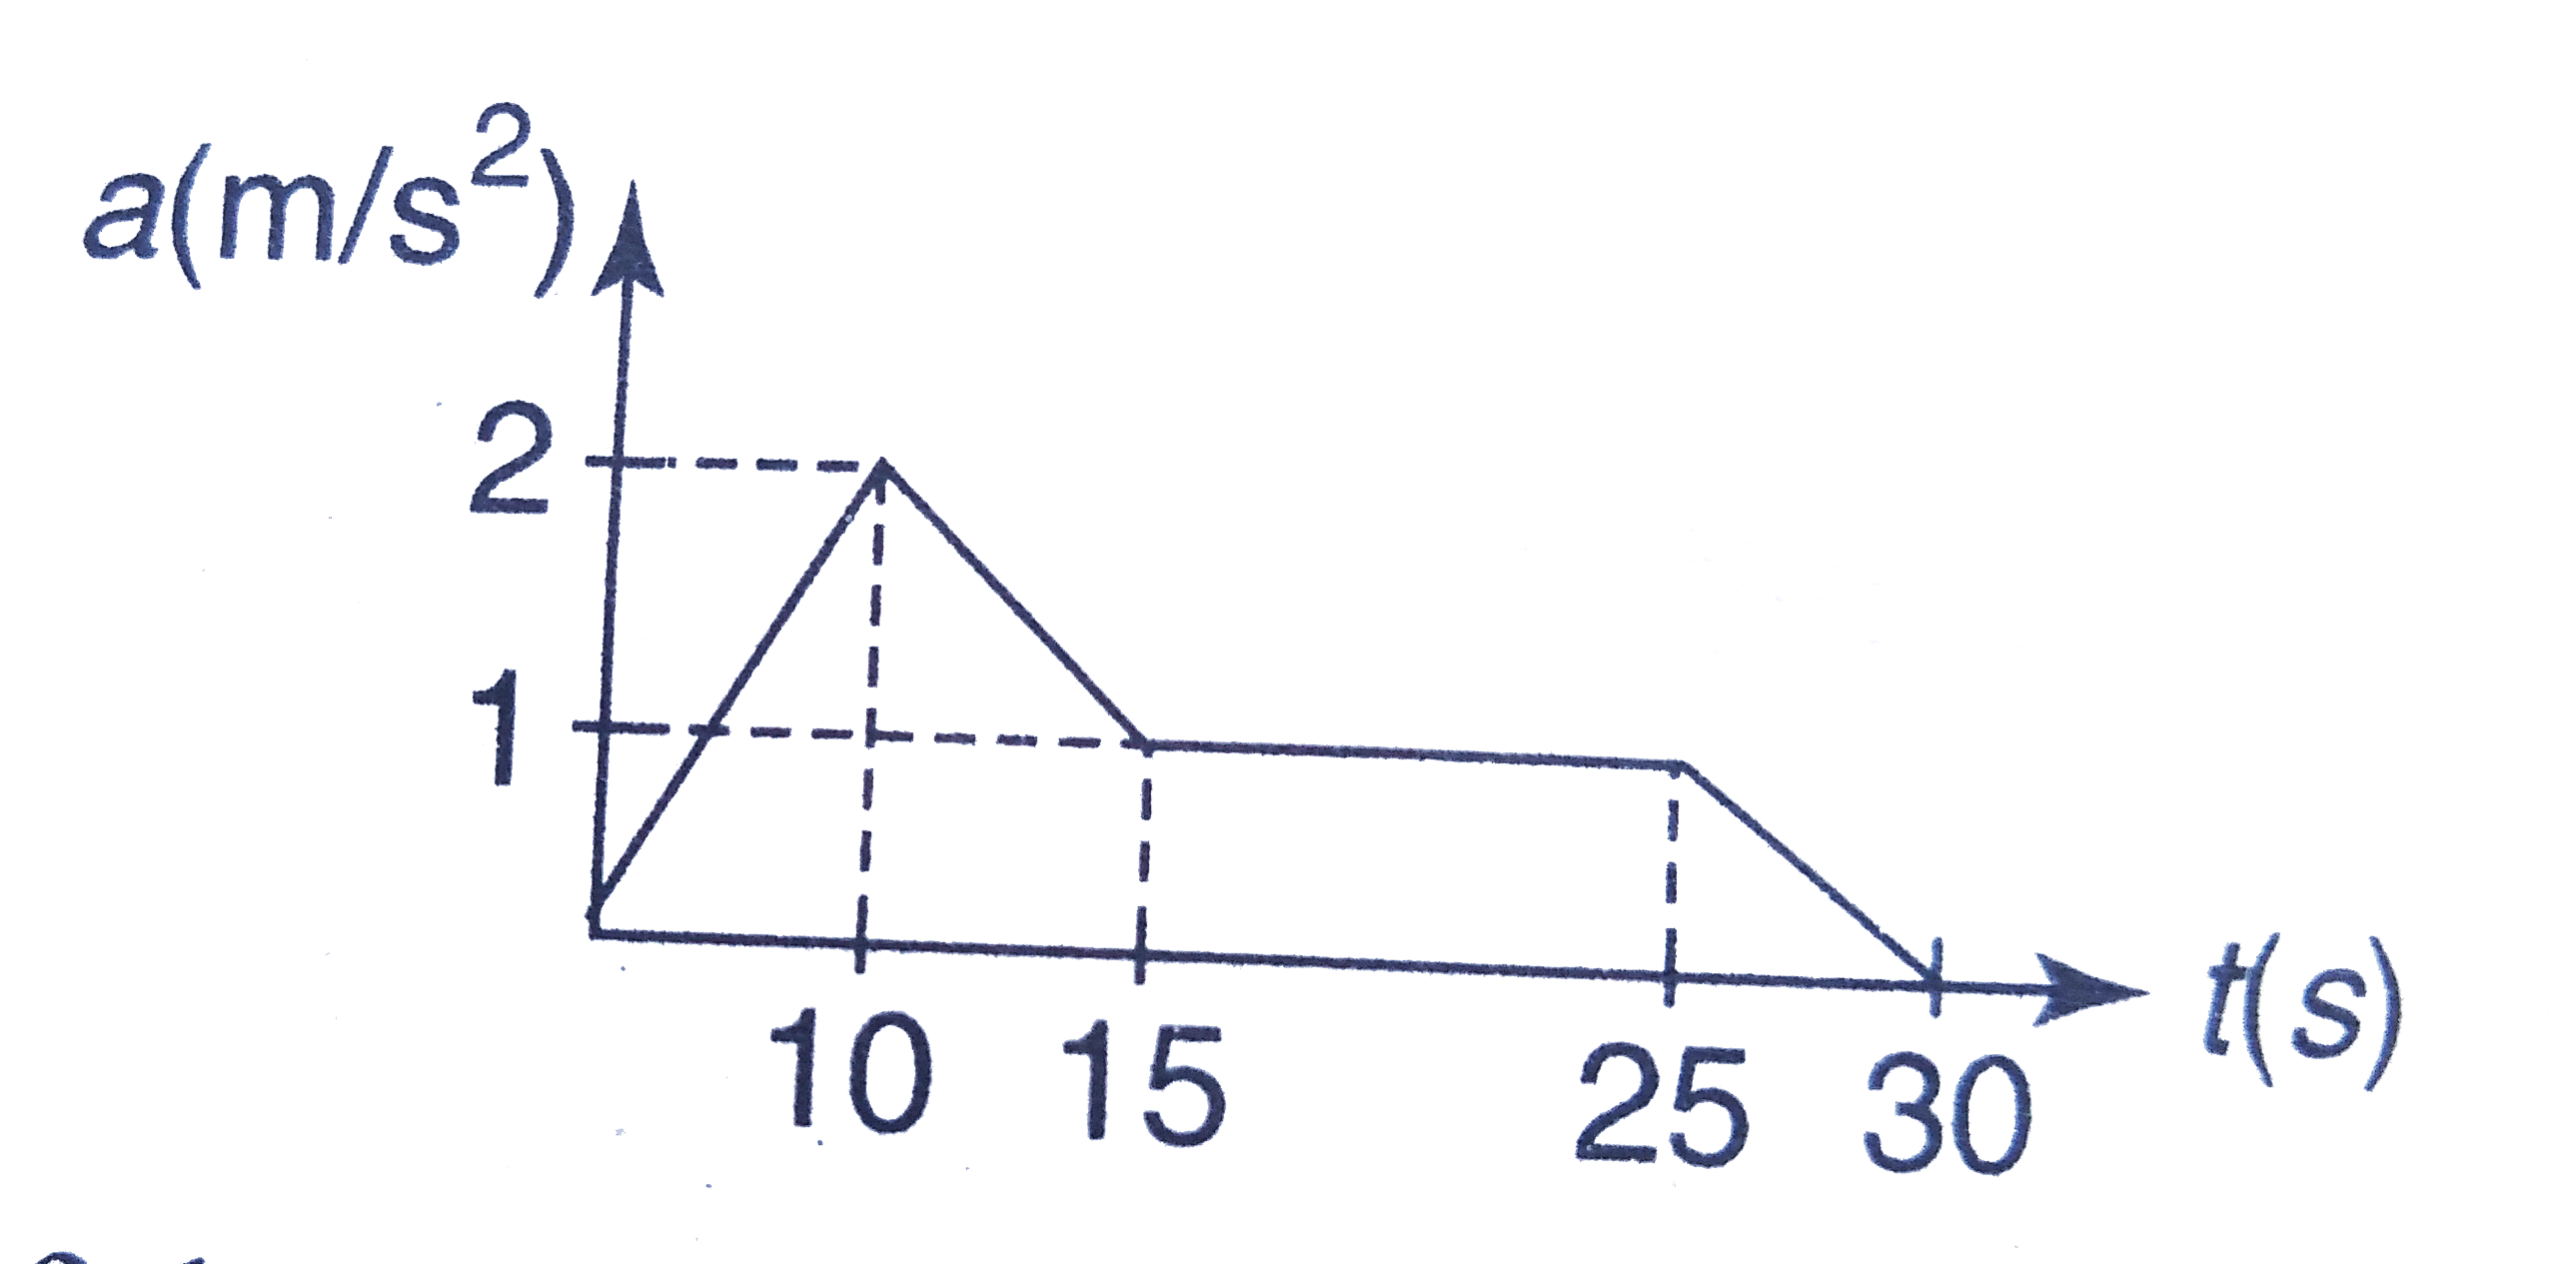
View SolutionIn figure shown, the graph shows the variation of acceleration of body with time t. The velcocity of the body at t=0 is zero. The velocity of the body at t=30s is.
 View Solution

