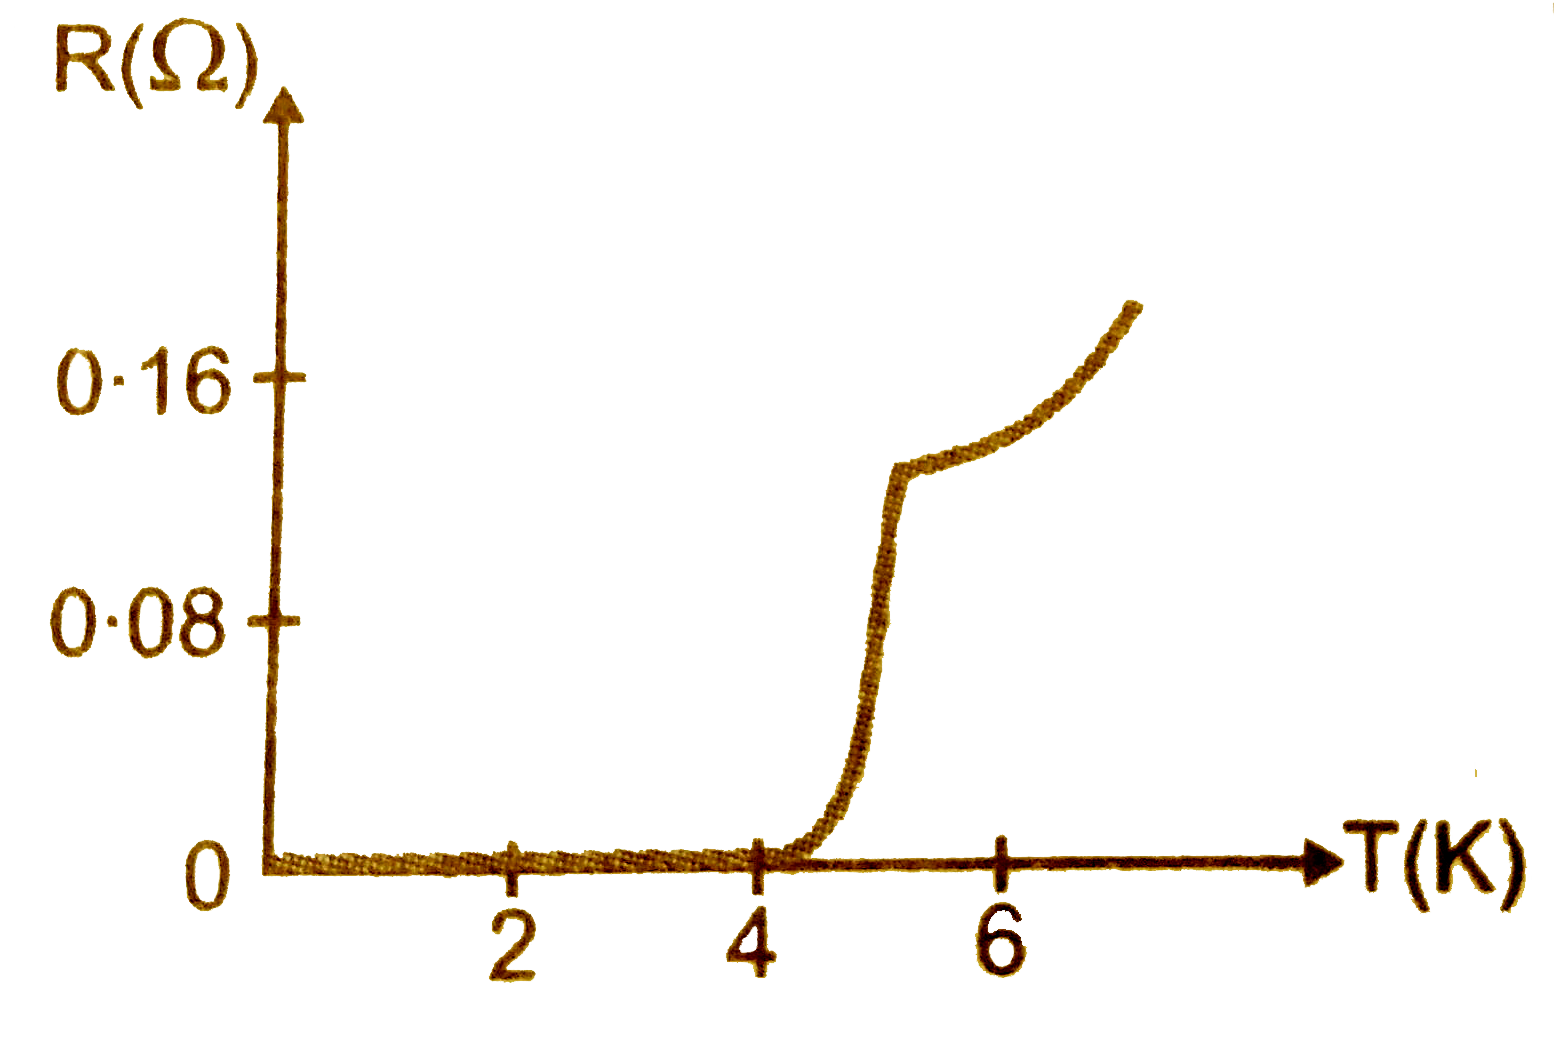
The given graph shows the variation of resistance of mercury in the temperature range 0 lt T lt 4 K. Name the phenomeon shown by the graph.
Video Solution
Text Solution
Superconductivity.
|
Topper's Solved these Questions
- CURRENT ELECTRICITYBook:PRADEEPChapter:CURRENT ELECTRICITYExercise:Conceptual Problems
Explore 3 Videos
- CURRENT ELECTRICITYBook:PRADEEPChapter:CURRENT ELECTRICITYExercise:Very short Q/A
Explore 7 Videos
- COMMUNICATION SYSTEMSBook:PRADEEPChapter:COMMUNICATION SYSTEMSExercise:MODEL TEST PAPER-2
Explore 9 Videos
- DUAL NATURE OF RADIATION AND MATTERBook:PRADEEPChapter:DUAL NATURE OF RADIATION AND MATTERExercise:Exercise
Explore 191 Videos
Similar Questions
Knowledge Check
The correct graph which shows the variation of paramagnetic susceptibility S with temperature T is
A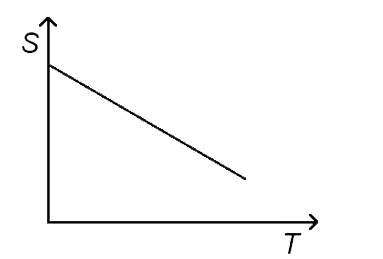 B
B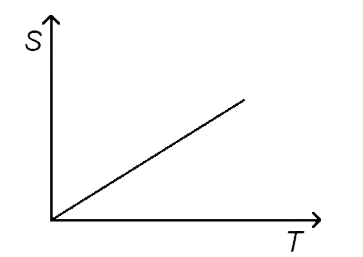 C
C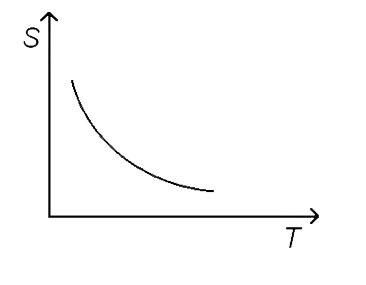 D
D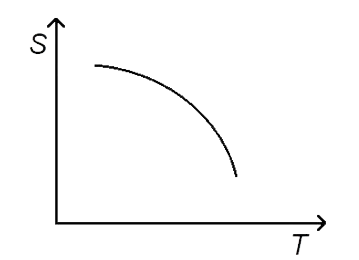
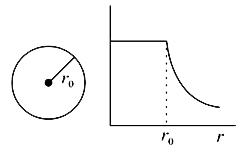
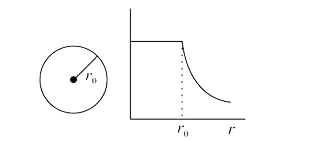
The given graph shows variation (with distance r from centre) of:
View SolutionShow variation of resistivity of SI with temperature in a graph.
View SolutionShow on a graph the variation of resistivity with temperature for a typical semiconductor
View SolutionShow on a graph, the variation of resistivity with temperature for a typical semiconductor.
View SolutionShow variation of resistivity of copper as a function of temperature in a graph.
View SolutionShow variation of resistivity of copper as a function of temperature in a graph.
View SolutionShow variation of resistivity of copper as a function of temperature in a graph.
View Solution


