The graphical solution of linear inequalities x+y≥5 and x−y≤3,
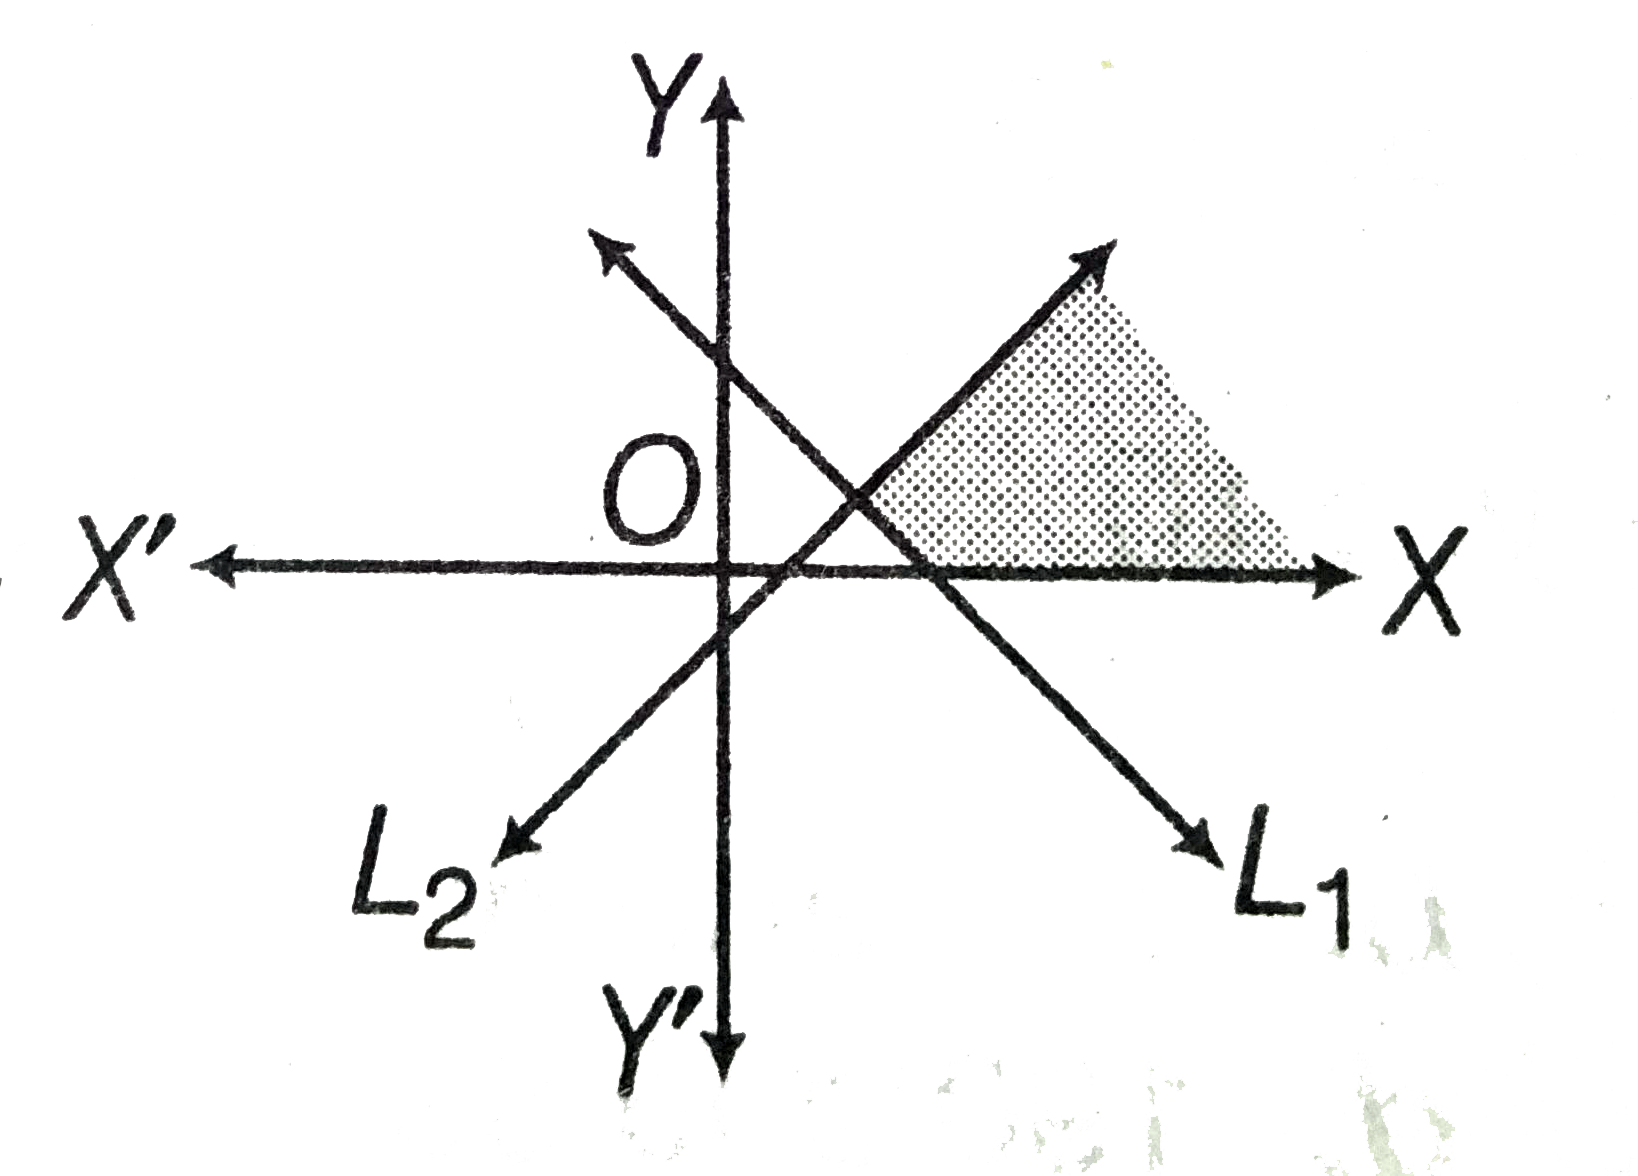
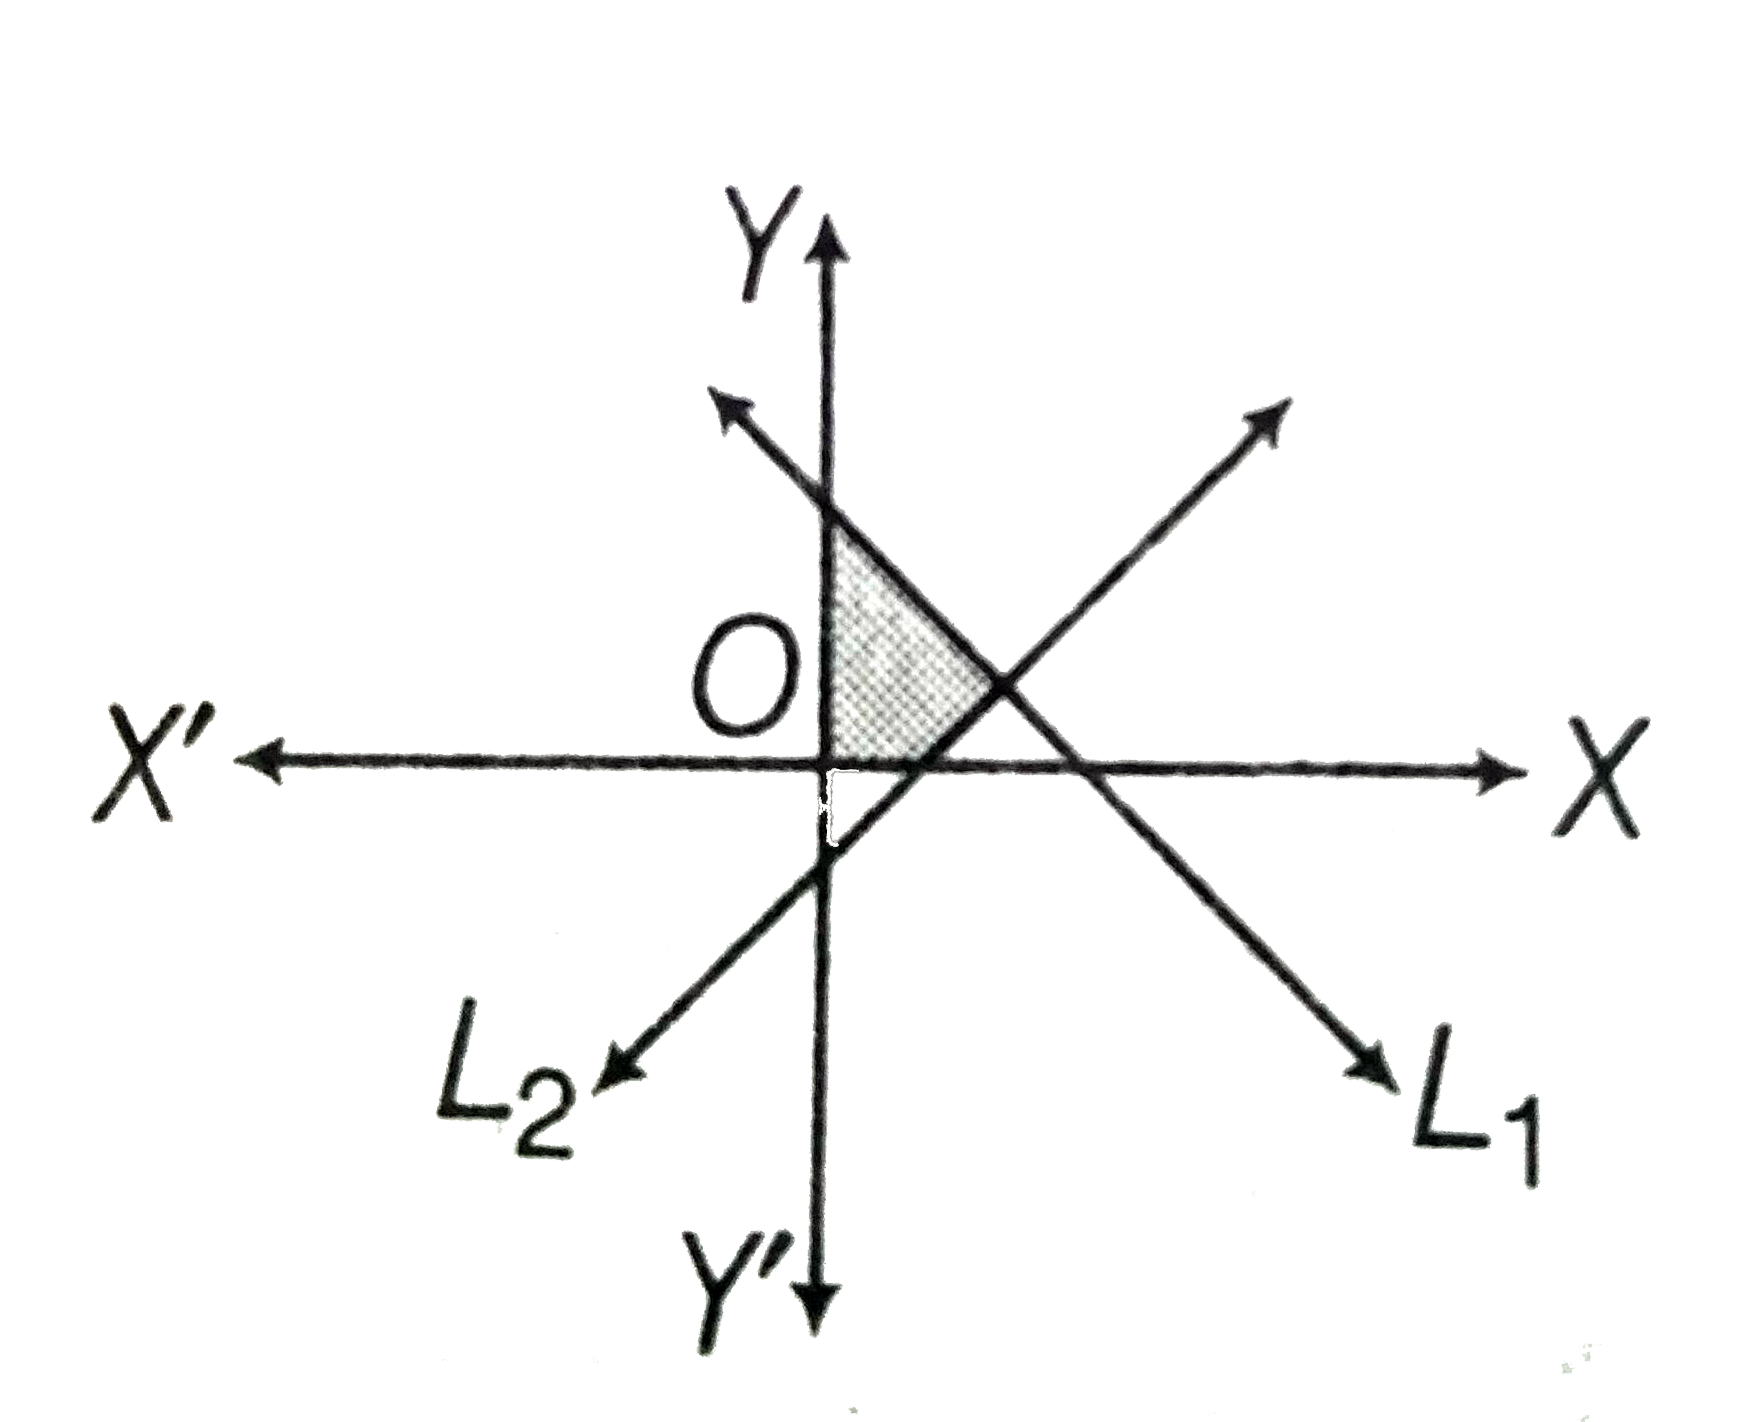
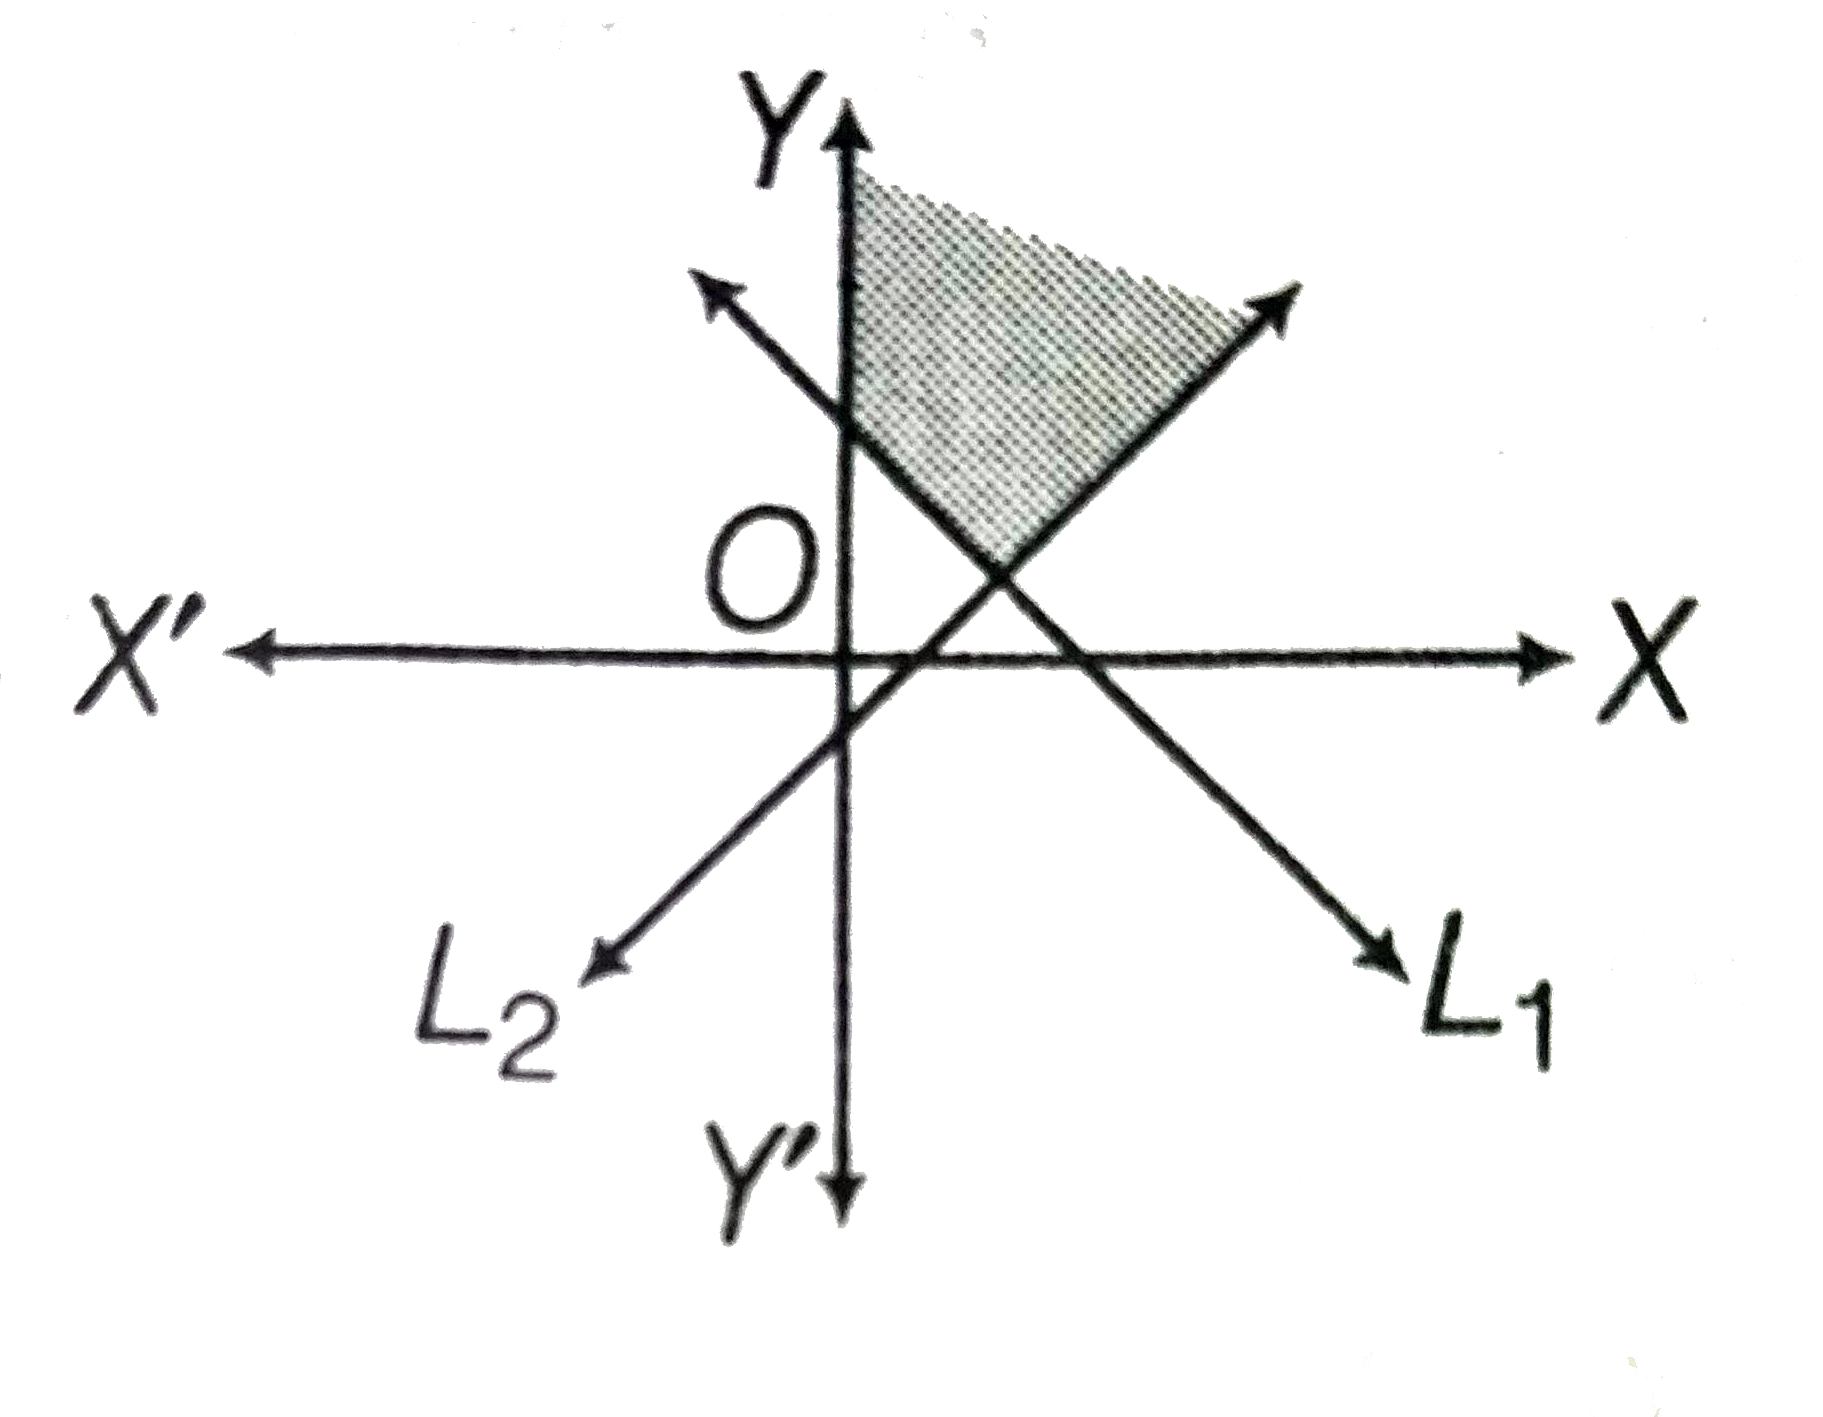
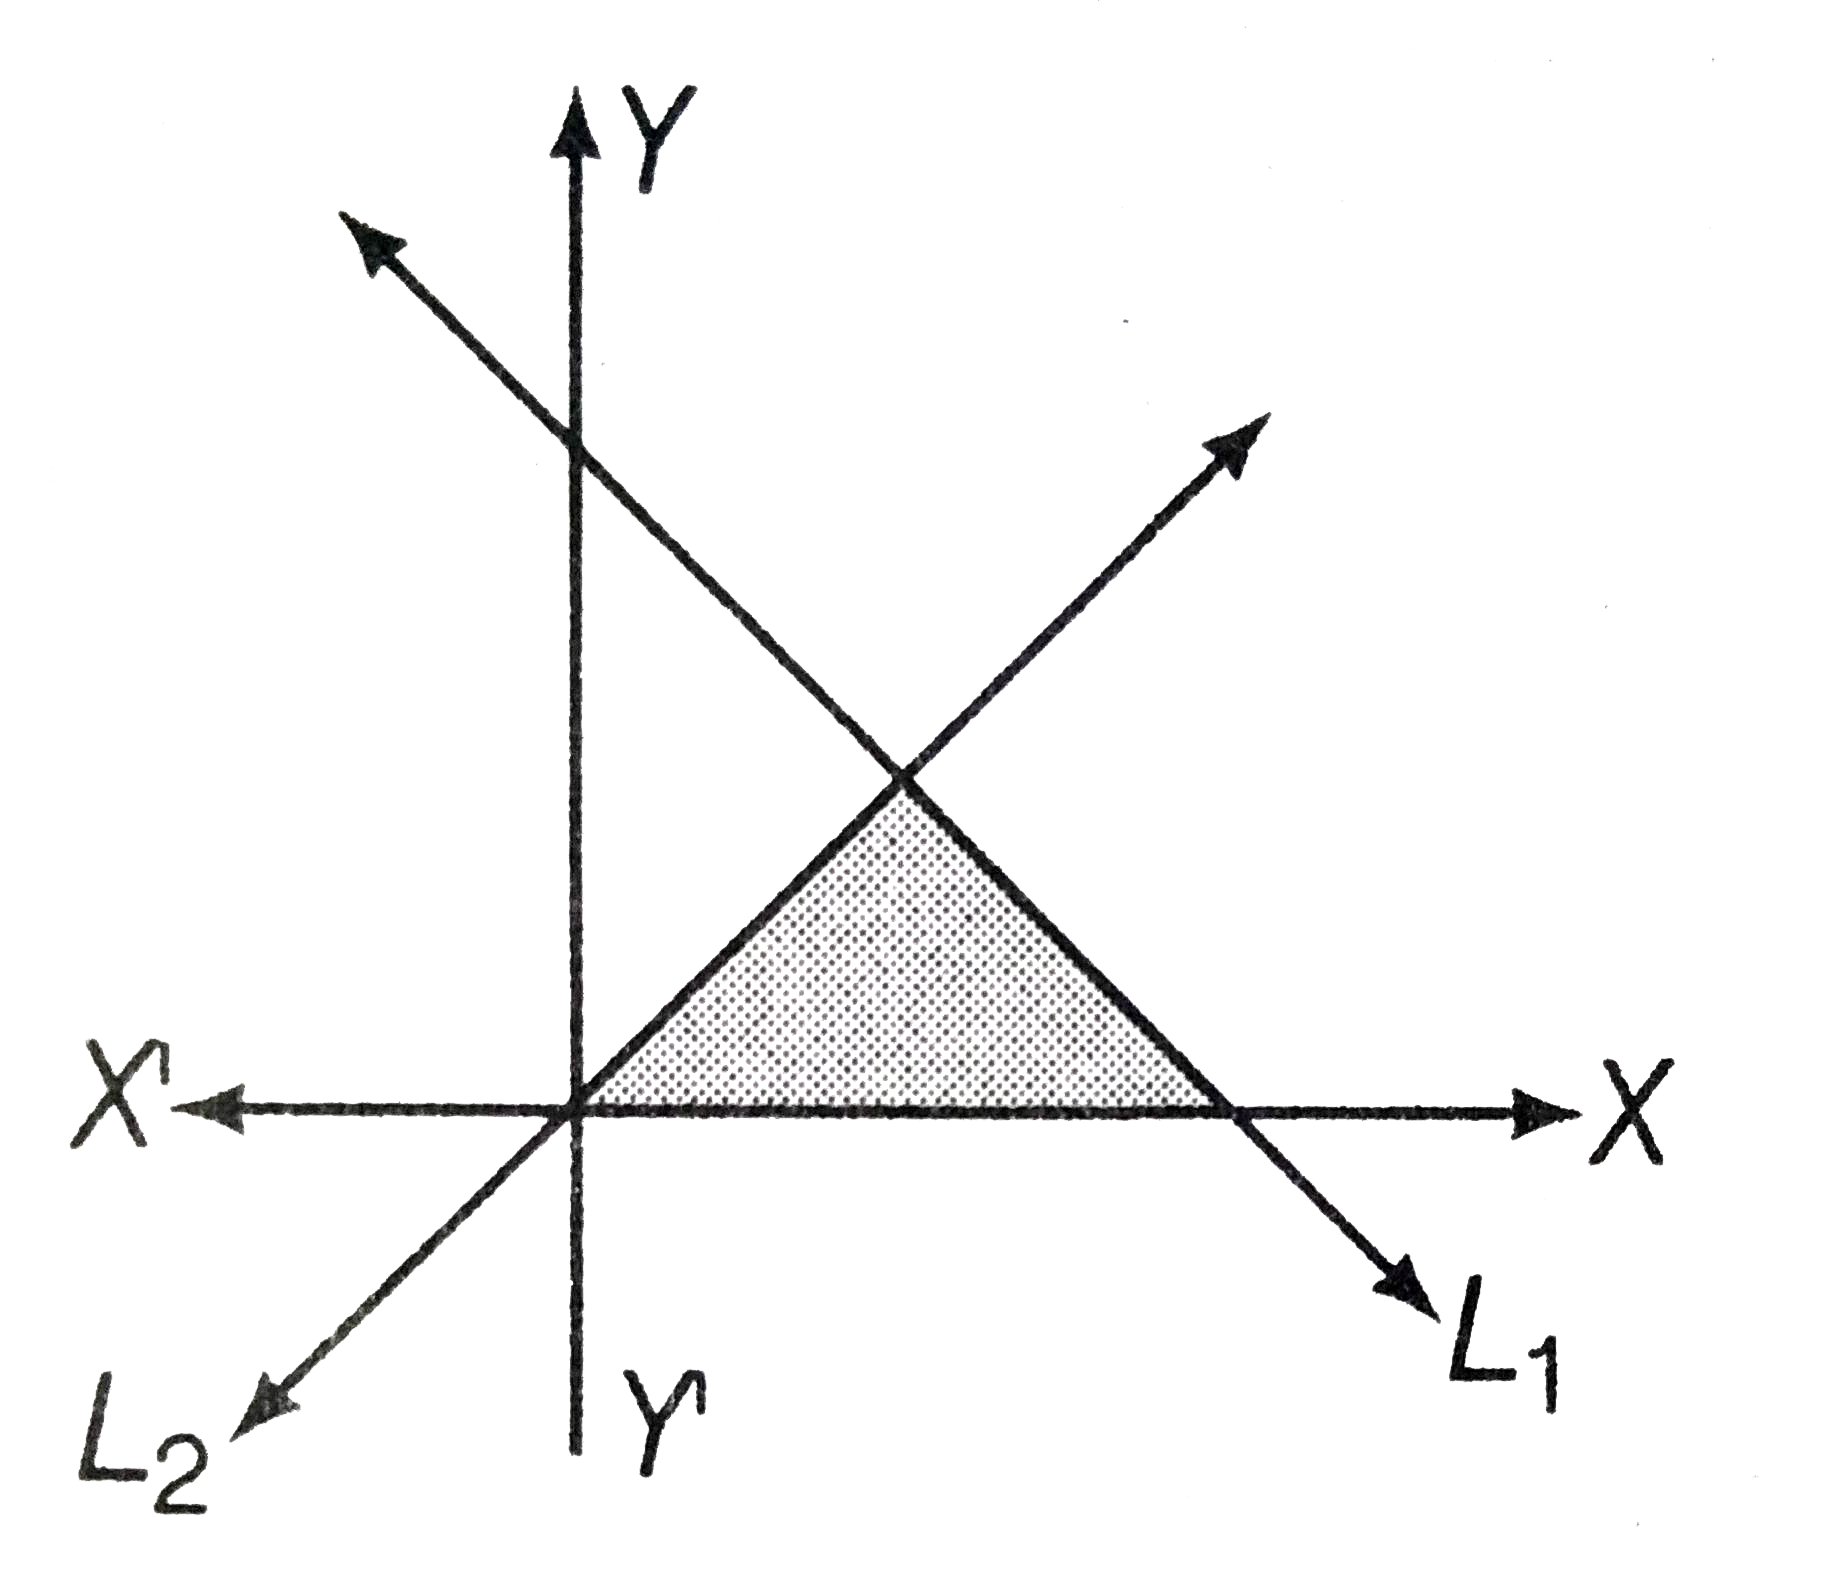
The correct Answer is:C
To solve the given linear inequalities graphically, we will follow these steps:
Step 1: Understand the inequalities
We have two inequalities:
1. x+y≥5
2. x−y≤3
Step 2: Convert inequalities to equations
To graph these inequalities, we first convert them into equations:
1. x+y=5
2. x−y=3
Step 3: Find intercepts for the first equation
For the equation x+y=5:
- When x=0, y=5 (Point: (0,5))
- When y=0, x=5 (Point: (5,0))
Step 4: Plot the first line
Plot the points (0,5) and (5,0) on the coordinate system and draw a straight line through these points. Since the inequality is ≥, we shade the area above this line.
Step 5: Find intercepts for the second equation
For the equation x−y=3:
- When x=0, y=−3 (Point: (0,−3))
- When y=0, x=3 (Point: (3,0))
Step 6: Plot the second line
Plot the points (0,−3) and (3,0) on the coordinate system and draw a straight line through these points. Since the inequality is ≤, we shade the area below this line.
Step 7: Identify the feasible region
The feasible region is where the shaded areas from both inequalities overlap. This region represents all the solutions that satisfy both inequalities.
Step 8: Conclusion
The graphical solution to the inequalities x+y≥5 and x−y≤3 is the shaded area where both conditions are satisfied.
---
We have two inequalities:
1. x+y≥5
2. x−y≤3
To graph these inequalities, we first convert them into equations:
1. x+y=5
2. x−y=3
For the equation x+y=5:
- When x=0, y=5 (Point: (0,5))
- When y=0, x=5 (Point: (5,0))
Plot the points (0,5) and (5,0) on the coordinate system and draw a straight line through these points. Since the inequality is ≥, we shade the area above this line.
For the equation x−y=3:
- When x=0, y=−3 (Point: (0,−3))
- When y=0, x=3 (Point: (3,0))
Plot the points (0,−3) and (3,0) on the coordinate system and draw a straight line through these points. Since the inequality is ≤, we shade the area below this line.
The feasible region is where the shaded areas from both inequalities overlap. This region represents all the solutions that satisfy both inequalities.
The graphical solution to the inequalities x+y≥5 and x−y≤3 is the shaded area where both conditions are satisfied.
Topper's Solved these Questions
- BOOK - MHTCET PREVIOUS YEAR PAPERS AND PRACTICE PAPERSCHAPTER - Linear Programming EXERCISE - MHT CET Corner13videos
Linear Programming
- BOOK - MHTCET PREVIOUS YEAR PAPERS AND PRACTICE PAPERSCHAPTER - Linear Programming EXERCISE - EXERCISE 1 (TOPICAL PROBLEMS )(Solution of LPP Graphical Method )15videos
Linear Programming
- BOOK - MHTCET PREVIOUS YEAR PAPERS AND PRACTICE PAPERSCHAPTER - LINEEXERCISE - MHT CET Corner3videos
LINE
- BOOK - MHTCET PREVIOUS YEAR PAPERS AND PRACTICE PAPERSCHAPTER - MATHEMATICAL LOGIC EXERCISE - MHT CET CORNER22videos
MATHEMATICAL LOGIC
Similar Questions
Knowledge Check
- Question 1 - Select One
The graphical solution of linear inequalities x+y≥5 and x−y≤3, where L1≡X+Y=5 and L2≡X−Y=3, is
A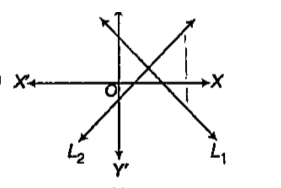 B
B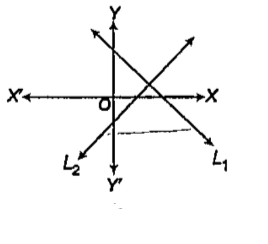 C
C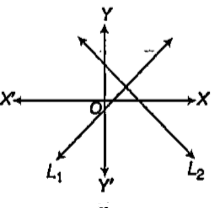 D
D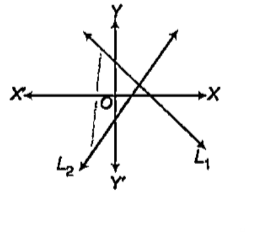
- Question 2 - Select One
The graphical solution of the inequalities x+2y≤10,x+y≥1,x−y≤0,x≥0,y≥0 is
A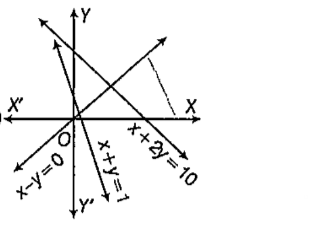 B
B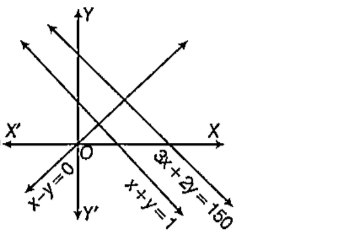 C
C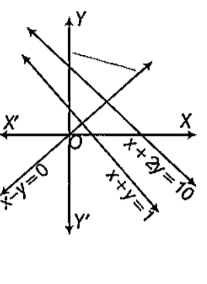 D
D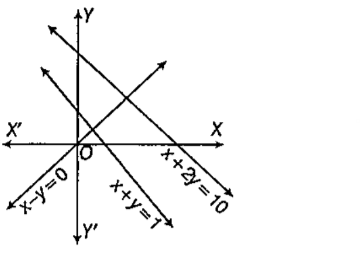
- Question 3 - Select One
The solution set of the linear inequalities 2x+2y≥10 and x+2y≥10
A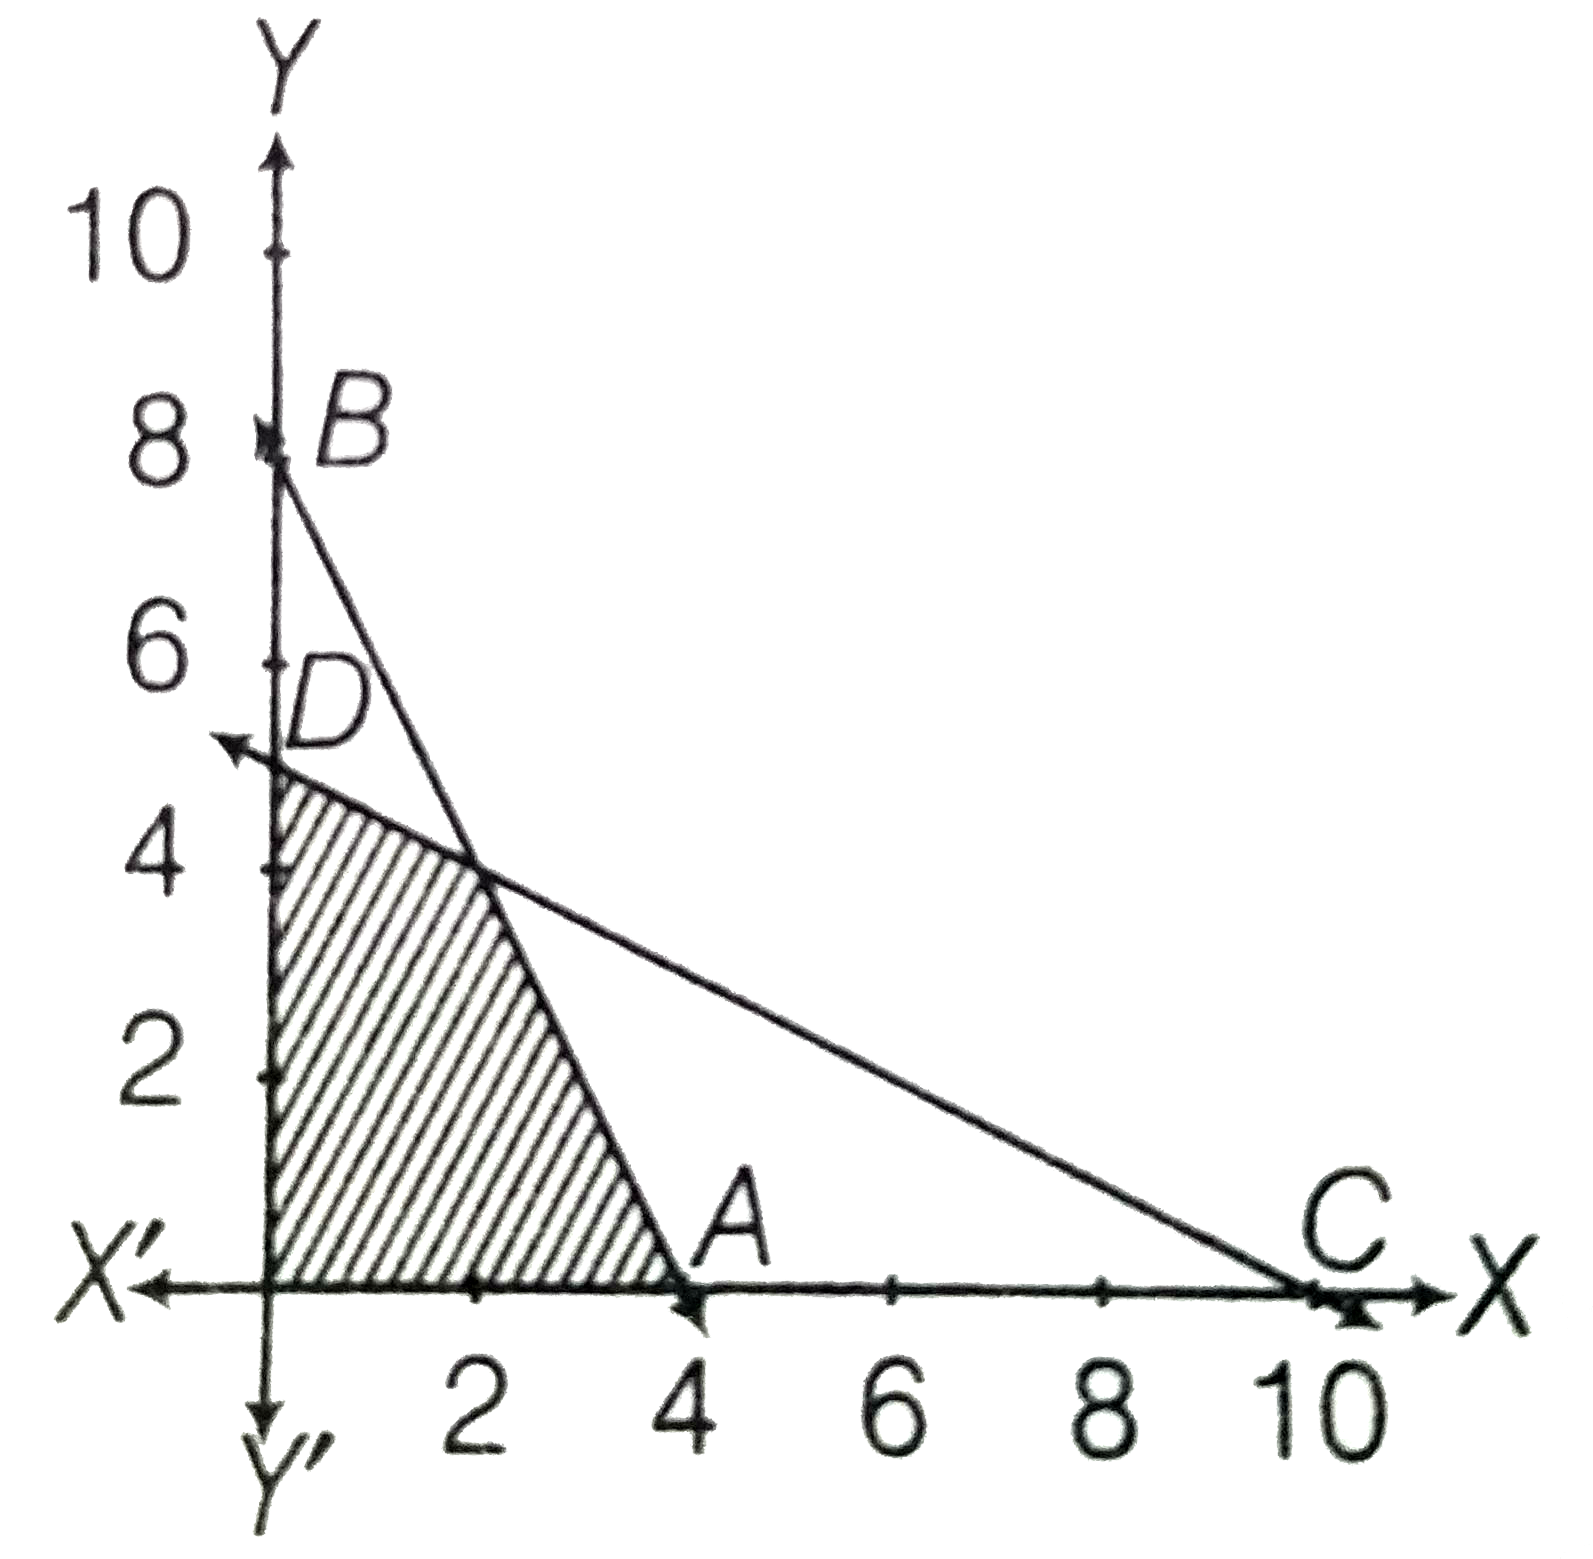 B
B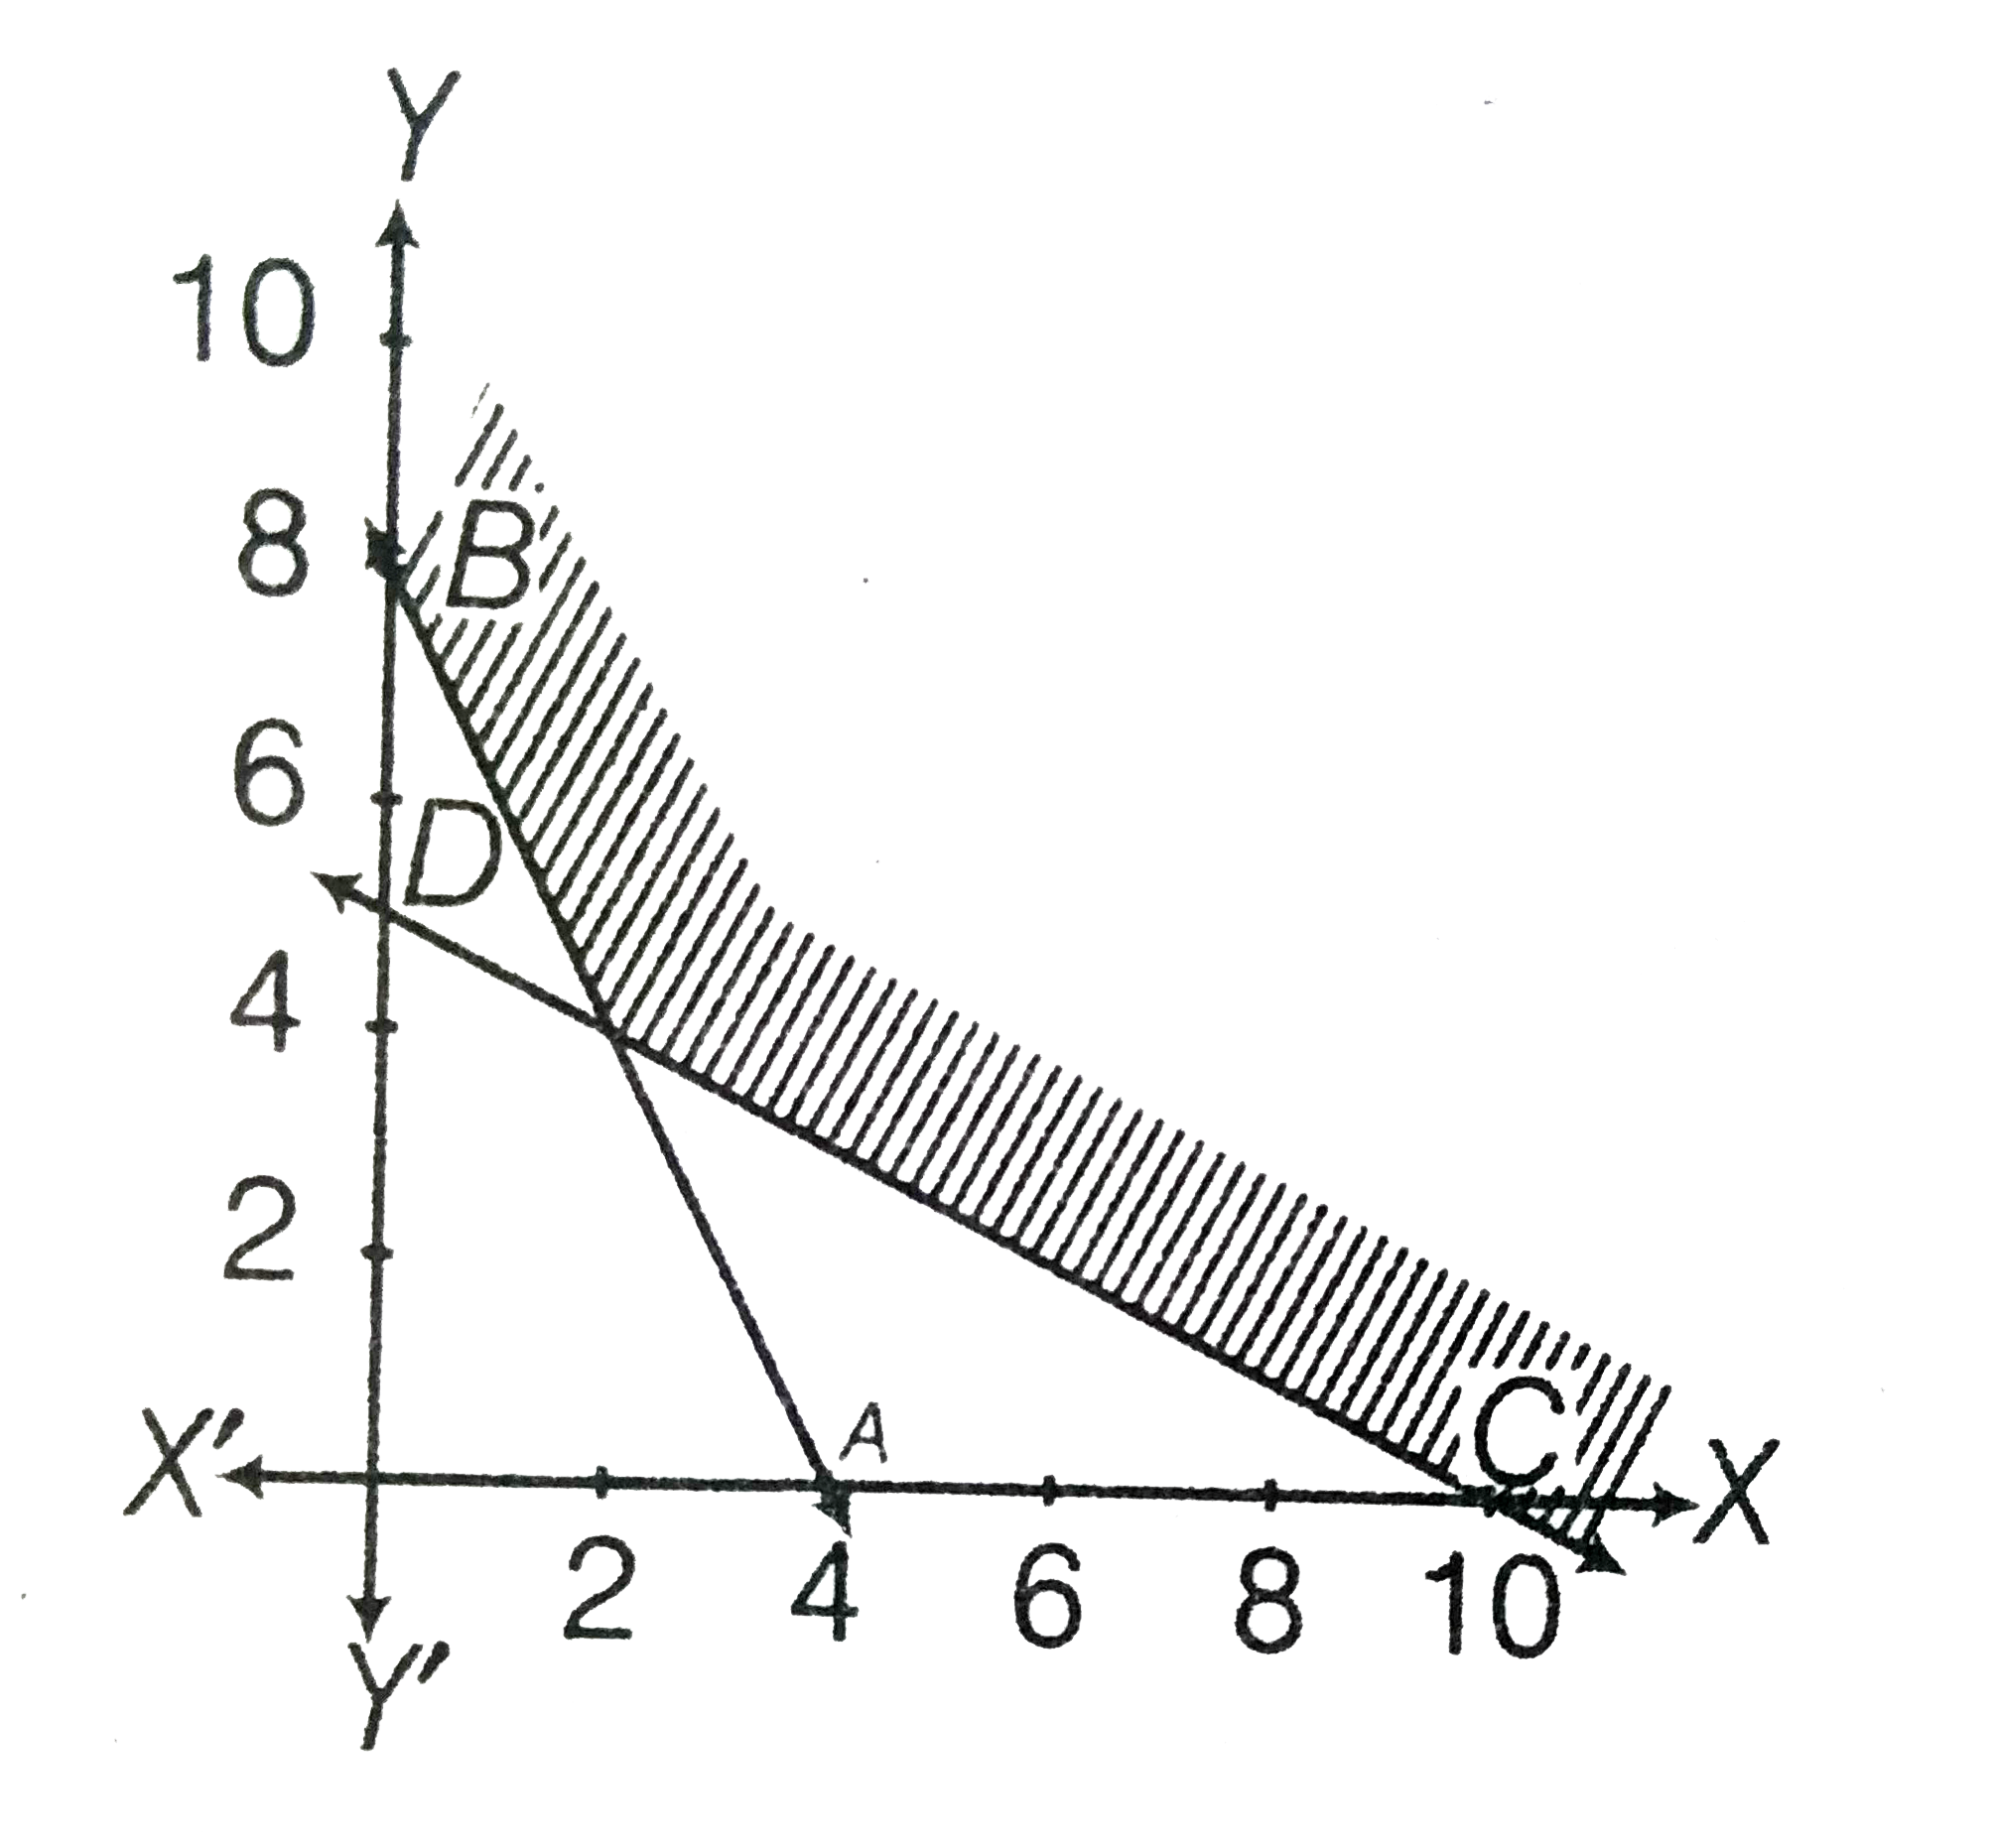 C
C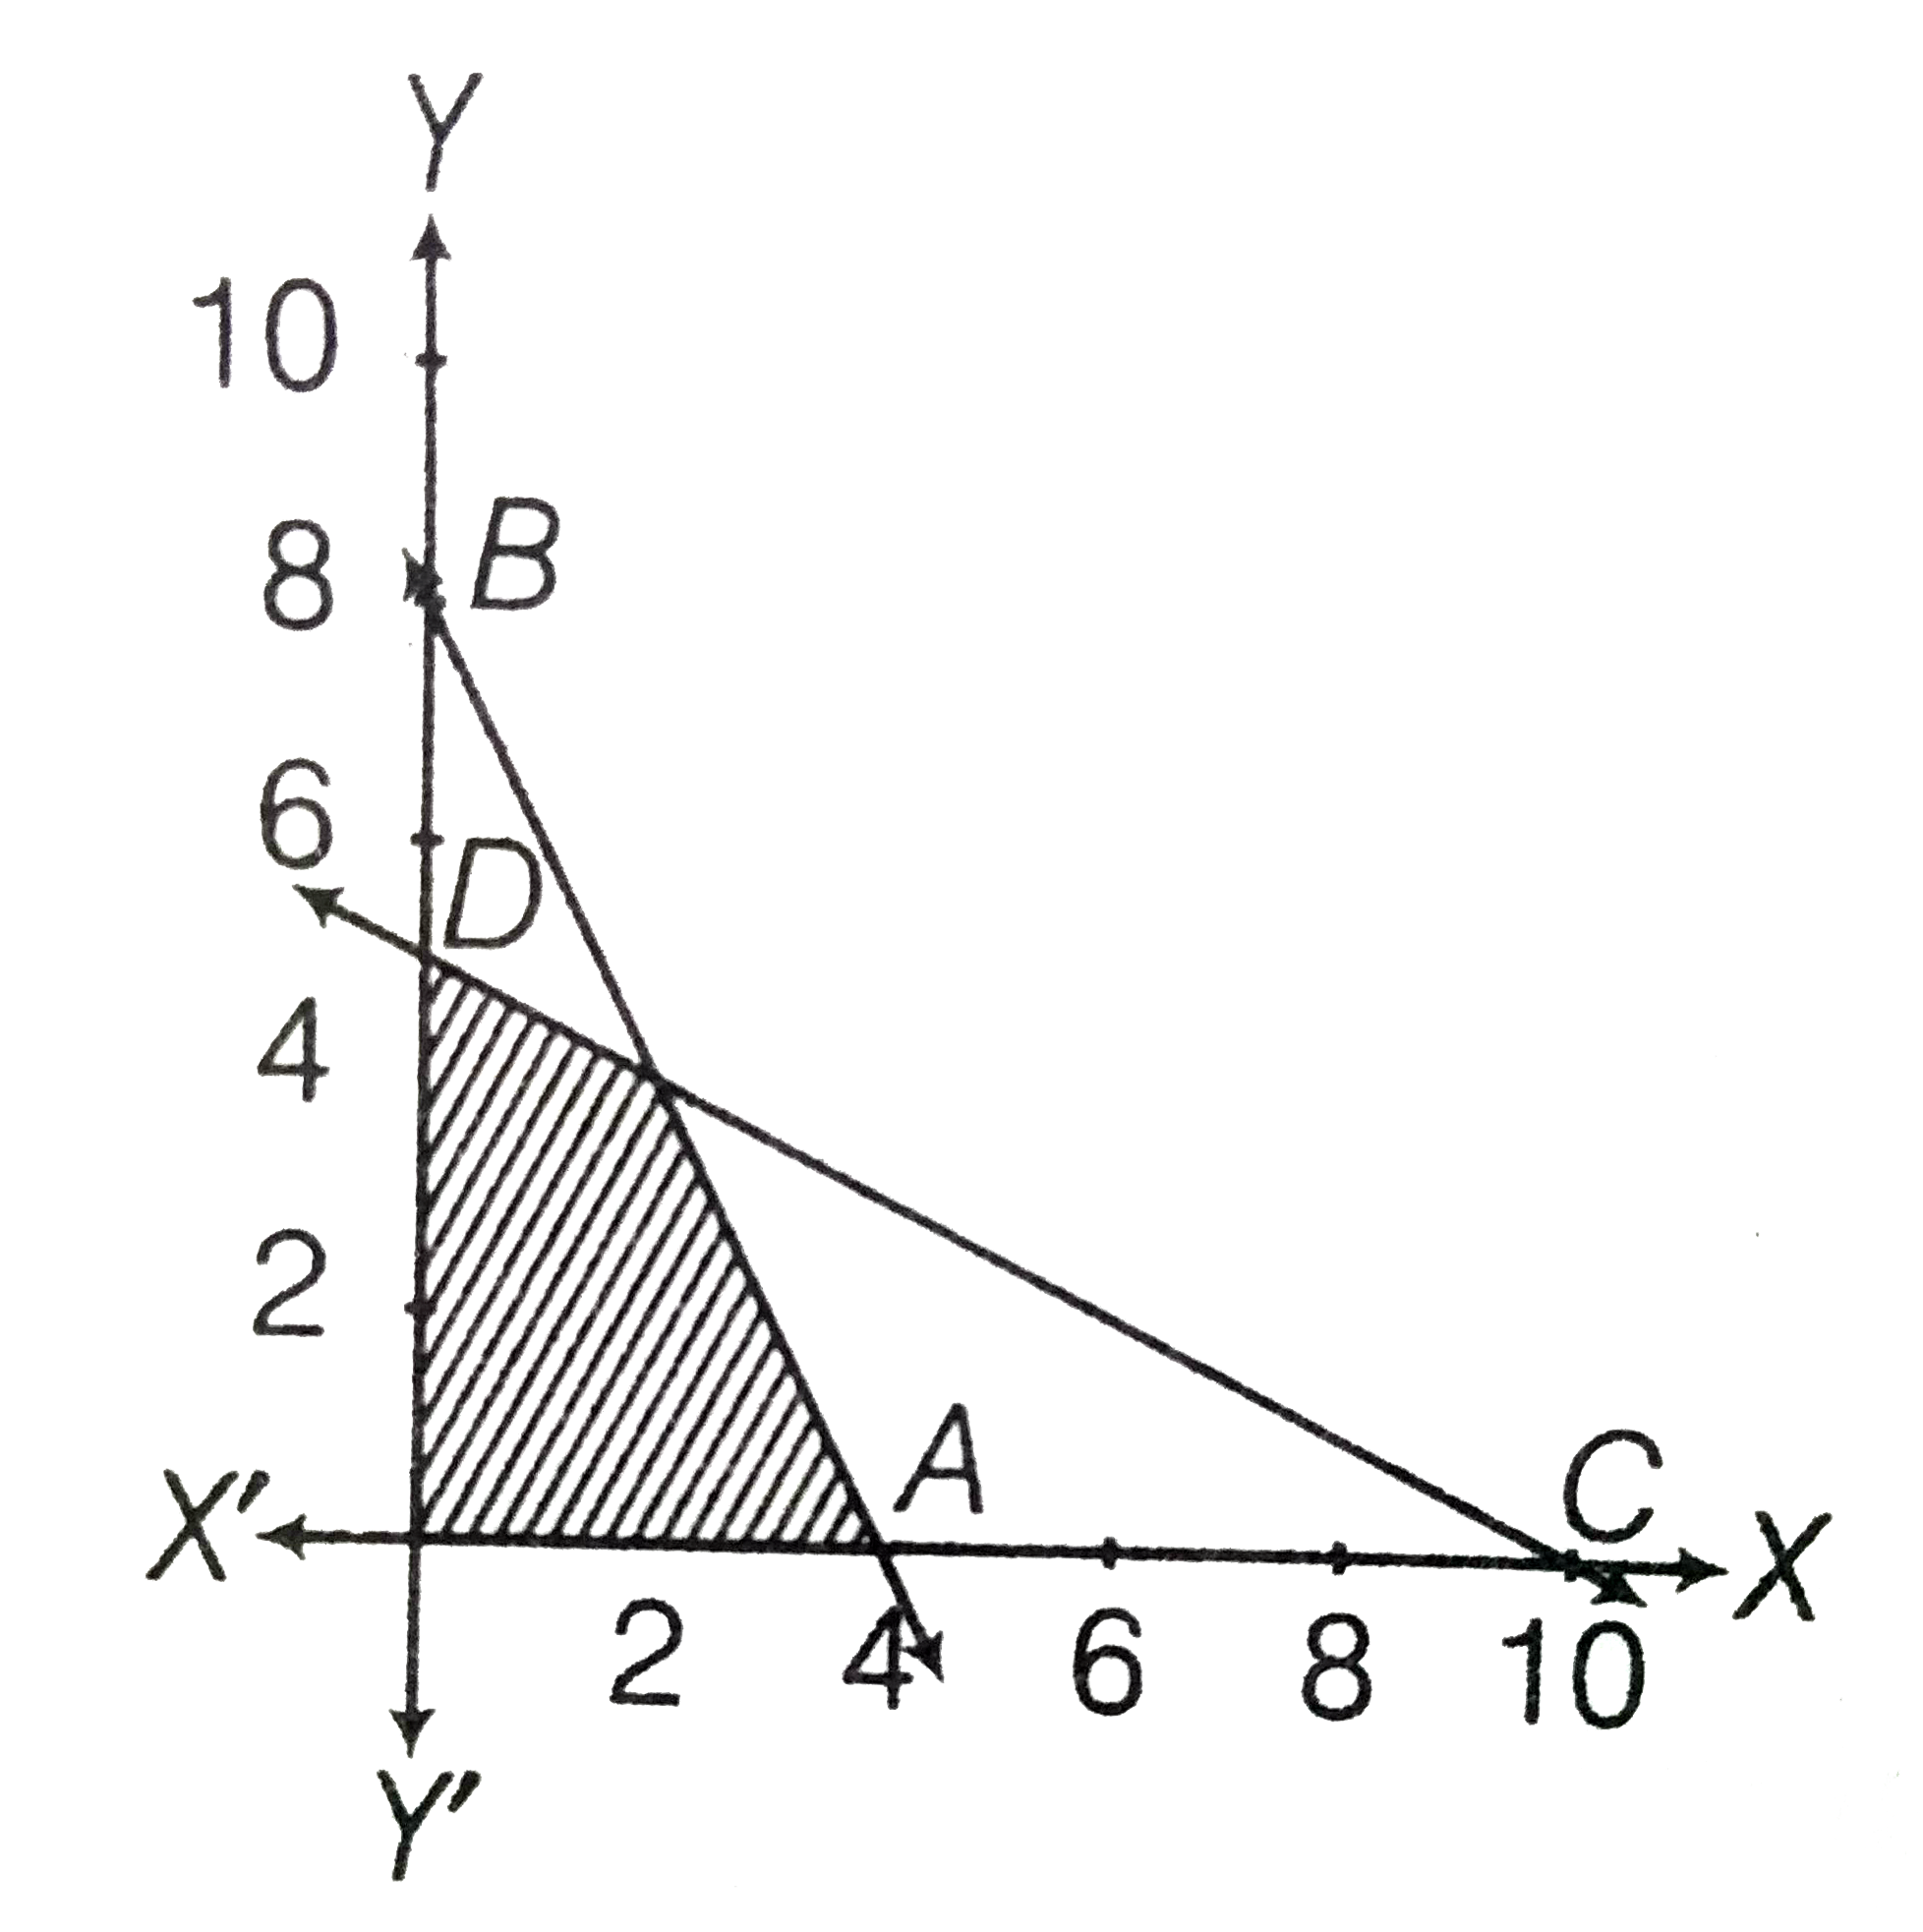 DNone of these
The solution set of the linear inequalities 2x+y≥8 and x+2y≥10 is
View SolutionThe solution set of the inequalities 2x+y≥4,x+y≤x,2x−3y≤6 is
View SolutionThe graphical solution of the inequality, x+y<5 in two-dimensional plane is
View SolutionA vertex of common graph of inequalities 2x+y≥2 and x−y≤3 , is
View SolutionThe solution of the system of inequalities x≥0,x−5≤0andx≥y is a polygonal region with the vertices as
View Solution

