The following frequency distribution table shows the distances travelled by some rickshaws in a day. Observe the table and answer the following questions :
The correct Answer is:(1) The maximum frequency is 82.
∴ the modal class is 74.5-79.5
(2) N=200∴N2=100
Cumulatvie frequency which is just greater than 100 is 102.
∴ the corresponding class 69.5-74.5 is the median class.
(3) The cumulative frequency of the class preceding the Median class is 44.
(4) Class interval (h) to calculate the median is 5.
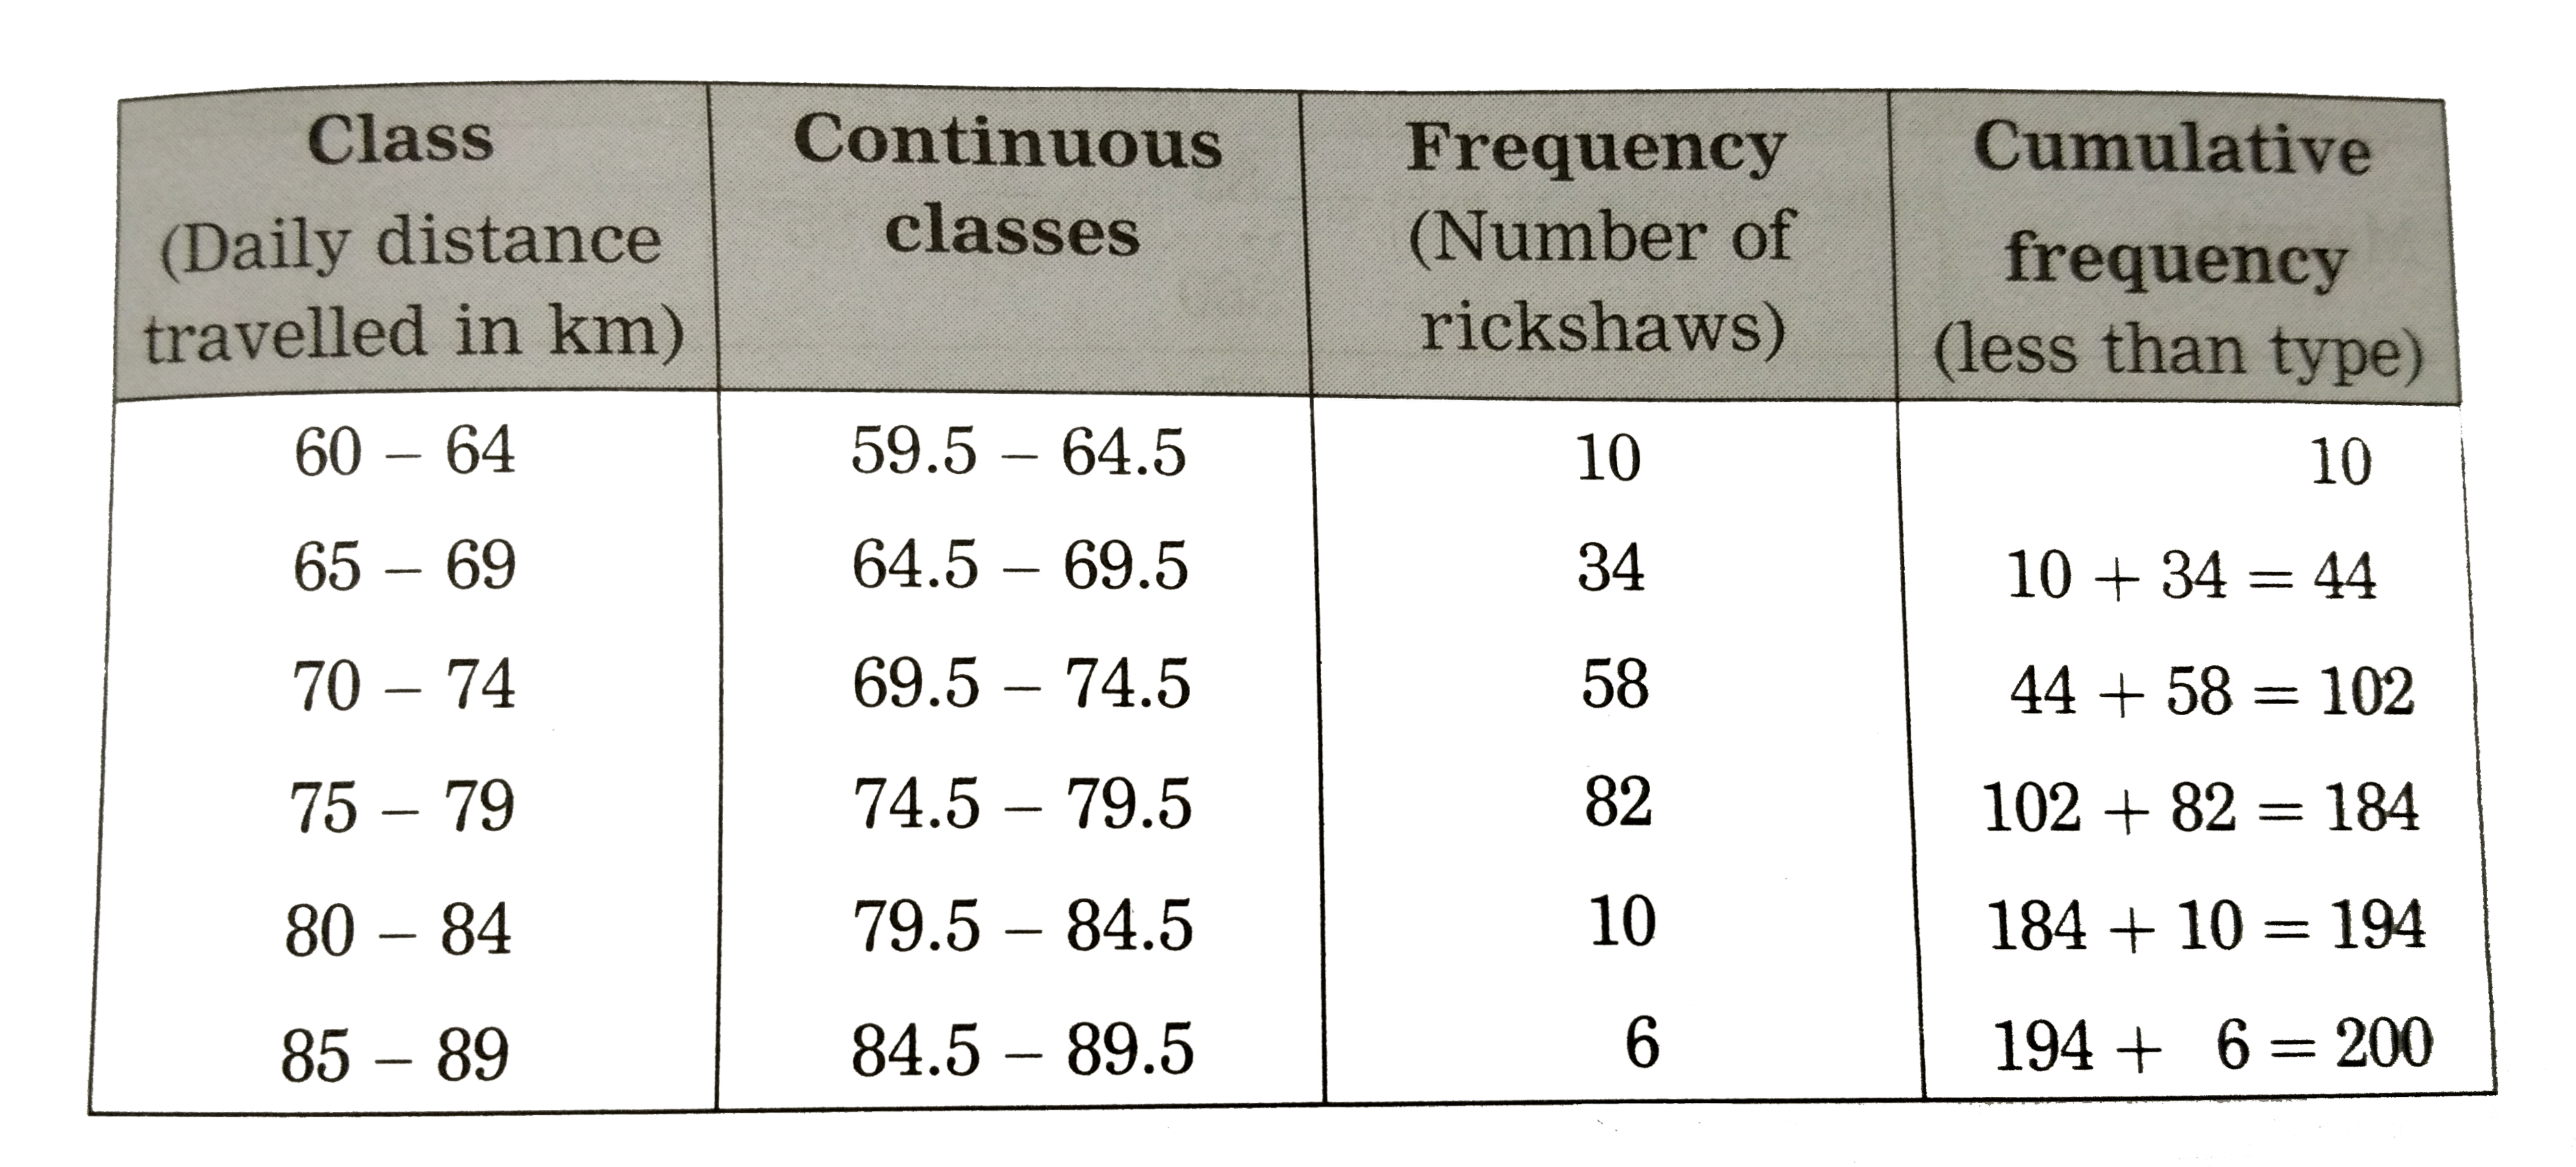
(1) Which is the modal class? Why?
(2) Which is the median class? Why?
(3) Write the cumulative frequency (cf) of the class preceding the median class.
(4) What is the class interval (h) to calcultate median?
Topper's Solved these Questions
- BOOK - NAVNEET PUBLICATION - MAHARASHTRA BOARDCHAPTER - STATISTICSEXERCISE - Assignment 6.14videos
STATISTICS
- BOOK - NAVNEET PUBLICATION - MAHARASHTRA BOARDCHAPTER - STATISTICSEXERCISE - Assignment 6.25videos
STATISTICS
- BOOK - NAVNEET PUBLICATION - MAHARASHTRA BOARDCHAPTER - SIMILARITYEXERCISE - SUBJECTIVE TYPE20videos
SIMILARITY
- BOOK - NAVNEET PUBLICATION - MAHARASHTRA BOARDCHAPTER - THEOREMS EXERCISE - CIRCLE15videos
THEOREMS
Similar Questions
The following frequency distribution table shows the distances travelled by some rickshaws in a day. Observe the table and answer the following question:
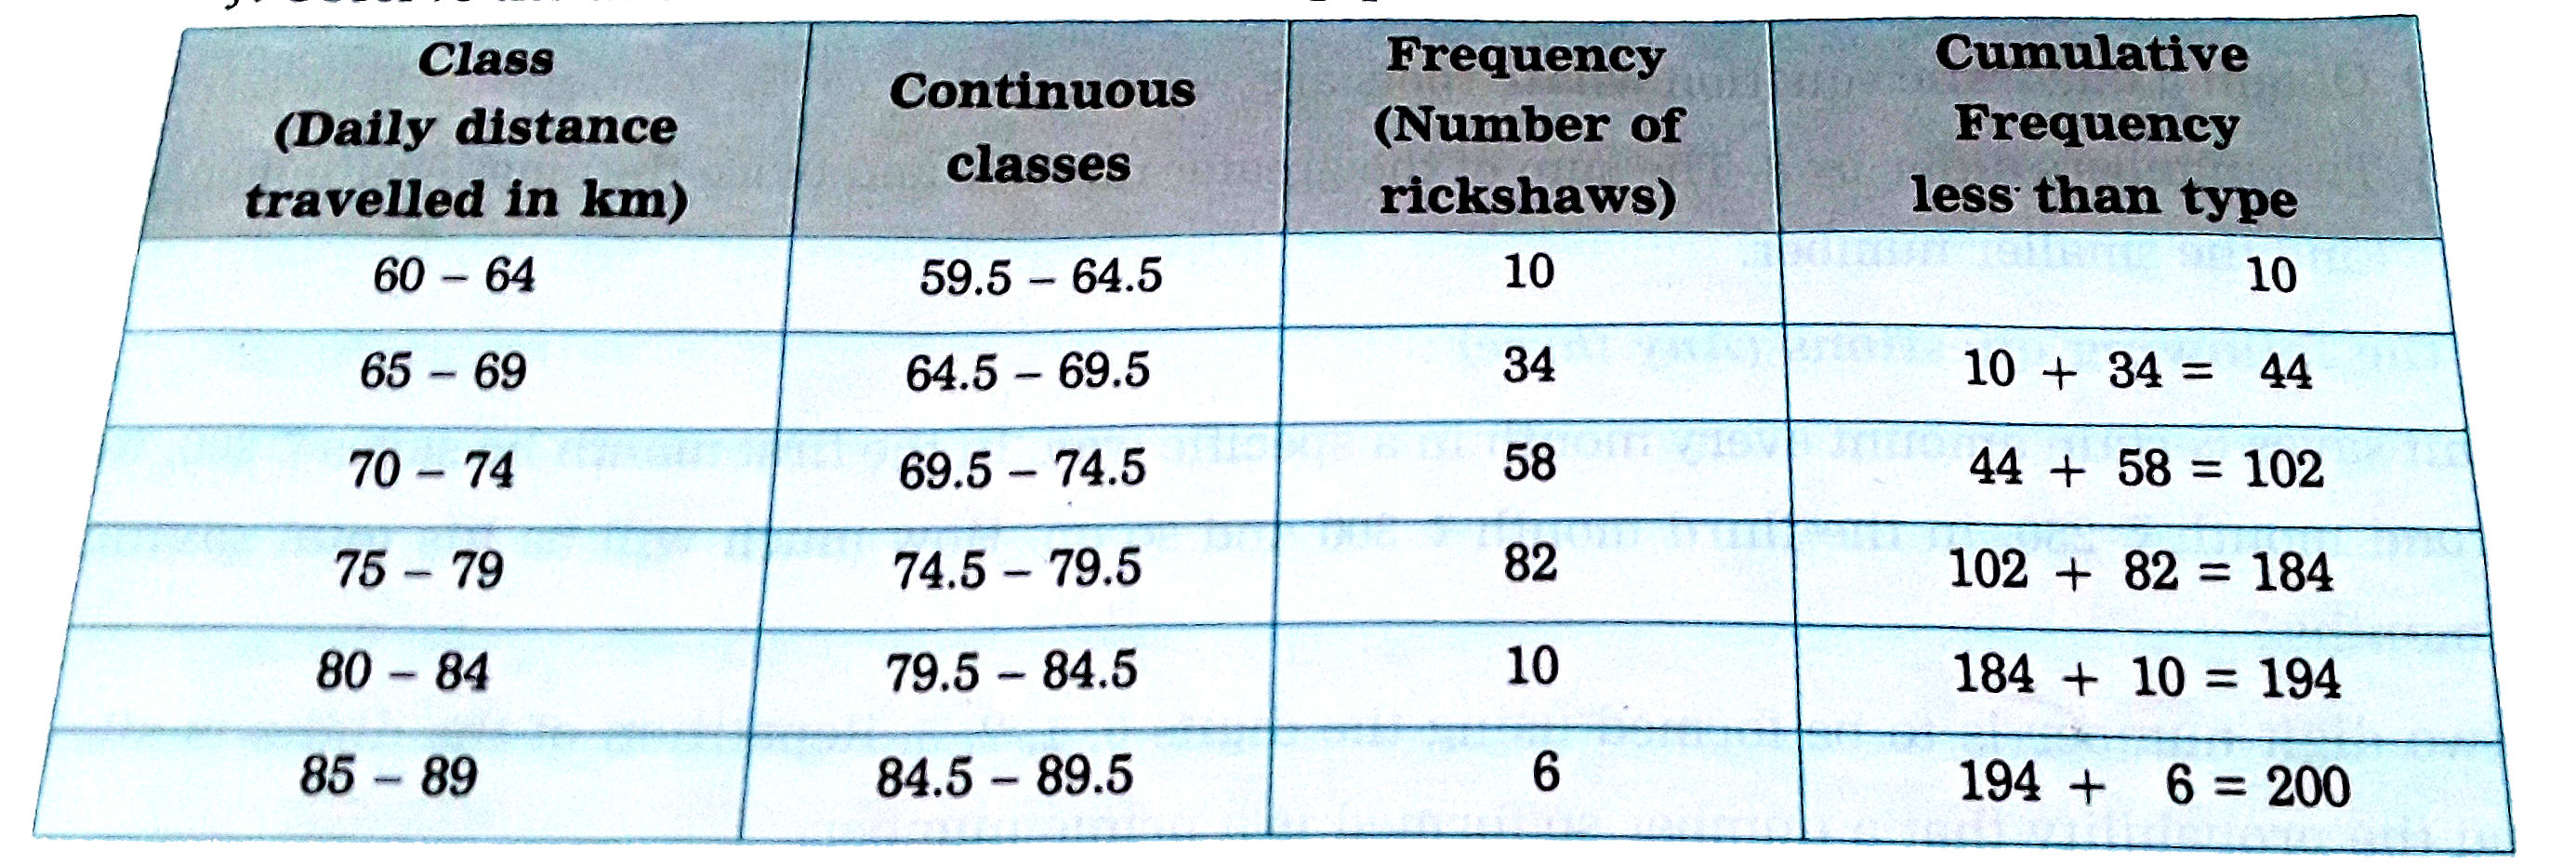
(a) which is the modal class? Why?
(b) which is the median class and why?
(c) write the cumulative frequency (c.f.) of the class preceding the median class.
(d) what is the class interval (h) to calculate median?View SolutionThe following frequency distribution table shows the distances travelled by some rickaws in a day .Observe the table and answer the following :

a. Which is the modal class ? Why ?
b. Which is the medium class and why ?
c. Write the cumulative frequency (C.F ) of the preceding the medium class .
d. what is the class interval (h) calculate medium ?View SolutionObserve the following frequency distribution table. It shows the distances travelled by 60 public transport buses in a day. Find the median of the distance travelled.
 View Solution
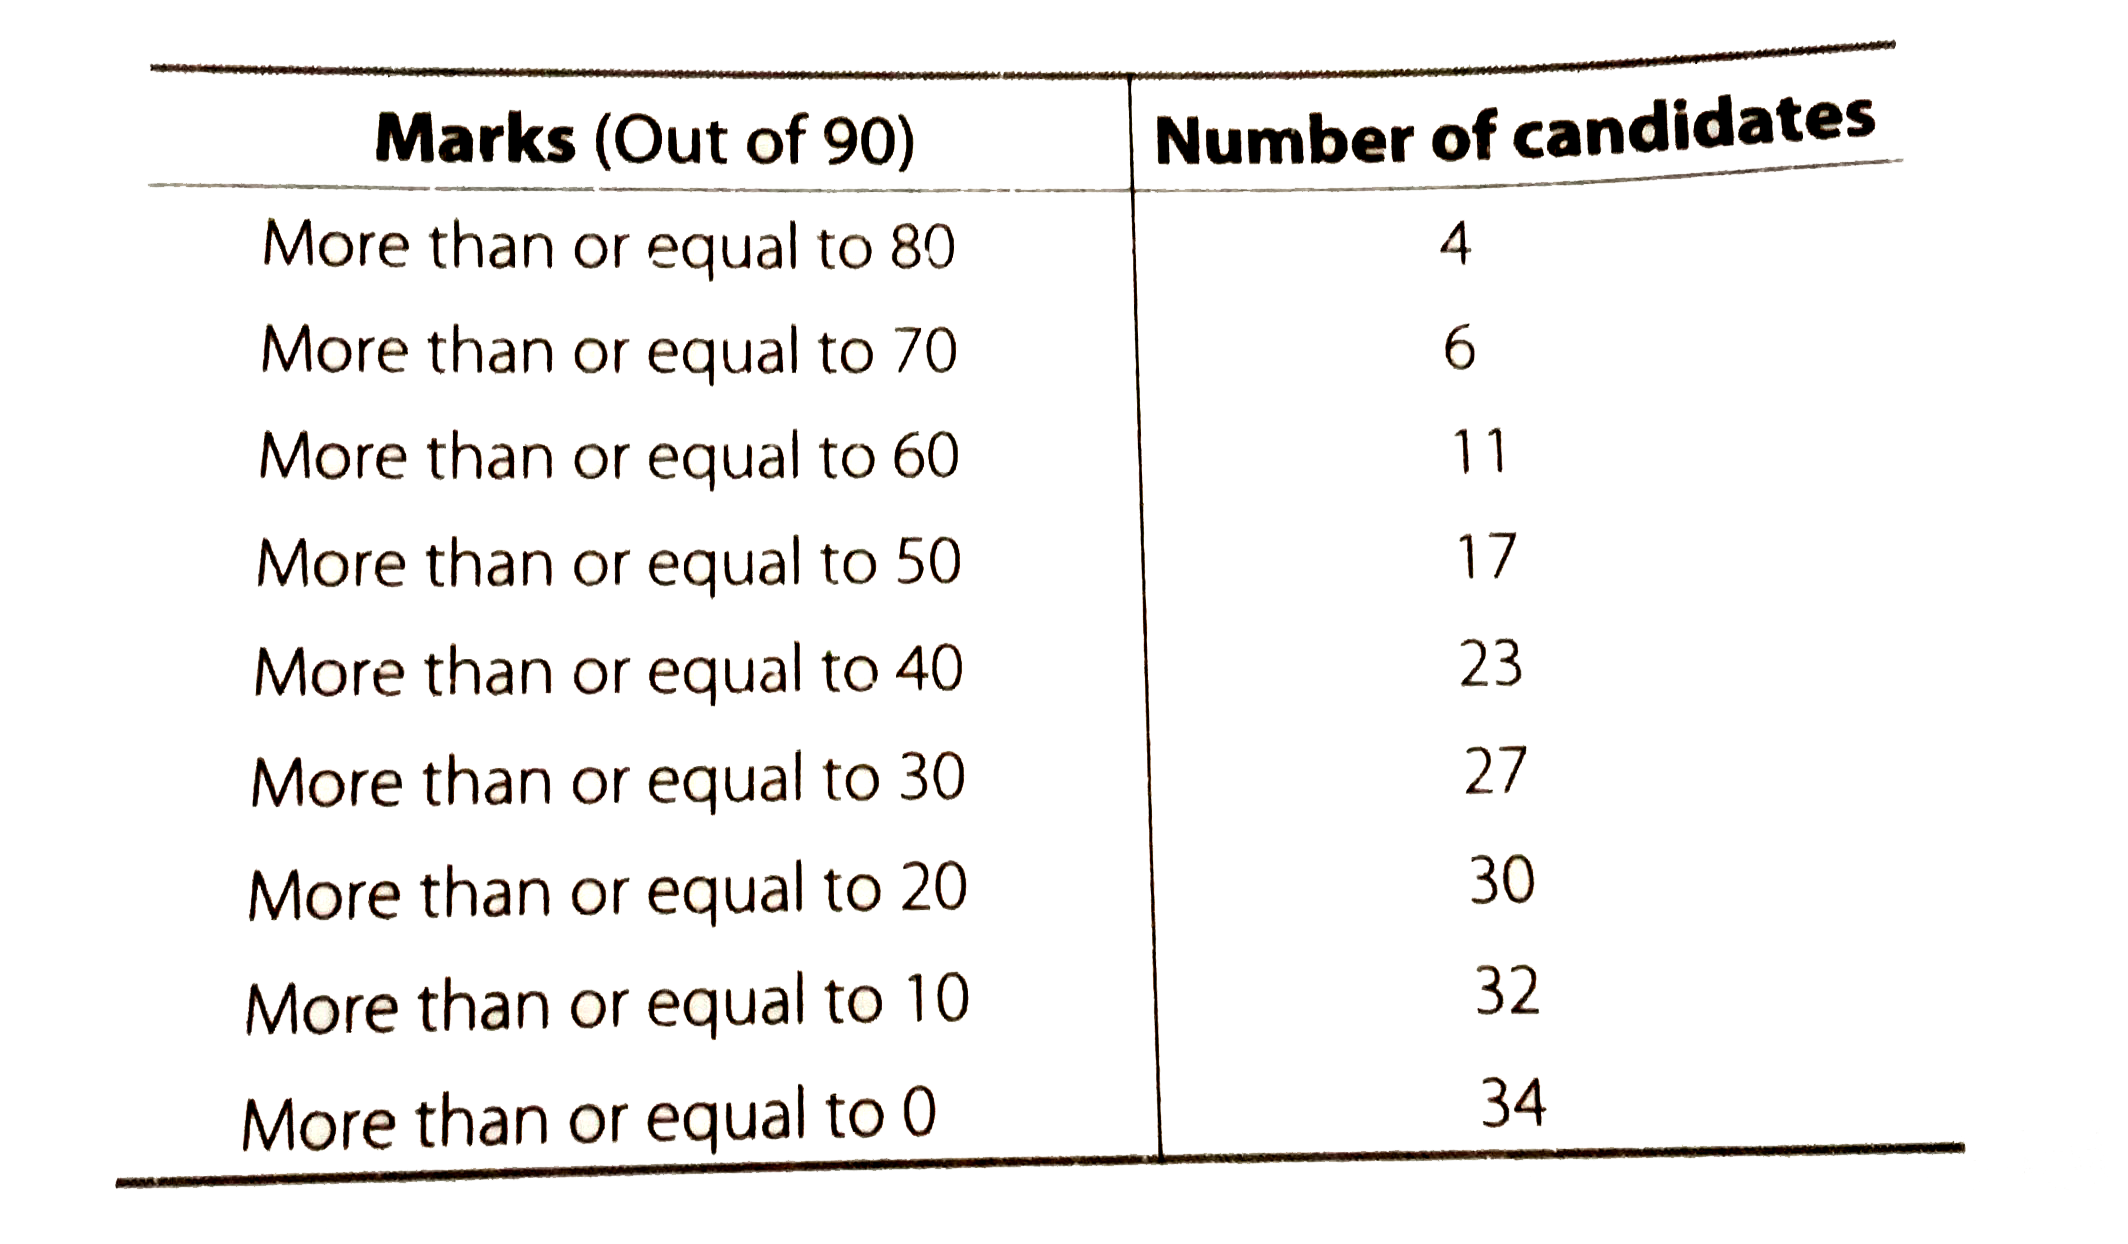
From the frequency distribution table from the following data
 View Solution
From the frequency distribution table from the following data
 View Solution
Given below is a frequency distribution table. Read it and answer the questions that follow:
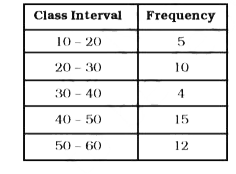
What is the class size?View SolutionForm the frequency distribution table from the following data:
Construct the frequency distribution table for the above data.
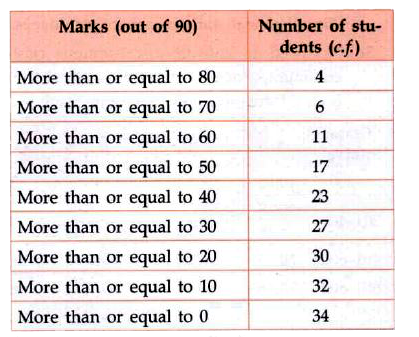 View Solution
The following table shows the frequency distribution of the time required for each worker to complete a work. From the table find the mean time required to complete the job for a worker.
 View Solution
Given below is a frequency distribution table. Read it and answer the questions that follow:
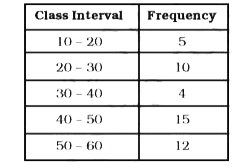
Which interval has the lowest frequency?View SolutionRead the frequency distribution table given below and answer the questions that follow:
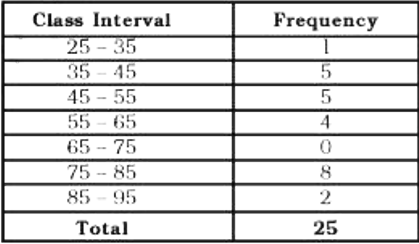
Class interval which has the lowest frequency.View Solution

